


1.Introduction
Confined masonry combines concrete columns and beams with brick walls to form a building structural system. During an earthquake, brick walls are subjected to compression and bending forces, but the concrete columns and beams provide longitudinal and lateral restraint, effectively enhancing the seismic performance of the brick walls. In this system, the brick walls are typically anchored to the sides of the concrete columns and beams to maintain their stability during earthquakes. Moreover, the walls can be reinforced by inserting vertical and horizontal reinforcement bars within the brick wall.The benefits of Confined masonry include good seismic performance, ease of construction, and the ability to reuse components. Consequently, Confined masonry has become a popular structural system for buildings in many earthquake-prone regions. [1]
In this paper, seismic performance analysis and feasible mitigation measures will be proposed for an existing 1-story simple structure based on existing codes (Seismic design guidelines for low-rise confined masonry buildings [2] and Eurocode 8 [3], etc.) and FEM software analysis results.
1.1.Background information
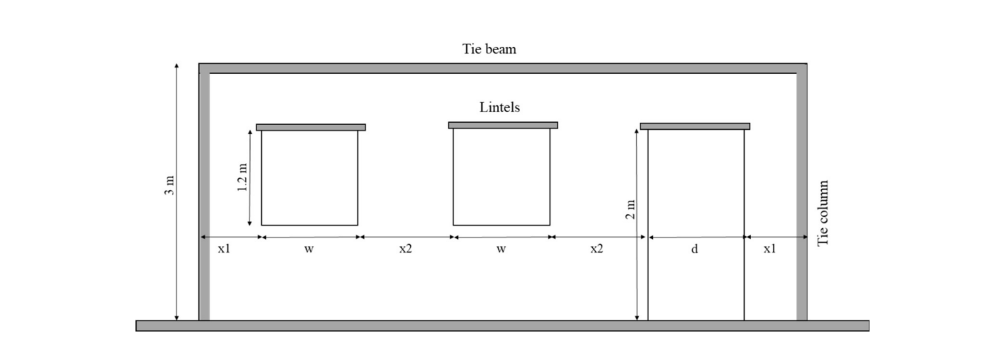
The project is a single-storey Confined masonry building whose layout is shown in Figure 1. Where L1=7m, L2=4.6m, X1=0.4m, X2=0.7m, W=1.6m, d=1.6m, X3 = 0.6m. The building is located in the high' seismic zone (PGA range 0.25g to 0.4g), in soil type B.
 (b)
(b)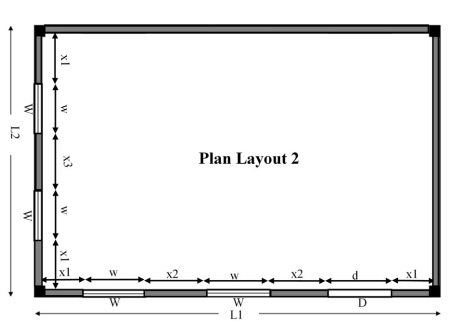 (a)
(a)
Figure 1: layout of building (a)plan view (b)front view.
2.Code-based assessment
2.1.General Planning and Design Aspects
Experience from previous earthquakes has demonstrated that the conceptual design of a building is a crucial factor in ensuring its satisfactory performance. Therefore, there are important planning and design aspects that need to be considered during the general planning phase of a building project.
In terms of general design, the Seismic design guidelines for low-rise confined masonry buildings [2] (referred to later as guidelines) require single-story buildings to meet geometric regularity and symmetry as much as possible. In this project, although the window and door distribution are not completely symmetrical, it basically meets the requirements of the guidelines. Furthermore, a certain number of shear walls are provided and are evenly distributed on the exterior of the structure to ensure shear resistance in both the east-west and north-south directions (there may be a deficiency in the north-south direction, which will be mentioned in the next point).
In terms of building dimensions, the aspect ratio is 7/4.6=1.52, which is less than the maximum 4m required by guidelines, which is satisfied. However, the guidelines mandate that in areas with high seismicity, confined wall panels located between adjacent transverse walls should not exceed a length of 4.5 meters. Additionally, for buildings featuring single brick walls of less than 15 centimeters (6 inches), the maximum length of walls between confining tie columns must be reduced to 4 meters. In contrast, for the 0.12m thick walls of this project, there are no additional restraining walls or columns within 7m along the long side, which is unsafe.
In terms of materials, the compressive strength of the concrete is 18MPa and the compressive strength of Masonry (solid clay bricks, mortar type I) is 3.5MPa, which is in accordance with the minimum values of 15Mpa and 3.5Mpa respectively as required by the guidelines. However, the yield strength of the reinforcement used for this project was 310MPa, which does not meet the Guidelines requirement of 400MPa.It is also worth discussing that although the compressive strength of Masonry meets the Guidelines requirement, it does not meet the more conservative requirement given in Eurocode 8 [3], 5MPa. This may be since the latter does not apply only to low rise buildings (less than 2 stories) etc., but it is still necessary to draw attention to it.
2.2.Masonry walls
Wall density is a key indicator of how well a low-rise building can withstand the effects of a major earthquake without collapsing and the effects of gravity loads when it is subjected to them. It is calculated via Equation 1.
\( East-West:d=\frac{Aw}{Ap}=\frac{0.12×7}{7*4.6}=2.6\% \)
\( North-South:d=\frac{Aw}{Ap}=\frac{0.12×4.6}{7*4.6}=1.7 \)
Where Ap represents the area of the building on a single floor and Aw represents the total effective area of the wall section in a single direction. For Aw, an unrestricted opening (e.g. a window or door not reinforced by a transom and a column attached to the transom) exceeding 10% of the area of that wall is not counted in the effective area. This means that the walls to the south and west cannot be counted as part of\( Aw \).
The wall density results for this project in both directions are shown in equation 1. They do not meet the guideline requirement of 2.5 (PGA>0.25g, soil type B, solid clay bricks, single layer) compared to the guideline requirement of 2.5.
In terms of wall dimensions, the wall thickness is 120mm, which is greater than the required 110m, and the wall height is 3m, which does not exceed the required 3m. At the same time, the height to thickness ratio is 25 and the height to length ratio in the north-south direction is 0.65 and meets the requirements. However, the height to length ratio in the east-west direction is 0.43 less than 0.5, which is unreasonable. [4]
2.3.Confining Elements
For the Tie-columns, their location is reasonable, but as shown earlier, the spacing is not met. For Tie-beams they are mounted in the same reasonable position, but the lintel is best reinforced by Tie-columns. For their dimensions they all meet the requirement of greater than 150mm except for the lintel.
3.Finite element method analysis
3.1.Determination of the weakest wall
In the previous chapter we have established that the wall density index of the structure does not reach 3.5%. The weakest wall will therefore be identified by the ratio of the pore space to the total area of each wall (Equation 2) and thus analysed for seismic resistance.
\( West:ρ=\frac{v}{Atotal}=\frac{2×1.6×1.2}{3*4.6}=0.278 \)
\( South:ρ=\frac{v}{Atotal}=\frac{2×1.2×1.6+2×1.6}{7*3}=0.333 \)
Based on the results the south wall is the weakest wall.
3.2.SAP2000 Analysis
In order to determine the progressive and final damage to the building progressive damage and to determine the final damage and to identify the weakest areas of the structure for improvement, Pushover Analysis was carried out on the weakest walls in this project using sap2000 software.
As this analysis is a superposition of elastic and inelastic behaviour, it is important to define the material to include not only elastic information such as strength and modulus (as in Table 1), but also inelastic curves. For bricks modelled through the concrete model, the non-linear stress-strain curve is the given curve (as in Figure 2) and the concrete non-linear properties are the default values.
Table 1: Material properties.
|
Material Properties |
Value |
Unit |
|
|
Masonry (solid clay bricks, mortar type I) |
|||
|
Unit weight |
1800 |
Kg/m4 |
|
|
Compressive strength |
3.5 |
MPa |
|
|
Young's Modulus |
1500 |
MPa |
|
|
Tensile strength |
0.2 |
MPa |
|
|
Shear strength |
0.3 |
MPa |
|
|
Concrete |
|||
|
Unite weight |
2400 |
Kg/m3 |
|
|
Compressive strength |
18 |
MPa |
|
|
Young's Modulus |
20000 |
MPa |
|
|
Steel(4*10d for Longitudinal reinforcement,6d@0.02 for stirrup) |
|||
|
Unite weight |
7840 |
Kg/m3 |
|
|
Yield strength |
310 |
MPa |
|
|
Young's Modulus |
200000 |
MPa |
|
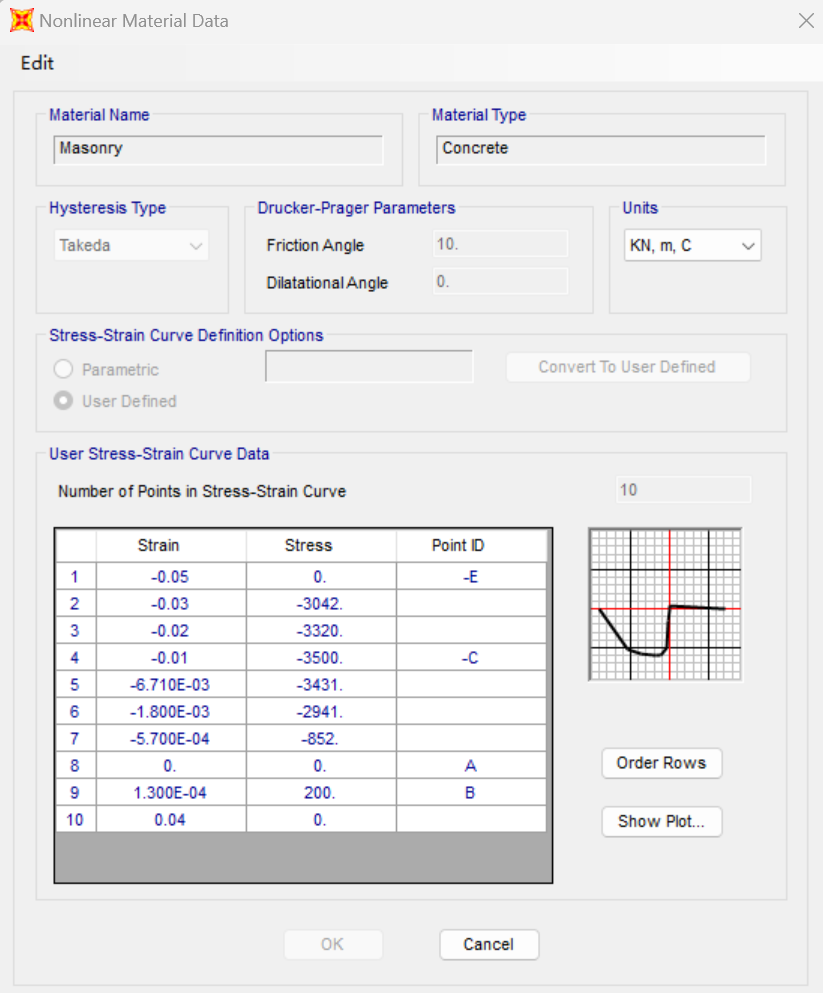
Figure 2: non-linear stress-strain curve of Masonry.
In the section setting Masonry is set to a 0.12m thick non-linear shell, while RC is set to a frame with as shown in chapter 2.4 (150*150mm for beams and columns, 120*120mm for Lintel)
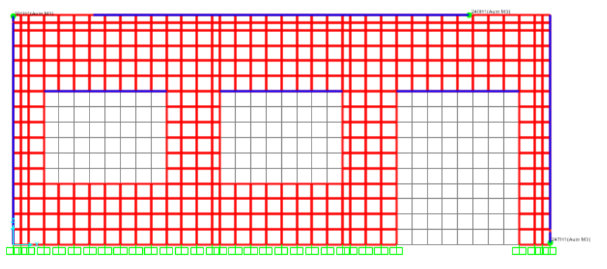
A good modelling can help the results to be closer to the true values. To better simulate the structural behaviour, the walls were divided into 0.2*0.2m elements. Then, selecting the solid elements according to the wall openings. At the same time, the part of the wall connecting to the beams and columns was divided into 0.1m to simulate the toothed connection of the bricks. The fixed end connection is also used at the base of the wall on the assumption that the foundation beneath the wall is rigid and the connection is rigid. Finally, to effectively simulate plastic hinges, this project took the frame as a whole to set hinges (Fig. 3a) and break the frame to similar element size as the shell to set hinges (Fig. 3b). It is worth noting that because the lintel is not used to connect the RC columns, it does not have a hinge.
 (a)
(a)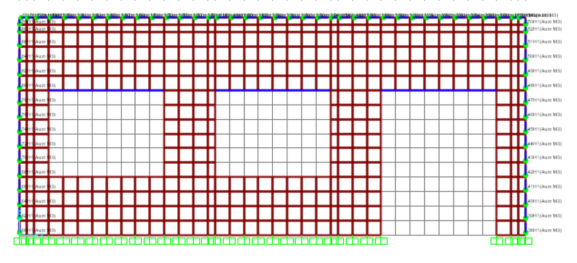 (b)
(b)
Figure 3: sap2000 model display(a)hinge for frame as a whole(b) hinge for break the frame.
Finally, since the pushover analysis is a case of static thrust and gravity superimposed, the loads were set reasonably well for this project.
3.3.Results Display
The analysis results are shown below:
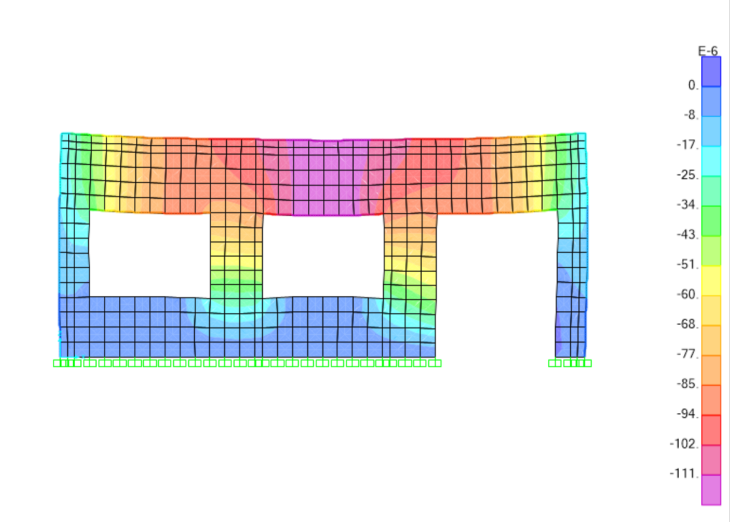
Figure 4: The shape of the deformation in the z-direction under the action of gravity.
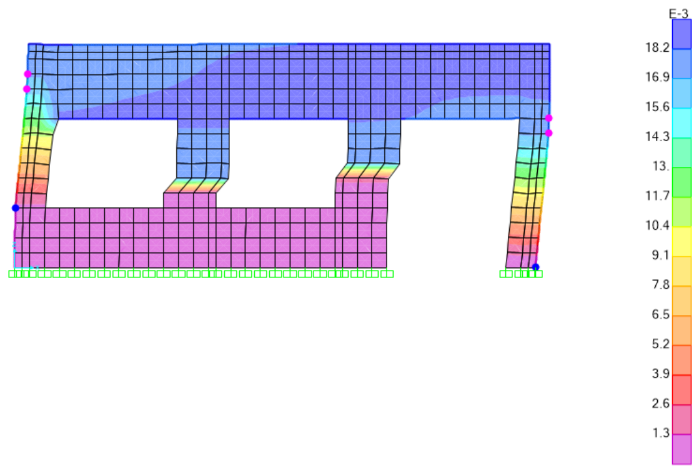
Figure 5: The shape of the deformation in the x-direction under the action of pushover.
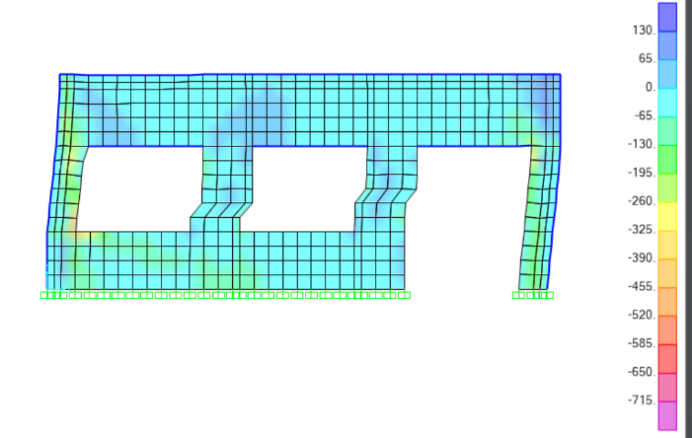
Figure 6: Display Shell Stresses under the action of pushover.
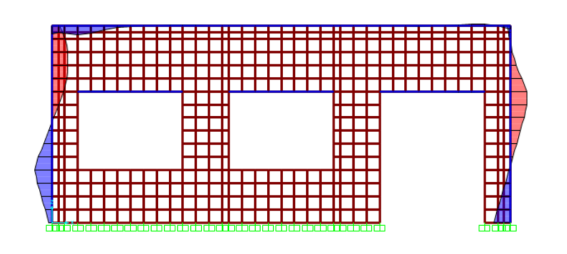
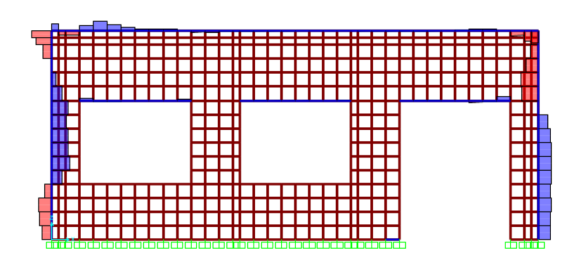
Figure 7: Display frame bending moment and shear force diagrams.
 (a)
(a)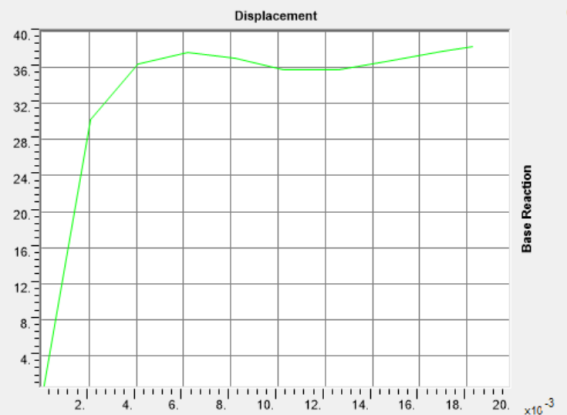 (b)
(b)
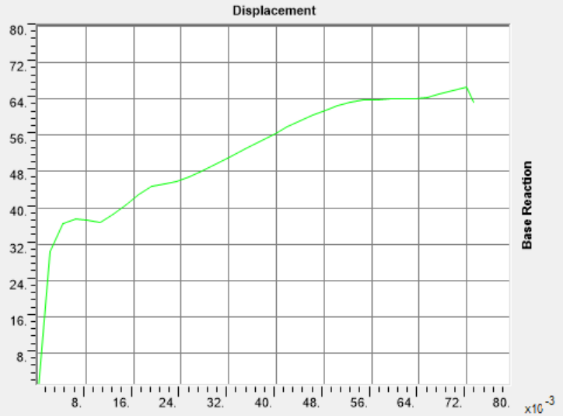
Figure 8: Resultant Base Shear vs Monitored Displacement(a)whole hinges (b) hinge for break.
For the two different hinges methods with the same settings, the difference between the first four results is not significant, but for the pushover curve the effect is greater. Once again, the results of the second method are probably closer to reality, probably because of its advantages in terms of recombination analysis and its ability to simulate plastic angles better. Also the difference between the two methods can be considered as whether the wall is grouted or not between the wall and the frame.
3.4.Performance Thresholds
According to the results of the pushover analysis it can be found that the new wall reaches its maximum shear force on the base where the value reaches approximately 36.92kN and enters the ductility phase. The project will therefore determine Engineering Demand Parameter Thresholds based on cross-sections, elements and the overall situation to further assess the damage (table 2).
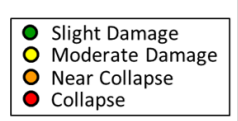
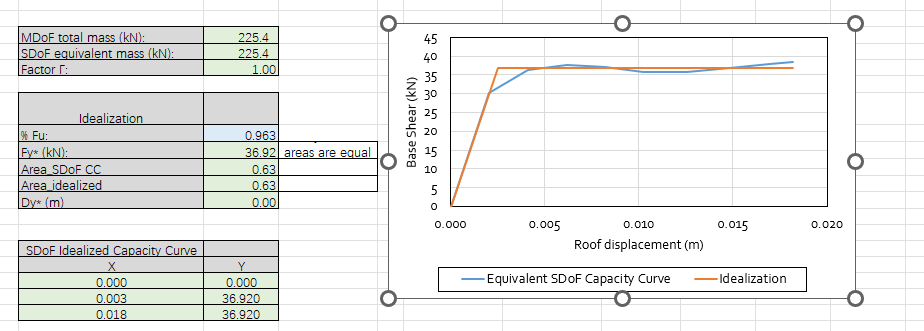
Figure 9: Analysis results of pushover analysis.
Table 2: performance thresholds.
|
Damage state |
Slight Damage or Operational Level |
Moderate Damage or Immediate Occupancy (IO) |
Near Collapse or Life Safety (LS) |
Collapse or Collapse Prevention (CP) |
|
Roof displacement (m) |
0.0025 |
0.007 |
0.012 |
0.018 |
4.N2 method Analysis
The N2 method is a method for determining the seismic strength of a structure based on the response spectrum under seismic action. This approach involves converting the capacity curve of a structure with multiple degrees of freedom (MDoF) into an equivalent capacity curve for a single degree of freedom (SDoF). The resulting curve is then compared to the inelastic response spectrum to determine the performance point of the structure. This performance point is then compared to predefined thresholds for different damage states, which allows for an assessment of the building's seismic performance [5]. The results are shown below:
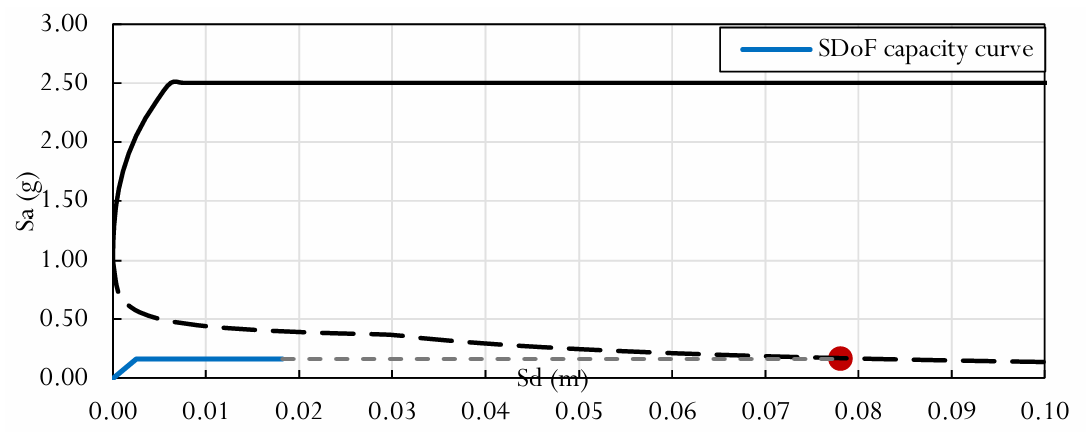
Figure 10: Result of N2 method analysis.
The performance points are the focus of the non-linear curve and the SDoF capacity curve. Based on the results, it can be seen that the performance points are located to the right of the intermediate occupancy threshold, which means that the overall seismic capacity of the structure is relatively inadequate. Although this means that the structure is safe against earthquakes, there is much room for improvement.
It is important to emphasize that the N2 method serves as a preliminary seismic performance evaluation approach and the outcomes obtained should not be interpreted as conclusive results that would certainly occur during an earthquake. Instead, the method only offers a broad understanding of the structure's response to seismic activity. Therefore, during the actual design phase, a more comprehensive analysis and evaluation should be conducted, taking into account the specific structural design and site conditions.
5.Mitigation measure
5.1.mitigation measure for EERI
For the issues raised in Chapters 2 to 4, the corresponding mitigation measure is proposed again in this chapter (Figure 11) and the reasons for proposing it are set out below:
1.Add tie columns to either side of the window and door and two tie columns to each of the unopened walls on the north and east side. Firstly, this method divides a large opening wall into a combination of multiple opening and non-opening walls. This boosts the finite wall area Aw in all directions and thus the wall density factor d. At the same time, it allows the originally unbound lintel to be connected to the foundation via the columns and become part of the overall RC bound whole. This gives full play to the role of the lintel in providing the stiffness of the overall RC restraint and reduces the weakening of the opening to the overall resultant seismic capacity. Most importantly it meets the Guidelines requirement of a clear spacing between columns of less than 4.5 and the height length ratio of each wall. Finally, it helps the wall to transfer the force of the roof to the foundation, slowing down the cracking of the wall under prolonged compression and reducing its performance, improving the overall safety of the structure. [6]
2.Addition of restrained walls running east-west and north-south within the structure. The main effect of this purpose is to increase the effective wall area Aw and the wall density d. This measure has a good economic advantage because it is more economical and safer to buy 2 bricks than to make the cross-sectional area of the original bricks twice as large compared to increasing the thickness of the external wall. At the same time, it can share the gravitational effect of the roof. At the same time, this can also extend the elastic stage length of the whole structure.
3.Increase the area of all tie beams and columns to 180mm and increase the area of lintel by 150. This is mainly to meet the Guidelines for a minimum size of 150mm. At the same time, they can improve the seismic strength of the structure.
4.In addition, measures such as increasing the wall thickness to 150mm, using 6 longitudinal reinforcement bars, reducing the general spacing between stirrups at the end of the column and extending the length of the lintel were applied to achieve increased shear strength and seismic performance. [7]
Based on these measures, the improved structural wall density, as shown in the formula, meets the requirement of greater than 2.5%.
\( East-West:d=\frac{Aw}{Ap}=\frac{0.15×(7+0.7×4+1.6+0.4×2)}{7*4.6}=5.7\% \)
\( North-South:d=\frac{Aw}{Ap}=\frac{0.15×(4.6×3-1.6×3)}{7*4.6}=4.2\% \)
It is also worth noting that in Chapter 1 it was mentioned that the yield strength of the steel bars was not up to standard, but as data for other steel types did exist, this project was mitigated by increasing the number of bars, but this does not mean, however, that the strength of the steel met the requirements.
Table 3: Major Mitigation measure.
|
1. |
Add tie columns to either side of the window and door |
|
2 |
Add two tie columns to each of the unopened walls on the north and east side |
|
3 |
Addition of restrained walls running east-west and north-south within the structure |
|
4 |
Increase the area of all tie beams and columns to 180mm and increase the area of lintel by 150. |
|
5 |
increasing the wall thickness to 150mm |
|
6 |
using 6 longitudinal reinforcement bars |
|
7 |
reducing the general spacing between stirrups at the end of the column and extending |
|
8 |
extending the length of the lintel |
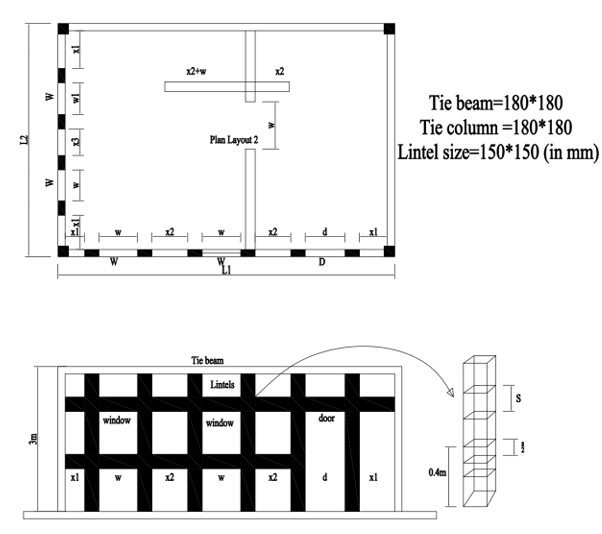
Figure 11: Display of the mitigation measure.
6.Improved model FEM analysis
This chapter is modelled in a similar way to that mentioned previously. The model is shown in Figure 12.
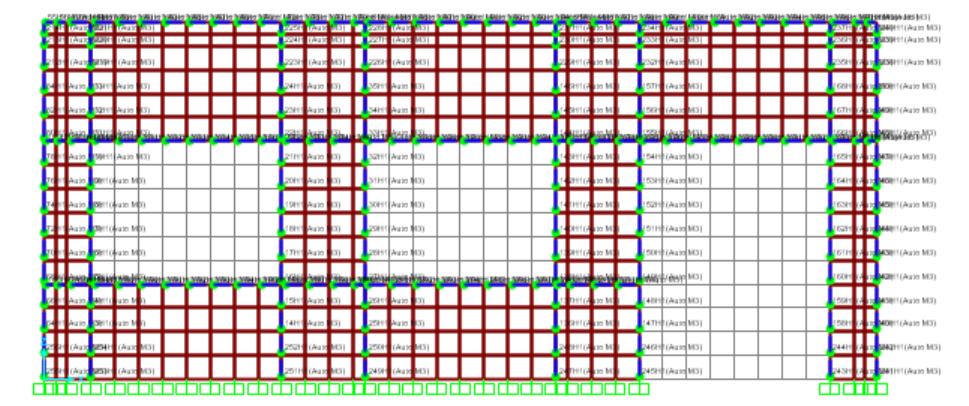
Figure 12: sap2000 model display after impove.
According to the pushover curve, it can be seen that the structure has failed at the end of the operation, so the result is a step before the destruction. The finite element results of the improved structure are shown as follows:
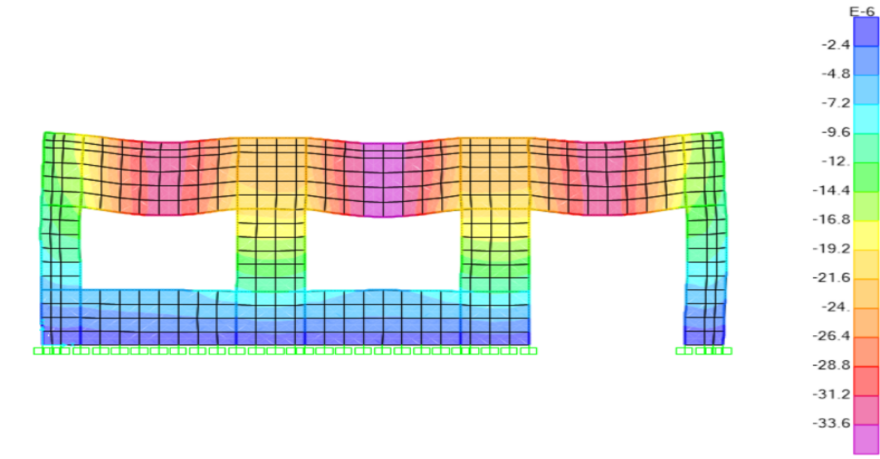
Figure 13: The shape of the deformation in the z-direction under the action of gravity after improve.
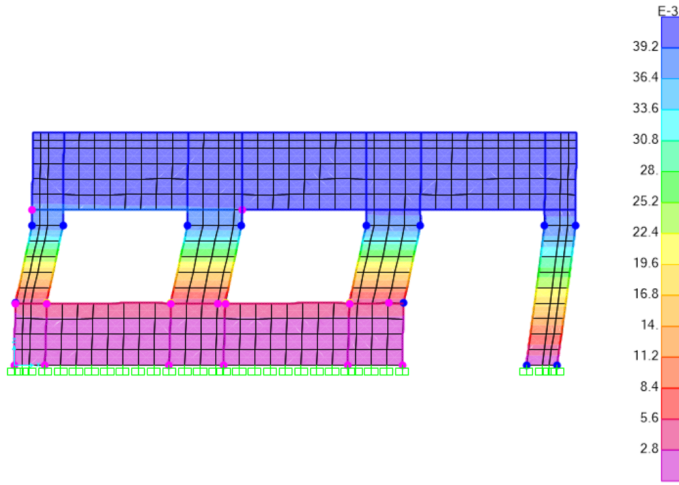
Figure 14: The shape of the deformation in the x-direction under the action of pushover after improve.
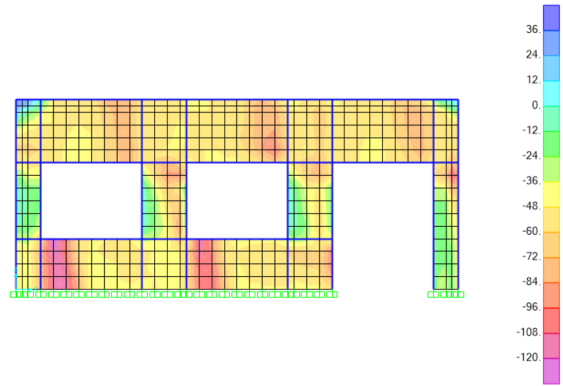
Figure 15: Display Shell Stresses under the action of pushover after improve.
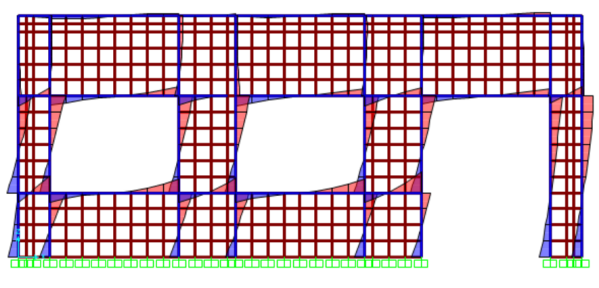
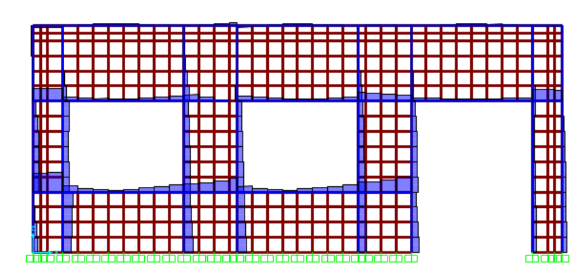
Figure 16: Display frame bending moment and shear force diagrams after improve.
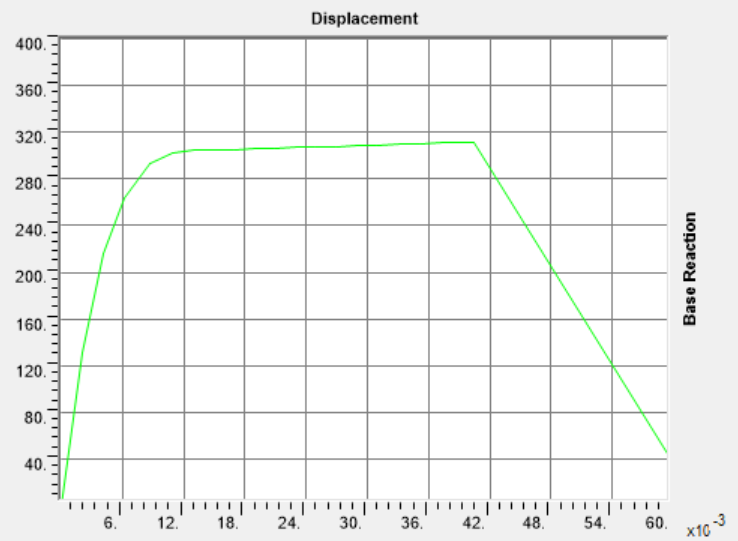
Figure 17: Resultant Base Shear vs Monitored Displacement after improve.
For pushover analysis, unfailed data is used as the material for the analysis of pushover curve.

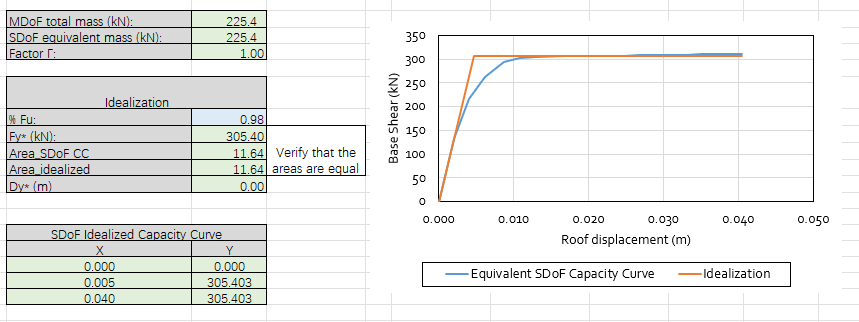
Figure 18: Analysis results of pushover analysis after improve.
According to the results of the pushover analysis it can be found that the new wall reaches its maximum shear force on the base where the value reaches approximately 305.4kn and enters the ductility phase. When the top deformation is greater than 0.04m, the structure begins to fail. The project will therefore determine Engineering Demand Parameter Thresholds based on cross-sections, elements and the overall situation to further assess the damage (table 4).
Table 4: performance thresholds after improve
|
Damage state |
Slight Damage |
Moderate Damage |
Near Collapse |
Collapse |
|
Roof displacement (m) |
0.005 |
0.018 |
0.026 |
0.040 |
By comparing with the previous results, it can be found that the threshold value of each stage has been significantly improved, which means that the seismic performance of the structure has been significantly improved. This question will be further discussed in the next chapter.
7.Comparison based on the N2 method
The output of the results based on the N2 method is as follows:
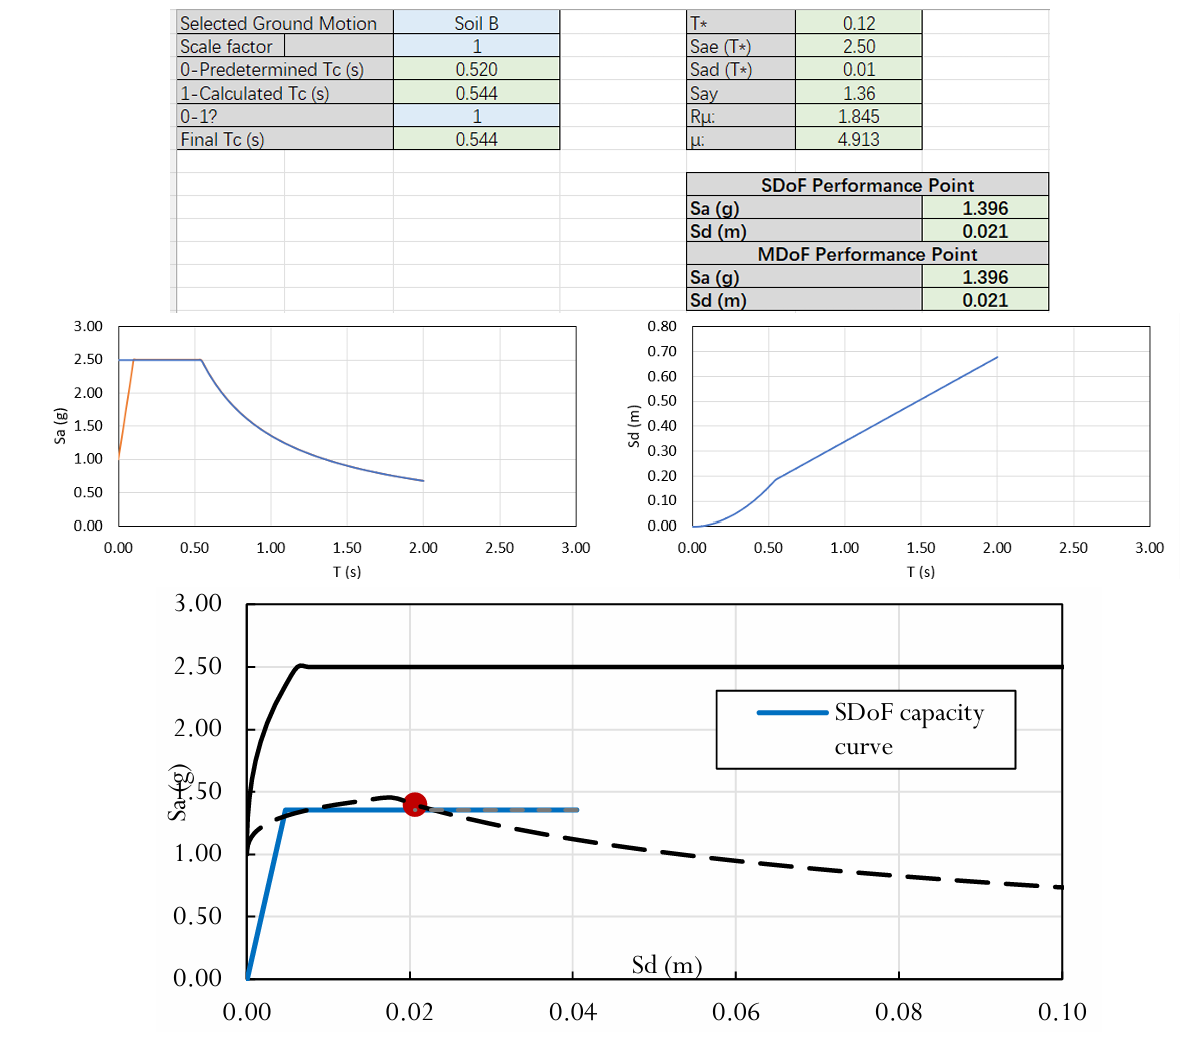
Figure 19: Result of N2 method analysis after improve.
In the improved case, the overall seismic strength of the structure is significantly improved and the performance points are much less than the immediate occupancy threshold, which is a significant difference from the pre-improvement situation and the improvements proposed in Section 4 have had the desired effect. The improved structure will only cause minor damage in the face of an earthquake and can be fixed with minor repairs, which means that its seismic strength is extremely high.
It is worth noting, however, that this upgrade was achieved far beyond the project's expectations and with an extremely large increase in cross-sectional dimensions. This means that this initiative may not be economical for the actual project because of the large investment to cope with relatively occasional loads (even in high seismic zones). In practice, therefore, there is a need to balance both sides to maximise the benefits.
8.Conclusion and discussion
This question analyses and assesses the seismic capacity of the existing project based on finite element software and relevant regulations, points out the unreasonable aspects of the design and further assesses the seismic capacity of the structure based on the N2 method. The project also proposes remedial measures, which are re-analysed and compared with the finite element software and the N2 method.
However, there are some limitations to the analysis in this paper. (1) Masonry structures usually consist of several smaller bricks or stones, and the interfaces between these are usually weak. And such connections are difficult to represent in finite elements. (2) The material properties of the bricks or stones in a masonry structure are often complex and their non-linear characteristics are difficult to represent by a simple intrinsic structure model, which requires many assumptions. (3) Many of the properties of masonry structures are related to construction conditions and quality precision, which cannot be captured by finite element models. (4) The N2 method simplifies the structure, leading to errors and uncertainties. (5) The 2D analysis ignores the interaction of pinched walls and floor slabs on the wall under analysis, but these are very important around.
References
[1]. Porter, K. (2015). A Beginner’s Guide to Fragility, Vulnerability, and Risk. Revised 23 December 2015. University of Colorado Boulder and SPA Risk LLC, Denver CO USA.
[2]. Earthquake Engineering Research Institute. (2011). Seismic design guidelines for low-rise confined masonry buildings. Earthquake Engineering Research Institute. On April 4, 2023, obtained from https://www.eeri.org/lfe/pdf/confinedmasonry.pdf.
[3]. CEN, 1994, Eurocode 8 - Design provisions for earthquake resistance of structures, European prestandards ENV 1998, European Committee for Standardization, Brussels.
[4]. BSI. (2005). BS EN 1996-1-1:2005 Eurocode 6: Design of masonry structures - Part 1-1: General rules for reinforced and unreinforced masonry structures. British Standards Institution
[5]. Fajfar, P. (2000). A Nonlinear Analysis Method for Performance Based Seismic Design. Earthquake Spectra, 16(3), 573-592.
[6]. ATC, 1996, Seismic evaluation and retrofit of concrete buildings, Vol. 1, ATC 40, Applied Technology Council, Redwood City, CA.
[7]. Federal Emergency Management Agency. (2006). NEHRP recommended provisions for seismic regulations for new buildings and other structures. FEMA P-750. Federal Emergency Management Agency. On April 4, 2023, obtained from https://www.fema.gov/media-library-data/20130726-1650-20490-4429/fema750_complete.pdf.
Cite this article
Niu,S. (2025). Seismic Resilience Evaluation and Improvement of Confined Masonry Structures Using Finite Element Analysis and the N2 Method. Applied and Computational Engineering,127,216-228.
Data availability
The datasets used and/or analyzed during the current study will be available from the authors upon reasonable request.
Disclaimer/Publisher's Note
The statements, opinions and data contained in all publications are solely those of the individual author(s) and contributor(s) and not of EWA Publishing and/or the editor(s). EWA Publishing and/or the editor(s) disclaim responsibility for any injury to people or property resulting from any ideas, methods, instructions or products referred to in the content.
About volume
Volume title: Proceedings of the 5th International Conference on Materials Chemistry and Environmental Engineering
© 2024 by the author(s). Licensee EWA Publishing, Oxford, UK. This article is an open access article distributed under the terms and
conditions of the Creative Commons Attribution (CC BY) license. Authors who
publish this series agree to the following terms:
1. Authors retain copyright and grant the series right of first publication with the work simultaneously licensed under a Creative Commons
Attribution License that allows others to share the work with an acknowledgment of the work's authorship and initial publication in this
series.
2. Authors are able to enter into separate, additional contractual arrangements for the non-exclusive distribution of the series's published
version of the work (e.g., post it to an institutional repository or publish it in a book), with an acknowledgment of its initial
publication in this series.
3. Authors are permitted and encouraged to post their work online (e.g., in institutional repositories or on their website) prior to and
during the submission process, as it can lead to productive exchanges, as well as earlier and greater citation of published work (See
Open access policy for details).
References
[1]. Porter, K. (2015). A Beginner’s Guide to Fragility, Vulnerability, and Risk. Revised 23 December 2015. University of Colorado Boulder and SPA Risk LLC, Denver CO USA.
[2]. Earthquake Engineering Research Institute. (2011). Seismic design guidelines for low-rise confined masonry buildings. Earthquake Engineering Research Institute. On April 4, 2023, obtained from https://www.eeri.org/lfe/pdf/confinedmasonry.pdf.
[3]. CEN, 1994, Eurocode 8 - Design provisions for earthquake resistance of structures, European prestandards ENV 1998, European Committee for Standardization, Brussels.
[4]. BSI. (2005). BS EN 1996-1-1:2005 Eurocode 6: Design of masonry structures - Part 1-1: General rules for reinforced and unreinforced masonry structures. British Standards Institution
[5]. Fajfar, P. (2000). A Nonlinear Analysis Method for Performance Based Seismic Design. Earthquake Spectra, 16(3), 573-592.
[6]. ATC, 1996, Seismic evaluation and retrofit of concrete buildings, Vol. 1, ATC 40, Applied Technology Council, Redwood City, CA.
[7]. Federal Emergency Management Agency. (2006). NEHRP recommended provisions for seismic regulations for new buildings and other structures. FEMA P-750. Federal Emergency Management Agency. On April 4, 2023, obtained from https://www.fema.gov/media-library-data/20130726-1650-20490-4429/fema750_complete.pdf.