


1. Introduction
A certain natural gas station, serving as a hub for oilfield production and transportation, is an important site for storing and transferring oilfield output. The station has a complex layout of facilities and equipment, numerous pipelines, and complicated operations, involving gaseous media such as methane and hydrogen sulfide. The risk of leakage is relatively high, which may lead to resource wastage at best, or, in more serious cases, explosions, poisoning, and other dangerous incidents, resulting in casualties, economic losses, and negative social impacts. Therefore, conducting research on the leakage diffusion of different gas components within a natural gas station can effectively reduce accident risks, achieving the goal of "controlling and minimizing risks." Based on the diffusion patterns of leaks, corresponding management, maintenance, inspection, and emergency evacuation plans can be developed, which are of significant importance for ensuring the safe and smooth operation of the station.
The leakage of station facilities and equipment in different environments is a complex process, not only related to factors such as the leakage aperture of the equipment itself but also closely linked to the external environment. In response to this complex process, numerous scholars at home and abroad have developed various mathematical models for study. In the 1970s and 1980s, relevant scholars abroad conducted research on leakage rate models. Foreign scholars O. Leven and D. Kunii [1] proposed related theories on pipeline leakage in 1969, followed by models for pipeline rupture and hole leakage calculations. Woodward and Mudan [2] proposed theories on small hole leakage models based on the theory of pipeline rupture and hole leakage, and developed corresponding calculation methods for different situations. Helena Montiel [3] provided a detailed classification of hole leakage, proposed a large hole leakage model, and analyzed the model calculations under both steady-state and unsteady-state conditions, improving theoretical research on hole leakage. In 2002, J. D. Young [4] conducted an investigation into the safety issues of gas leakage diffusion in pipelines, establishing simplified equations based on pipeline diameter, pressure, and affected area, and developed fire hazard area estimation formulas based on gas jets, combustion rates, and heat flux density. Kai Yang et al. [5] used CFD methods to study the influence of leakage location on the concentration distribution of hydrogen-enriched natural gas leakage in public tunnels, finding that the larger the distance between the leakage point and the exhaust, the more easily HBNG spreads within the tunnel. Bowen Ouyang et al. [6] established a numerical model for HBNG pipelines, analyzing the effects of hydrogen during pipeline operation. The results showed that as the HBR increased, the pipeline flow also increased. When the HBR reached a certain threshold, there was a linear relationship between the pressure drop and the extent of cracking in the pipeline. Sirui Tong et al. [7] conducted large-scale simulations for a hydrogen-enriched natural gas station, studying the impact of gas leakage and ensuring the response to accidents. The results indicated that high-pressure pipeline leaks released more combustible gases. At 4 MPa, a 100-second leak could accumulate 2329 m³ of combustible gas clouds.
Currently, research on gas leakage diffusion in China is not yet sufficient. Most studies are theoretical and lack practical application in actual field operations. Therefore, establishing a three-dimensional model for a natural gas station, conducting finite element simulations to study the impact of factors such as wind speed, wind direction, and leakage aperture on the diffusion process of methane and hydrogen sulfide (the two main hazardous gases), testing the effectiveness of the station’s gas sensor layout, and optimizing it, are of significant importance. This study will help in understanding the characteristics of gas leakage diffusion within the station, developing emergency response plans, reducing environmental and safety risks, and ensuring the safe and efficient operation of the station.
2. Establishment of Natural Gas Station Model
A certain natural gas station was selected for modeling, with its site plan shown in the figure below. The station consists of six main areas: the oil tank area, which contains oil tanks; the separator area, which includes separators and a gas distribution station; the sewage treatment area, which contains produced water storage tanks and a pump room; the pump shelter production area, which includes a pump shelter and steam heat exchangers; the photovoltaic area, which contains solar photovoltaic devices; and the fire protection area, which includes accident tanks, fire water tanks, and a fire pump room. The devices involving natural gas include oil tanks and separators.
During the modeling process, the north direction was selected as the positive x-axis and the east direction as the positive y-axis. After simplifying the equipment, a 1:1 geometric model of the station was established, as shown in Figure 1.
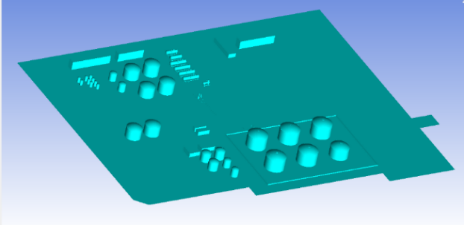
Figure 1: Geometric Model of the Natural Gas Station
2.1. Mathematical Model
When leakage occurs in the station's equipment, gas leaks from the leakage point and diffuses into the surrounding air. For the convenience of establishing the leakage model and performing simulation calculations, the following assumptions were made about the leakage point and leakage form:
(1) The pressure at the leakage point remains constant throughout the entire leakage process, and the leakage occurs continuously and uniformly.
(2) The leaking gas does not chemically react with the surrounding medium, and the leakage process involves the transfer of multiple components of the mixture.
Mass Conservation Equation:
\( \frac{∂ρ}{∂t}+\frac{∂}{∂{x_{i}}}(ρ{u_{i}})=0 \)
Where:
\( ρ \) is the density of the mixture, kg/m³
\( {u_{i}} \) is the velocity component in the i-direction, m/s
Momentum Conservation Equation:
\( \frac{∂}{∂t}(ρ{u_{i}})+\frac{∂}{∂{x_{j}}}(ρ{u_{i}}{u_{j}})=-\frac{∂p}{∂{x_{i}}}+\frac{∂{τ_{ij}}}{∂{x_{j}}}+ρ{g_{i}} \)
Where:
\( ρ \) is the density of the mixture, kg/m³
\( {u_{i}} \) is the velocity components in the x, y, z directions, m/s
p is the static pressure, Pa
g is the gravitational acceleration in the i-direction, m/s²
F represents external body forces in the i-direction
The stress tensor is represented as:
\( {τ_{ij}}=[μ(\frac{∂{u_{i}}}{∂{x_{j}}}+\frac{∂{u_{j}}}{∂{x_{i}}})]-\frac{2}{3}μ\frac{∂{u_{l}}}{∂{x_{l}}}{δ_{ij}} \)
Energy Conservation Equation:
\( \frac{∂(ρT)}{∂t}+div(ρuT)=div(\frac{k}{{c_{p}}}gradT)+{S_{T}} \)
Where:
\( ρ \) is the density of the mixture, kg/m³
\( {c_{p}} \) is the specific heat at constant pressure, J/(kg·K)
T is the thermodynamic temperature, K
k is the fluid's thermal conductivity, W/(m·K)
\( {S_{T}} \) represents the internal heat source of the fluid and the portion of mechanical energy converted to heat due to viscous effects.
Gas State Equation:
Pv=RT
Where:
P is the absolute pressure of the gas, Pa
v is the specific volume of the gas, m³/kg
R is the gas constant
2.2. Geometric Model
This study, based on field investigation data of a certain natural gas station and the layout and size of its equipment, used Creo Parametric software to establish a simplified 3D model of the station. The station is 270.73 meters long in the east-west direction and 407.97 meters long in the north-south direction, divided into two areas: the oil tank area and the separator area. Non-essential facilities and auxiliary equipment between devices were ignored in the model simplification. Two typical leakage points—an oil tank manhole at the tank top and a valve on the upper side of the separator tank—were selected for simulation. The grid model is shown in Figure 2.
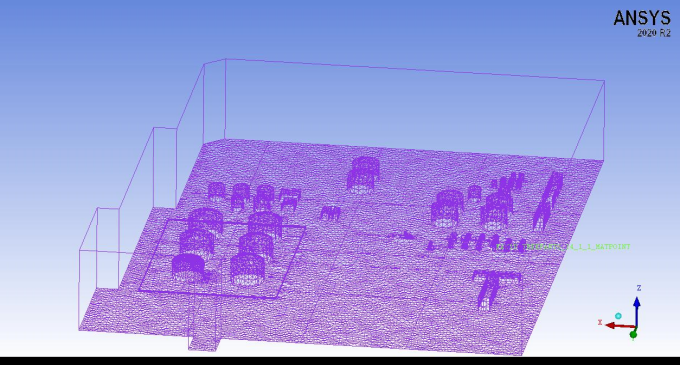
Figure 2: Grid Model of the Natural Gas Station
2.3. Numerical Model
ANSYS FLUENT 2022 was used for numerical simulation of the gas diffusion process following a natural gas leakage accident at the station. At the initial time, the fluid domain is filled with air, the methane concentration is 0, and the pressure is standard atmospheric pressure. The leakage point is set as a mass flow inlet, with the outlet in the fluid domain set as a pressure outlet. The wind inlet is set as a velocity inlet, while the other boundaries are wall boundaries. It is assumed that there is no heat exchange between the leaking gas and air, and the temperature is set to 300 K. During the natural gas leakage process, mass transfer occurs between different components. The Air-Methane mixture material transport model is used to calculate the gas leakage diffusion process.
To solve the velocity-pressure coupling problem in the Navier-Stokes (N-S) equations, the PISO algorithm is used. PISO is a method for solving control equations, which is particularly suitable for transient problems with large time steps, offering high accuracy and stability. To ensure computational stability and result accuracy, the pressure relaxation factor was set to 0.3, and second-order upwind discretization was used for spatial discretization. Based on the established numerical simulation method, the gas diffusion characteristics after a natural gas leakage at the station were studied.
3. Results and Analysis
Based on the station's monitoring data, the equipment pressure at the station is 0.2 MPa. According to the wind rose diagram, the predominant wind direction throughout the year is from the south, with the maximum wind speed recorded in 2023 as 12 m/s. The leakage scenarios for the pipelines were pre-set as small hole leaks and large hole leaks, with valve leakage determined based on the size of the valve.
3.1. Numerical Simulation of the Separator Area
3.1.1. Methane Distribution
The upper side valve of the separator tank No. 6 was selected as the leakage point. The wind speed was set at 0 m/s and 12 m/s, with the wind direction from the south and the leakage rate at 5.5 kg/s. The gas volume fraction contour map for this scenario is shown in Figure 3. When the wind speed is 0 m/s, the gas spreads more evenly around the leakage point, accumulating near the point of leakage. As the wind speed increases to 12 m/s, the space occupied by the high concentration of gas becomes smaller, primarily accumulating near the leakage point and in the space between the two separators. As the wind speed increases, the distribution space of the leaked gas decreases.
|
|
|
Wind Speed 0 m/s | Wind Speed 12 m/s |
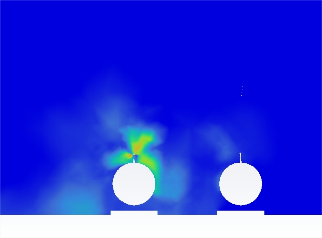
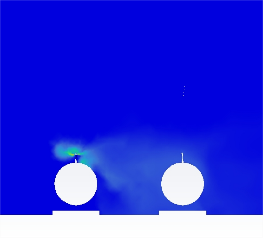

Figure 3: Gas Volume Fraction Contour Map at the Leakage Point of the Upper Valve of Separator Tank No. 6
The horizontal pipeline of separator No. 5 was selected as the leakage point. The wind speed was 12 m/s, with the wind direction from the south, and the leakage hole diameters were set at 20 mm (small hole leak) and 200 mm (large hole leak). The gas volume fraction contour map for this scenario is shown in Figure 4. Gas near the leakage point is not significantly affected by the wind direction and accumulates near the separator tank wall after leakage. When the hole diameter reaches 200 mm, the accumulation of gas becomes more noticeable, and the leaked gas continues to spread along the tank wall toward the downwind side, with significant accumulation between the two separators.
|
|
|
Hole Diameter 20 mm | Hole Diameter 200 mm |
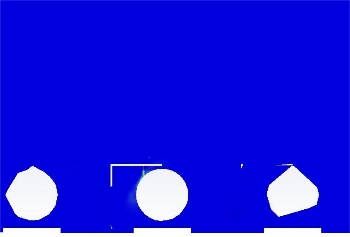
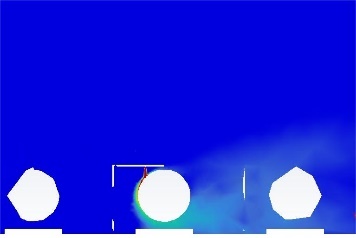

Figure 4: Gas Volume Fraction Contour Map at the Leakage Point of the Horizontal Pipeline of Separator No. 5
3.1.2. Hydrogen Sulfide Distribution
The upper side valve of separator tank No. 6 was selected as the leakage point, with the wind speed at 12 m/s and the wind direction from the south. The leakage hole diameter was 200 mm. The gas volume fraction contour map for this scenario is shown in Figure 5. After the gas leaks, it diffuses in all directions, with a significant effect from the wind direction. When the hole diameter reaches 200 mm, the concentration gradient and diffusion range near the leakage hole are more influenced by the wind speed.
|
|
|
Leakage Hole Diameter 20 mm | Leakage Hole Diameter 200 mm |
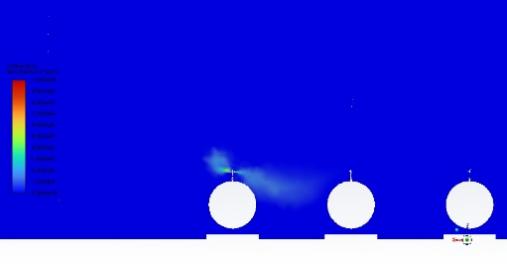
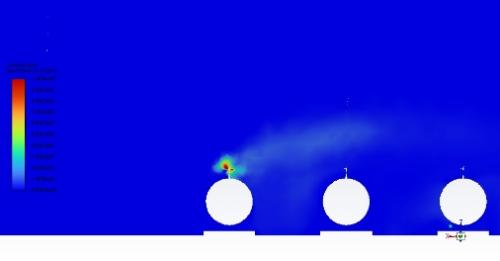

Figure 5: Cloud Diagram of Leakage Point of Valve on Upper Side of Separator Tank No. 6
3.2. Numerical Simulation of the Oil Tank Area
3.2.1. Methane Distribution
The top valve of oil tank No. 5 was selected as the leakage point. The wind speed was set at 0 m/s and 12 m/s, with the wind direction from the south and the leakage rate at 5.5 kg/s. The gas volume fraction contour map for this scenario is shown in Figure 6. After the gas leaks, it spreads evenly in all directions. The gas near the tank body shows noticeable accumulation. When the wind speed is increased to 12 m/s, the diffusion direction shifts toward the downwind side.
|
|
|
Wind Speed 0 m/s | Wind Speed 12 m/s |
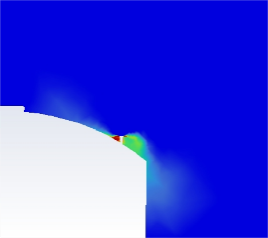
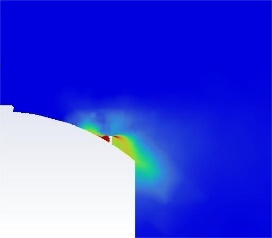
Figure 6: Gas Volume Fraction Contour Map at the Leakage Point of the Top Valve of Oil Tank No. 5
3.2.2. Hydrogen Sulfide Distribution
The top valve of oil tank No. 3 was selected as the leakage point. The wind speed was set at 0 m/s and 12 m/s, with the wind direction from the south and the leakage rate at 5.5 kg/s. The gas volume fraction contour map for this scenario is shown in Figure 7. After the gas leaks, it spreads in all directions, with noticeable accumulation on the side of the tank. When the wind speed is increased to 12 m/s, the gas no longer spreads upwards and the diffusion direction shifts toward the downwind side, accumulating near the tank wall.
|
|
|
Wind Speed 0 m/s | Wind Speed 12 m/s |
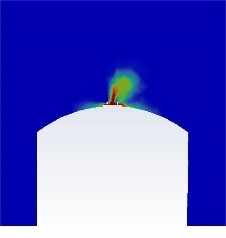
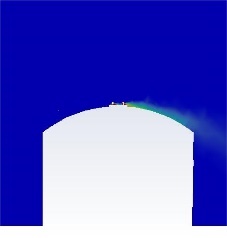

Figure 7: Gas Volume Fraction Contour Map at the Leakage Point of the Top Valve of Oil Tank No. 3
4. Optimization of Sensor Layout
Gas detectors play an important role in ensuring the safety of gas collection stations and preventing incidents such as fires and explosions. They can effectively detect small, medium, and severe leaks [8]. This chapter analyzes the existing sensor layout scheme of the gas collection station based on the results of previous leakage simulations, focusing on optimizing the sensor placement by evaluating the existing layout and its advantages and disadvantages.
4.1. Original Sensor Layout Scheme
The original sensor layout scheme for the station is shown in the figure below. According to the "Design Standard for Combustible and Toxic Gas Detection and Alarm in Petrochemical Industry" [9], the station is equipped with both combustible gas and toxic gas sensors, namely the Toxic Gas Sensor (TGS) and the Combustible Gas Sensor (CGS). The sensors in the separator area are mainly placed at both ends of the separators, while the sensors in the oil tank area are placed near the oil tanks.
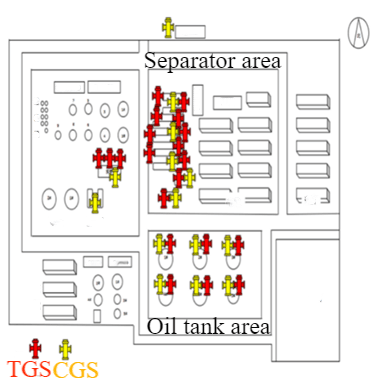
Figure 8: Original Sensor Layout Scheme for the Station
4.2. Optimized Sensor Layout Scheme
The basic principle for sensor layout is to ensure that the detection area covers the required detection range, with particular attention paid to the factors that could trigger hazardous accidents. Without changing the original sensor layout, the following optimized layout scheme is proposed based on the results of the gas leakage numerical simulation:
(1) The space between the two separators can be regarded as a semi-enclosed area, which is more prone to gas accumulation that could reach explosive limits or toxic concentrations. Therefore, a hydrogen sulfide sensor and a combustible gas sensor should be added between each pair of separators.
(2) There are potential leakage points at the top of the oil tanks that were not accounted for in the original sensor layout. To address this, a hydrogen sulfide sensor and a combustible gas sensor should be added to the top of each oil tank.
5. Conclusion
This study, based on Fluent simulation calculations, investigates the natural gas leakage and sensor optimization layout for a certain oilfield station, focusing on understanding the diffusion patterns of natural gas within the station to assess the risks posed by leaks. It also verifies the rationality of the original sensor layout and proposes an optimized design. The main findings and conclusions are as follows:
(1) Under the condition of an internal equipment pressure of 0.2 MPa and a southern wind, as the leakage hole diameter increases, the radius of the leakage impact also increases. As the wind speed increases, the area where the leaked gas accumulates shifts toward the downwind direction.
(2) Compared to open spaces, leaked gas is more likely to accumulate between the two separators or along the tank walls, reaching explosive or toxic concentrations more easily, thus presenting a higher risk.
(3) Without changing the original sensor layout, the sensor layout for the station was optimized by adding sensors between the two separators and at the top of the oil tanks.
References
[1]. Geldart D. Fluidization ngineering: By D. Kunii and O. Levenspiel, John Wiley and Sons, Ltd., New York,1969.534 pp.; 220 [J]. Elsevier, 1969, 3 (1).
[2]. Woodward John L, Mudan Krishna S. Liquid and gas discharge rates through holes in process vessels [J].Elsevier, 1991, 4(3): 161-165.
[3]. Helena Montiel, Juan. Vilchez, Joaquim Casal etc. Mathematical modeling of accidental gas elease [J], Journal of Hazardous Materials, 1998, 59(2.3) 211-233.
[4]. J.D. Young, B. J. Ahn. Analysis of hazard areas associated with high-pressure natural-gas pipelines[J], Journal of Prevention in the process industries 2002, 15(3): 179-198.
[5]. Chang W , Wang W , Guo Y ,et al. Diffusion characterization of hydrogen-blended natural gas leakage for buried pipeline based on simulation[J]. International Journal of Hydrogen Energy [2025-01-09]. DOI:10.1016/j. ijhydene. 2024.12.203.
[6]. Ouyang B, Sun D, Yu Y, et al.Simulation and Analysis of Leakage Characteristics in Hydrogen-Blended Natural Gas Pipelines [J].International Journal of Hydrogen Energy [2025-01-09]. DOI:10.1016/j. ijhydene. 2024.12.205.
[7]. Ye R, Xu S, Liu J, et al. Investigation and simulation of non-adaptive psychology of crowd evacuation under toxic gas leakage accident in chemical park[J]. Journal of loss prevention in the process industries, 2023:85.DOI:10.1016/j. jlp.2023.105160.
[8]. Qi Sun, Feng Li, Yiwei Wang, et al. The Leakage Diffusion Patterns of Hydrogen-Added Natural Gas in Pipelines and the Layout Scheme for Monitoring Probes. Oil and Gas Storage and Transportation, 2022, 41(08): 916-923.
[9]. Ministry of Housing and Urban-Rural Development of the People's Republic of China, State Administration for Market Regulation. Design Standard for Combustible and Toxic Gas Detection and Alarm in Petrochemical Industry. [S], 2019.
Cite this article
Cheng,W.;Cui,G. (2025). Numerical Simulation of Gas Leak Diffusion and Optimization of Sensor Layout in Gas Stations. Applied and Computational Engineering,130,232-239.
Data availability
The datasets used and/or analyzed during the current study will be available from the authors upon reasonable request.
Disclaimer/Publisher's Note
The statements, opinions and data contained in all publications are solely those of the individual author(s) and contributor(s) and not of EWA Publishing and/or the editor(s). EWA Publishing and/or the editor(s) disclaim responsibility for any injury to people or property resulting from any ideas, methods, instructions or products referred to in the content.
About volume
Volume title: Proceedings of the 5th International Conference on Materials Chemistry and Environmental Engineering
© 2024 by the author(s). Licensee EWA Publishing, Oxford, UK. This article is an open access article distributed under the terms and
conditions of the Creative Commons Attribution (CC BY) license. Authors who
publish this series agree to the following terms:
1. Authors retain copyright and grant the series right of first publication with the work simultaneously licensed under a Creative Commons
Attribution License that allows others to share the work with an acknowledgment of the work's authorship and initial publication in this
series.
2. Authors are able to enter into separate, additional contractual arrangements for the non-exclusive distribution of the series's published
version of the work (e.g., post it to an institutional repository or publish it in a book), with an acknowledgment of its initial
publication in this series.
3. Authors are permitted and encouraged to post their work online (e.g., in institutional repositories or on their website) prior to and
during the submission process, as it can lead to productive exchanges, as well as earlier and greater citation of published work (See
Open access policy for details).
References
[1]. Geldart D. Fluidization ngineering: By D. Kunii and O. Levenspiel, John Wiley and Sons, Ltd., New York,1969.534 pp.; 220 [J]. Elsevier, 1969, 3 (1).
[2]. Woodward John L, Mudan Krishna S. Liquid and gas discharge rates through holes in process vessels [J].Elsevier, 1991, 4(3): 161-165.
[3]. Helena Montiel, Juan. Vilchez, Joaquim Casal etc. Mathematical modeling of accidental gas elease [J], Journal of Hazardous Materials, 1998, 59(2.3) 211-233.
[4]. J.D. Young, B. J. Ahn. Analysis of hazard areas associated with high-pressure natural-gas pipelines[J], Journal of Prevention in the process industries 2002, 15(3): 179-198.
[5]. Chang W , Wang W , Guo Y ,et al. Diffusion characterization of hydrogen-blended natural gas leakage for buried pipeline based on simulation[J]. International Journal of Hydrogen Energy [2025-01-09]. DOI:10.1016/j. ijhydene. 2024.12.203.
[6]. Ouyang B, Sun D, Yu Y, et al.Simulation and Analysis of Leakage Characteristics in Hydrogen-Blended Natural Gas Pipelines [J].International Journal of Hydrogen Energy [2025-01-09]. DOI:10.1016/j. ijhydene. 2024.12.205.
[7]. Ye R, Xu S, Liu J, et al. Investigation and simulation of non-adaptive psychology of crowd evacuation under toxic gas leakage accident in chemical park[J]. Journal of loss prevention in the process industries, 2023:85.DOI:10.1016/j. jlp.2023.105160.
[8]. Qi Sun, Feng Li, Yiwei Wang, et al. The Leakage Diffusion Patterns of Hydrogen-Added Natural Gas in Pipelines and the Layout Scheme for Monitoring Probes. Oil and Gas Storage and Transportation, 2022, 41(08): 916-923.
[9]. Ministry of Housing and Urban-Rural Development of the People's Republic of China, State Administration for Market Regulation. Design Standard for Combustible and Toxic Gas Detection and Alarm in Petrochemical Industry. [S], 2019.