


1. Introduction
The stock market plays a critical role in the economic system, occupying a position of great importance. Stock price prediction has been always paid huge attention to by the public, due to the considerable volatility of the stock market, stock investment can bring high profit opportunities to investors, but meanwhile, it comes with high risks. As a result, with the constant progress of artificial intelligence technology, predicting stock prices more accurately and effectively is of great importance.
Regarding sentiment analysis on stock prices and news, there have been many studies carried out by domestic and foreign experts. Yu et al. constructed a Support Vector Machine (SVM) text sentiment classifier, conducted sentiment analysis on financial text data of individual stocks, took the Long Short-Term Memory (LSTM) network as the core prediction model, extracted different feature dimensions of the SSE 50 index, made short-term prediction, and added market sentiment characteristics. Compared with traditional methods, it improves the accuracy and precision of out-of-sample prediction results of the LSTM model and provides research ideas and reference directions for studying the internal relationship between investor sentiment and the stock market [1]. Zhang used the SVM classifier to capture the nonlinear relationship in the stock return series and made a breakthrough in the study of financial series [2]. Frank also wrote about the extent to which the stock market is affected by positive and negative news and pointed out that the news conference caused excessive reactions to investors such as retail investors and liquidity traders, making them overreact to good news and underreact to bad news [3]. Bansal et al. applied several machine learning methods, including K-Nearest Neighbour (KNN) and Decision Tree Regression (DTR), to perform stock price prediction using the 7-year data set of 12 leading companies in the Indian stock market. Finally, by comparing Root Mean Square Error (RMSE), it is found that LSTM provides the best result, with higher accuracy and better performance [4]. Sonkiya et al., from the impact of the headlines on the stock market and cryptocurrencies in recent years, proposed an S-GAN model that is advanced in models such as Gated Recurrent Unit (GRU), LSTM, and ARIMA [5]. Henrique et al. used the SVM model to predict minute-level stock prices and build a stock price prediction model [6]. Convolutional neural networks used for image data analysis can also be applied to stock price prediction [7]. Almasarweh et al. built an ARIMA model to predict the stock market prices of banks. The experimental results show that the ARIMA model has significant results in short-term prediction and can help investors make decisions to some extent [8]. Nguyen et al. also made stock predictions by analyzing sentiment tags on Yahoo message boards through Latent Dirichlet Allocation (LDA), and they finally showed that sentiment tags can improve prediction performance [9]. It can be seen that for stock sequence feature extraction and prediction, machine learning classifiers or deep learning neural networks are basically used. As Kumbure et al pointed out, in recent financial research literature, deep learning methods and text data are increasingly used [10].
Based on the natural language processing model, this paper constructs a way to predict the rise and fall of stock prices through sentiment analysis of news headlines. In addition, Random Forest (RF) and Logistic Regression (LR) were used to test and predict text data together with two different text feature extraction methods CountVectorizer and Term Frequency-Inverse Document Frequency (TF-IDF) respectively. Finally, three models with the best results were selected and combined for comparative analysis by generating classification reports and evaluating the accuracy, recall rate, and f1-score. Then compare the advantages and disadvantages of each combination.
2. Data and Method
2.1. Data Collection and Description
This paper uses a combined data set of world news and stock prices covering all fields to predict the rise and fall of stock prices, the dataset includes 4102 rows of specific dates and 27 columns, with 25 columns each corresponding to the 25 top stories of the day, in addition to the date column and the tag column. The data range covers headlines from 2000 to 2016, while the tags are based on the Dow Jones Industrial Average, with a label of 1 indicating a rise in stock prices and a label of 0 indicating a fall or flat price. The Dow Jones Industrial Average (DJIA) is made up of 30 representative blue-chip stocks weighted by price and is one of the most well-known and oldest stock market indexes in the United States, which reflects the overall performance of the U.S. stock market as well as the health of the economy.
2.2. Data Processing Methods
In this experiment, two kinds of word bag models are used to extract text features and convert text data into digital or vector representation that computers can understand and process, so as to realize the analysis and mining of text data. Among them, CountVectorizer is a commonly used text feature extraction method, which belongs to a common feature numerical calculation class, which only considers the frequency of words appearing in the text, and belongs to the feature of the bag of words model. The CountVectorizer converts the words in the text into a word frequency matrix, which counts the number of occurrences of each word using the fit transform function. CountVectorizer is divided into three processing steps: preprocessing, tokenizing, and n-grams generation. The parameters set in the text are n-gram= [2,2], which sets two words as one unit.
TF-IDF is a text weighting method. It is a commonly used weighting technique for information retrieval and text mining to assess the importance of a word to a document in a corpus or a corpus. The main idea is that if a word or phrase appears frequently in one article and rarely in other articles, it is considered that this word or phrase has a good classification ability and is suitable for classification. TF-IDF has a good effect and is easy to implement when dealing with large-scale text. It can effectively extract the key information in the text and avoid the interference of common words.
Term Frequency (TF) Measures the frequency of occurrence of a word in a file. It can be expressed as the total number of occurrences of a word divided by the total number of words in the document. IDF refers to the inverse file frequency and is used to measure the importance of a word. TF-IDF not only considers the frequency of occurrence of a word in the training text but also the reciprocal number of other training texts for that word.
2.3. Experimental Model
Two classification models, RF and LR, are used in this paper.
RF, as a newly emerging and highly flexible machine learning algorithm, has a wide range of applications and can provide an important score for each feature. In text data, these features are usually words or phrases (like words or n-grams) generated by CountVectorizer or other text vectorizer tools. By extracting the feature importance scores of the random forest model, we can understand which words contribute the most to the prediction results.
LR is a classical statistical model, which is mainly used to solve binary or multi-classification problems. The core idea is to generate a value through a linear function, and then map this value to the interval of (0,1) through a logical function to get a probability value. This probability value can be understood as the probability of the positive class (stock price rise). Then the threshold (0.5) is set through the decision boundary to convert the probability value into the final classification result. In this experiment, the value with a probability greater than or equal to 50% is judged as a positive class, that is, the predicted result is the stock price rise; Conversely, values with a probability of less than 50 percent are considered negative, and the forecast result is that the stock price will remain unchanged or fall.
3. Experimental Analysis
3.1. Experimental Procedure
In this paper, the data is first read and then preprocessed, using the drop () function in the Pandas library to check whether the imported data is always valid, deletes the row or column containing the missing value (NaN) and cleans the data to make the whole data more orderly. After that, the data set is divided according to time, and the data within 14 years before December 31, 2014, is classified as the training set, and the data after January 1, 2015, is set as the test set. Punctuation information is not required for text sentiment analysis. Therefore, this paper uses Regular Expression to delete punctuation marks such as double quotation marks and periods and keep only text information. Second, because the bag of words model will be distinguished into different words due to the different cases of the word, it is necessary to unify the case of the character to avoid any errors.
All header data is then merged and a visual word cloud is generated. Combine the 25 headings for each row into a single string and put it in the headline list, with each string representing all the header content for the row. To use the subsequent model, go through each date and combine the top 25 news of each day into a single paragraph. You can see the most frequent words in Figure 1 word cloud.
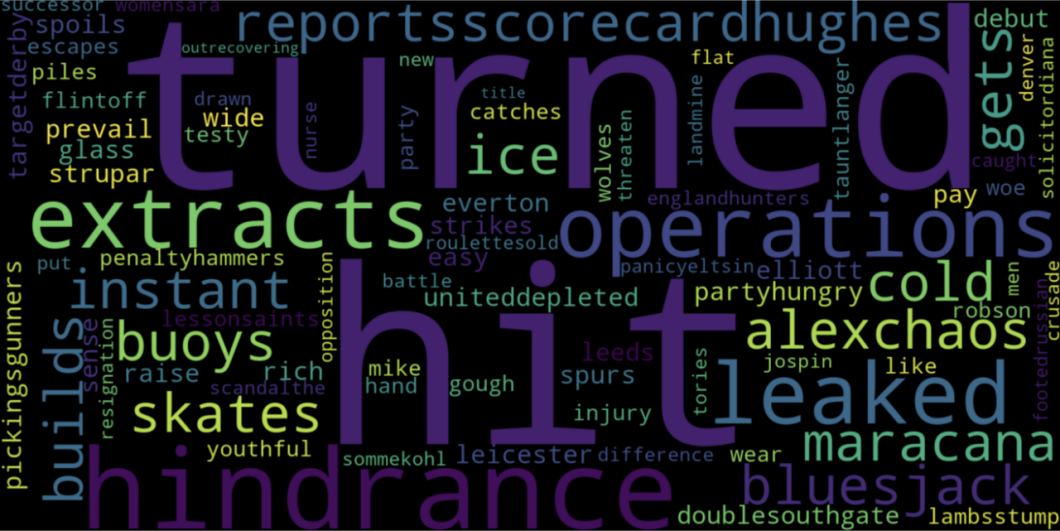
Figure 1: Word cloud. (Picture credit: Original).
After all this preprocessing, use CountVectorizer for text feature extraction.
First, this paper uses CountVectorizer to transform headlines into a word bag model, extract 2-gram phrase features, and then store the feature matrix in the training dataset, which is a sparse matrix containing a large number of '0' and '1'.
As a simple and powerful text feature extraction tool, the text values are converted into numerical form and then processed with machine learning algorithms. The parameter n-gram= (2,2) is set here, that is, each unit is a combination of two words. Then RF is initialized, the number of decision trees is set to 200, the splitting criterion is entropy, and the model is trained using training data and the Label train['Label'].
3.2. Experimental Results
The overall performance of the model is summarized by generating the confusion matrix, accuracy report and classification report through the code.
Firstly, precision is equal to the number of true positives divided by the sum of true positives and false positives. The higher the precision, the more samples the model predicts as positive cases are true positives.
Secondly, recall refers to the number of true positives as a percentage of the total number of predictions. A higher recall indicates that the model has identified more true proportions.
The F1 score is the reconciled average of precision and recall. A higher F1 score indicates that the model strikes a better balance between precision and recall.
The experimental results of CountVectorizer+RF are shown in Table 1.
Table 1: CountVectorizer+RF classification report
precision | recall | f1-score | accuracy | |
0 | 0.98 | 0.70 | 0.82 | 0.85 |
1 | 0.77 | 0.98 | 0.87 |
The first approach is to extract text features using CountVectorizer, converted to bag-of-words modes, and generate features by counting word or phrase frequency (bigram), which is the number of occurrences of a word or phrase in bigram text without weight assignment. The RF integration method was chosen for the classifier. Multiple decision trees are constructed and the final classification is decided by voting or averaging, using entropy as a splitting criterion (criterion='entropy').
Bag-of-words model is simple, effective and suitable for benchmark implementations of text categorization, RF is sensitive to feature importance and can handle high-dimensional sparse feature space such as bag-of-words model, but it has no weighting for high-frequency words.
The analysis in Table 1 leads to the conclusion that after the process of combined use of CountVectorizer and RF, the model performs well in the rising (1) category (high recall, meaning that most of the rises are correctly predicted). However, on predicting the down (0) category, the recall is low (0.70), implying that a certain number of downs are incorrectly predicted as ups. The overall accuracy of 0.85 is a fair performance, but there is still room for improvement in the prediction of the down category.
The next method is using TF-IDF instead of CountVectorizer for text feature extraction with RF again, the experimental results are shown in Table 2.
Table 2: TF-IDF+RF classification report.
precision | recall | f1-score | accuracy | |
0 | 0.90 | 0.84 | 0.87 | 0.88 |
1 | 0.86 | 0.91 | 0.88 |
The second method, which replaces CountVectorizer with TF-IDF, is usually more accurate than CountVectorizer in text processing because it reduces the interference of high-frequency common words in classification, and is also suitable for dealing with nonlinear feature relationships when combined with RF.
As can be seen from Table 2, the performance of RF improves after weighting with TF-IDF features. The recalls of the down (0) and up (1) categories are closer and both increase to 0.84 and 0.91, and the overall accuracy improves to 0.88, indicating that the TF-IDF is more effective in capturing the importance of the words and enhances the model's generalization ability. This model's performance on the two categories is also more balanced.
Then TF-IDF is used again for feature extraction, assigning weights to each word on the basis of the bag of words to reduce the influence of common words. And this time using LR, the performance of the model is briefly evaluated after predicting the test set and the results are shown in Table 3.
Table 3: TF-IDF+LR classification report
precision | recall | f1-score | accuracy | |
0 | 1.00 | 0.71 | 0.83 | 0.85 |
1 | 0.78 | 1.00 | 0.88 |
The third method also uses TF-IDF, which measures the importance of words by combining word frequency and inverse document frequency and focuses more on weight adjustment than CountVectorizer, which does not take into account the word importance gap, which may result in some unimportant words occupying higher weights. Coupled with LR's more effective processing of the text, the recall is improved while the f1-score is equal to the first method's.
According to the content of Table 4, it can be seen that although the recall of the falling (0) category is only 0.71, the recall of the rising category reaches the highest 1.00, which has a higher recall compared to the earliest used method, but the f1-score presented in the classification model is only 0.85; on the contrary, the RF classifier has a higher f1-score when combined with TF-IDF feature extraction.
4. Conclusions
A comprehensive comparison of the experimental results shows that when CountVectorizer and RF are used in combination, the final accuracy and f1-score stay at the lowest score due to the lack of weights above the word frequency counting; on the contrary, the use of the TF-IDF, which takes into account the global importance of the word, allows the RF to capture the classification of the sub-linear relationship very well with a better computing efficiency and results, and this combination also shows its suitability for higher precision text categorization tasks. The last method using the combination of TF-IDF and LR also achieves good results. LR, which has significant efficiency in binary classification problems, obtains better recall on the label of falling stock prices, but the f1-score is not as good as the second method in terms of overall model efficiency considerations. To summarize, using TF-IDF to extract features and RF to predict stock prices is a good choice for studying the impact of news headline text on stock prices.
Authors Contribution
All the authors contributed equally and their names were listed in alphabetical order.
References
[1]. Yu, XJ., Liu, GP., Liu, JL., & Xiao, WL. (2024). Stock index prediction based on LSTM network and text sentiment analysis. China Management Science, 32(8), 25-35.
[2]. Wang, Y., & Guo, Y. K. (2019). Improved XGBoost model for stock prediction, 2019, 55 (20):202-207.
[3]. Frank, M. Z., & Sanati, A. (2018). How does the stock market absorb shocks?. Journal of Financial Economics, 129(1), 136-153.
[4]. Bansal, M., Goyal, A., & Choudhary, A. (2022). Stock market prediction with high accuracy using machine learning techniques. Procedia Computer Science, 215, 247-265.
[5]. Sonkiya, P., Bajpai, V., & Bansal, A. (2021). Stock price prediction using BERT and GAN. arXiv preprint arXiv:2107.09055.
[6]. Henrique, B. M., Sobreiro, V. A., & Kimura, H. (2018). Stock price prediction using support vector regression on daily and up to the minute prices. The Journal of finance and data science, 4(3), 183-201.
[7]. Mehtab, S., & Sen, J. (2020). Stock price prediction using convolutional neural networks on a multivariate timeseries. arXiv preprint arXiv:2001.09769.
[8]. Almasarweh, M., & Alwadi, S. (2018). ARIMA model in predicting banking stock market data. Modern Applied Science, 12(11), 309.
[9]. Nguyen, T. H., Shirai, K., & Velcin, J. (2015). Sentiment analysis on social media for stock movement prediction. Expert Systems with Applications, 42(24), 9603-9611.
[10]. Kumbure, M. M., Lohrmann, C., Luukka, P., & Porras, J. (2022). Machine learning techniques and data for stock market forecasting: A literature review. Expert Systems with Applications, 197, 116659.
Cite this article
Meng,F.;Yeerlan,A.;Zhang,Z. (2025). Sentiment Analysis of News Headlines and Stock Price Prediction. Applied and Computational Engineering,135,245-250.
Data availability
The datasets used and/or analyzed during the current study will be available from the authors upon reasonable request.
Disclaimer/Publisher's Note
The statements, opinions and data contained in all publications are solely those of the individual author(s) and contributor(s) and not of EWA Publishing and/or the editor(s). EWA Publishing and/or the editor(s) disclaim responsibility for any injury to people or property resulting from any ideas, methods, instructions or products referred to in the content.
About volume
Volume title: Proceedings of the 3rd International Conference on Mechatronics and Smart Systems
© 2024 by the author(s). Licensee EWA Publishing, Oxford, UK. This article is an open access article distributed under the terms and
conditions of the Creative Commons Attribution (CC BY) license. Authors who
publish this series agree to the following terms:
1. Authors retain copyright and grant the series right of first publication with the work simultaneously licensed under a Creative Commons
Attribution License that allows others to share the work with an acknowledgment of the work's authorship and initial publication in this
series.
2. Authors are able to enter into separate, additional contractual arrangements for the non-exclusive distribution of the series's published
version of the work (e.g., post it to an institutional repository or publish it in a book), with an acknowledgment of its initial
publication in this series.
3. Authors are permitted and encouraged to post their work online (e.g., in institutional repositories or on their website) prior to and
during the submission process, as it can lead to productive exchanges, as well as earlier and greater citation of published work (See
Open access policy for details).
References
[1]. Yu, XJ., Liu, GP., Liu, JL., & Xiao, WL. (2024). Stock index prediction based on LSTM network and text sentiment analysis. China Management Science, 32(8), 25-35.
[2]. Wang, Y., & Guo, Y. K. (2019). Improved XGBoost model for stock prediction, 2019, 55 (20):202-207.
[3]. Frank, M. Z., & Sanati, A. (2018). How does the stock market absorb shocks?. Journal of Financial Economics, 129(1), 136-153.
[4]. Bansal, M., Goyal, A., & Choudhary, A. (2022). Stock market prediction with high accuracy using machine learning techniques. Procedia Computer Science, 215, 247-265.
[5]. Sonkiya, P., Bajpai, V., & Bansal, A. (2021). Stock price prediction using BERT and GAN. arXiv preprint arXiv:2107.09055.
[6]. Henrique, B. M., Sobreiro, V. A., & Kimura, H. (2018). Stock price prediction using support vector regression on daily and up to the minute prices. The Journal of finance and data science, 4(3), 183-201.
[7]. Mehtab, S., & Sen, J. (2020). Stock price prediction using convolutional neural networks on a multivariate timeseries. arXiv preprint arXiv:2001.09769.
[8]. Almasarweh, M., & Alwadi, S. (2018). ARIMA model in predicting banking stock market data. Modern Applied Science, 12(11), 309.
[9]. Nguyen, T. H., Shirai, K., & Velcin, J. (2015). Sentiment analysis on social media for stock movement prediction. Expert Systems with Applications, 42(24), 9603-9611.
[10]. Kumbure, M. M., Lohrmann, C., Luukka, P., & Porras, J. (2022). Machine learning techniques and data for stock market forecasting: A literature review. Expert Systems with Applications, 197, 116659.