


1. Introduction
As a major employer and source of income for both local and national governments, the hospitality sector is a vital component of the worldwide economy [1,2]. The importance of the travel and tourism industry is highlighted by the World Travel & Tourism Council (WTTC), which states that in 2019 it contributed 10.4% of the world GDP [3]. Nonetheless, the COVID-19 epidemic has brought attention to this industry's weaknesses, as seen by the sharp decline in hotel occupancy rates and the sharp increase in cancellation rates [4]. It is more important than ever to comprehend the elements driving hotel booking cancellations in this particular environment.
Hotel cancellations create many difficulties for hotel management, leading to loss of profit. It forces hotels to change their management practices. Studies have shown that booking cancellations are dependent on many factors, such as third-party booking sites. Effective management of booking cancellations can dramatically improve a hotel's operational efficiency and profitability [5].
Several studies have looked at the variables that influence hotel booking cancellations, with a primary focus on external factors such as pricing tactics, promotional offers, and consumer demographics. For example, researchers found that customer unhappiness considerably boosts cancellation rates when they looked at the relationship between customer satisfaction and service quality [6]. Likewise, others examined the impact of online hotel ratings on hotel booking considerations and noted that poor reviews have been trustworthy [7]. Though these studies offer insightful information, they usually create single prediction models that frequently isolate outside effects without taking into account the interaction of several inputs.
To bridge the research gap, this paper presents an exploration of three distinct classification models, specifically Logistic Regression, Decision Tree, and Random Forest, for the purpose of forecasting the likelihood of hotel reservation cancellations by travelers. The evaluation of model performance will be based on five performance indicators derived from the confusion matrix, encompassing accuracy, precision, recall, specificity, and the F1 score. Notably, the F1 score, renowned for its comprehensive evaluative capacity, emerges as the ultimate performance metric for this comparative model.
2. Literature Review
There are many external factors for hotel booking cancellation and many scholars have done research on it. Hotel price and incentives are important factors, which is an important factor for customer needs [6]. If the customers find out more favorable hotels and channels they will choose to cancel the booking.
Another important factor is the platform and channel of booking. Nowadays more and more customers tend to book online and often online platform bookings support free cancellation. The result shows that online bookings have higher cancellation rate [8]. Therefore hotels should improve customer satisfaction and loyalty to reduce booking cancellation rate.
Demographic trends can also influence hotel booking cancellation behavior. Young people are more likely to travel and tour compared to other age groups. However, previous study shows that they also present a higher probability of booking cancellation [9]. This is due to the fact that young people usually book through online platforms and the fact that young people are more flexible in their travel plans and can easily change their hotel reservations. This demographic trend makes it difficult for hotels to reduce hotel booking cancellation behavior through appropriate strategies, and they can only focus on improving their service level and quality.
The research of the above scholars reveals the factors of hotel reservation cancellation to a certain extent, but it is still somewhat one-sided. Most of them only consider a single certain factor and lack a comprehensive and integrated consideration. For example, previous study considered the effects of price and population on booking cancellations, but did not analyze the results of the interaction of these factors [10]. Such studies may be more one-sided and less persuasive.
In addition, the literatures at this stage do not analyze the importance of the factors, so it is difficult to develop some targeted strategies. Although they have analyzed key factors such as online reviews, the hotel has not developed detailed solutions.
Finally, most of the research focuses on the external factors of hotel booking cancellation and rarely mentions the internal factors, such as the deposit time. It is possible that a large portion of booking cancellation behavior is due to internal factors and many researchers have ignored it. Therefore the next research should abandon the single model and consider the effects of internal and external factors and their interactions on customers' booking cancellation behavior in an integrated way.
3. Methodology
This study aims to build predictive models using common information about passengers, so making the selection of independent variables of universal customer data is crucial. Online booking platforms like Booking.com, TripAdvisor, and Agoda provide rich repositories of passenger booking details, demographics, preferences, and unique requests, which are included in the dataset for this study. The dependent variable is the likelihood of reservation cancellations. It is a qualitative measure that necessitates classification models for analysis. This research will employ three classification models: Logistic Regression, Decision Tree, and Random Forest. Logistic Regression is ideal for binary classification problems. And tree-based models excel at predicting cancellations [11]. Thus, Decision Tree and more complex Random Forest models are chosen for this study.
3.1. Logistic Regression
The core idea of logistic regression is to use the Sigmoid function to map the output of linear regression between 0 and 1 to obtain a probabilistic prediction. The expression of Sigmoid function is:
\( \begin{array}{c} g(z)=\frac{1}{1+{e^{-z}}} \\ \end{array} \) (1)
Let \( z={β_{0}}+{β_{1}}{X_{1}}+…+{β_{P}}{X_{p}}. \) Each feature attribute \( {X_{p}} \) is given a weight \( {β_{p}} \) , which represents the contribution of the feature attribute to the prediction result. \( z \) reflects the tendency of samples to become positive classes under the current parameters of the model. Call the Sigmoid function to map z between 0 and 1 to represent the probability:
\( p(X)= \frac{1}{1+{e^{-(}}{β_{0}}+{β_{1}}{X_{1}}+…+{β_{P}}{X_{p}})} \) (2)
Odds is the ratio of the probability of an event occurring to the probability of not occurring, the formula is:
\( Odds=\frac{p(X)}{1-p(X)} \) (3)
Take the logarithm of Odds to get the log-odds, and substitute the \( p(X) \) function into:
\( Log{(\frac{p(X)}{1-p(X)})}={β_{0}}+{β_{1}}{X_{1}}+…+{β_{p}}{X_{p}} \) (4)
The log-odds represents the logarithmic relationship between the likelihood of an observation belonging to the category defined as 1 and the likelihood of it belonging to the category defined as 0 [11]. The parameters \( ({β_{0}},{β_{1}}…{β_{p}}) \) are typically estimated using the maximum likelihood method [11].
3.2. Decision Tree
The core idea of a decision tree is to segment the dataset according to the features in the dataset to achieve a tree-like structure. The decision tree seeks the feature that most effectively separates the classes and then splits the data based on the values of this feature [12]. The Gini coefficient is used to assess how well a specific feature works when segmenting the data. The formula for calculating the Gini index is
\( Gini=\sum _{k=1}^{K}{\hat{p}_{nk}}(1-{\hat{p}_{nk}}) \) (5)
where \( {\hat{p}_{nk}} \) symbolizes the percentage of observations in node n that are part of class k. This cycle will end when the stop condition is met. (e.g., the Gini coefficient in the training set is less than a predetermined threshold). To prevent overfitting, the decision tree needs to be pruned. There are two pruning methods, including pre-pruning and post-pruning.
3.3. Random Forest
Random Forests algorithm consists of a collection of decision trees used for classification [13]. This is accomplished by creating decision trees that make a sequence of decisions to arrive at a conclusion and the process is repeated multiple times with other trees until the prediction error rate is minimized [14]. The stochastic nature of a random forest is derived from two distinct components: bootstrap sampling and the random assortment of a subset of features. Initially, the random forest engages in random, replacement-allowed sampling from the original training dataset. Subsequently, each tree within the forest selects a random subset from the feature set to serve as candidate features. Each tree then yields a classification, and the category with the highest frequency is chosen as the ultimate outcome.
4. Data
4.1. Data Analysis
The data is originally from the article Hotel Booking Demand Datasets, written by Nuno Antonio, Ana Almeida, and Luis Nunes for Data in Brief, Volume 22, February 2019. This dataset collects 119390 data on hotel bookings for city hotels and resort hotels, with a total of 36 features, including whether travelers cancel their reservations, how many days in advance they booked, etc.
In the study conducted, a correlation matrix is established to examine the relationships between the specified variables. As shown in Figure 1, this matrix highlights that all values on the diagonal are 1, signifying that a variable always has a perfect correlation with itself. The color red is designated as an indicator of a positive correlation, while blue is utilized to signify a negative relationship. Furthermore, the intensity of the color is indicative of the strength of the correlation. Therefore, it is important to emphasize the relationship between the variables 'lead_time' and 'is_canceled', as they demonstrate a stronger positive correlation in comparison to all other variables.
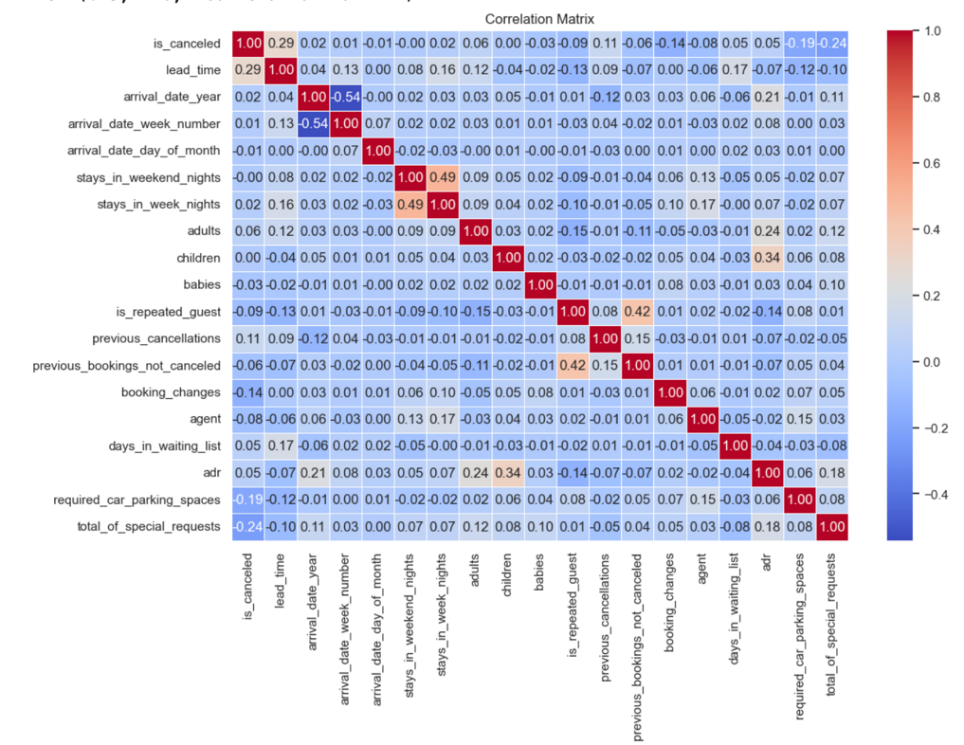
Figure 1: Correlation Matrix
Nevertheless, other three variables are chosen to help build the model later. The three pie charts in Figure 2, Figure 3 and Figure 4 suggest clearly that PRT, transient, No deposit each contains the largest part of the distribution.
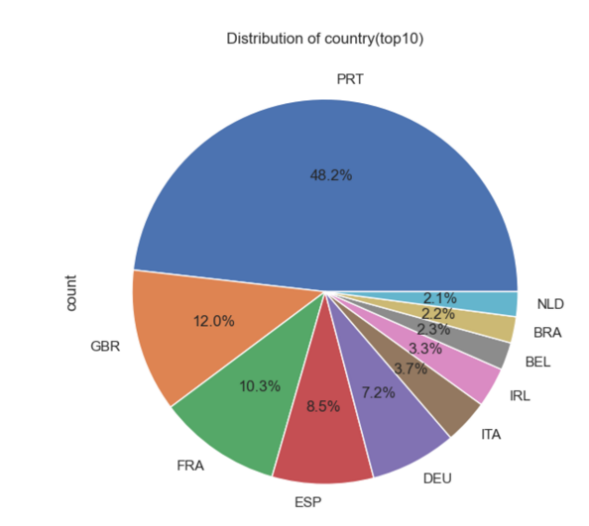
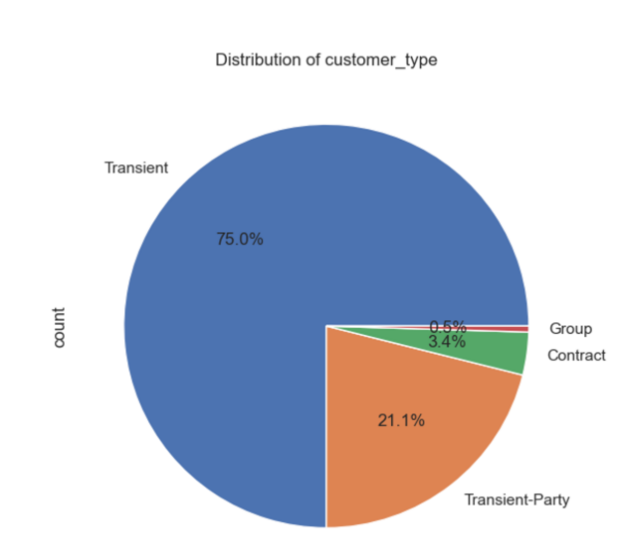
Figure 2: Distribution of country Figure 3: Distribution of customer type
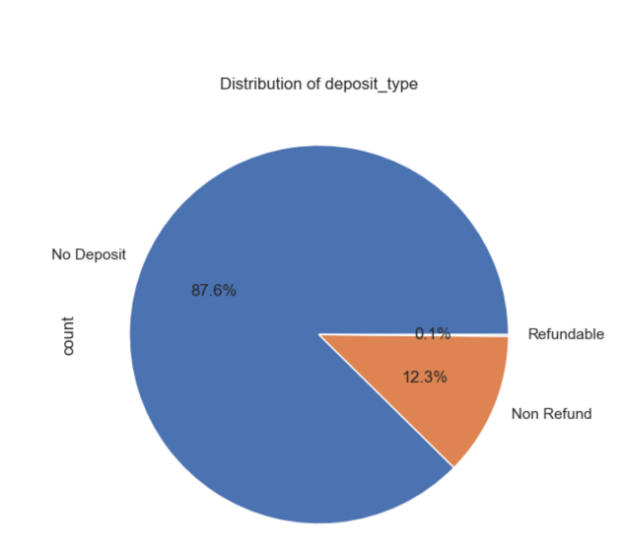
Figure 4: Distribution of deposit type
4.2. Data preprocessing
4.2.1. Processing of missing value
Firstly, the identification and subsequent handling of missing data are undertaken. Given that the 'company' feature exhibits a high percentage of missing values, accounting for 94.3%, it is deemed appropriate to omit this feature. Conversely, the 'agent' feature, which potentially has a significant impact on the results, displays a relatively low proportion of missing values. Thus, the missing values of this feature are deemed more suitable for imputation rather than deletion. Upon examining the distribution of 'agent' data, a notable skewness is observed. To safeguard the data from the impact of extreme values, the method of median imputation is employed, as it offers robustness. The median value more accurately reflects the central tendency of 'agent' data. The 'children' feature has a mere 4 missing values, which constitutes 0.03‰ of the total. Therefore, observations with missing 'children' data are deleted, while those with 'children' data are retained. The 'Country' feature also has a small number of missing values, and the same procedure is implemented as with the 'children' feature.
4.2.2. Data conversion
To enhance the precision of the model and the efficiency of data processing, as well as to streamline subsequent operations such as feature engineering, categorical features have been converted into a numerical format. The study of 'Reservation_status_date' is deemed to have negligible significance, thus leading to the removal of this feature.
4.2.3. Outlier check and visualization
Figure 5 represents the data visualization process utilizing a boxplot. As depicted in Figure 5, anomalous values that deviate from the overall 'adr' are detected. Given the presence of a solitary outlier and considering the possibility of it being a statistical anomaly, data with 'adr' features exceeding 5000 have been eliminated.
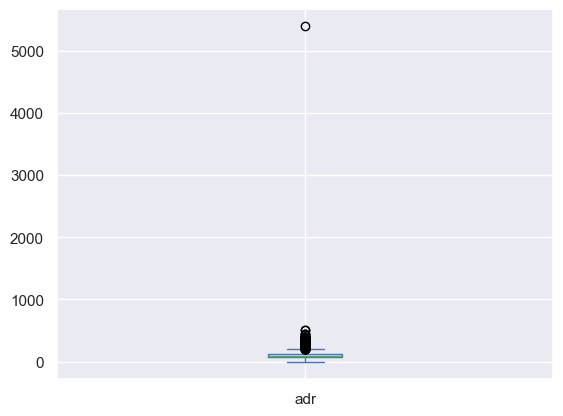
Figure 5: The boxplot of adr
4.3. Feature engineering
Referring back to Figure 1, a visual inspection reveals a weak correlation between the features of children, babies, and adults with the 'is_canceled' feature. Broadly speaking, babies can be categorized under children. Consequently, these three features have been amalgamated into a new feature termed 'numbered_customer'. In addition to the aforementioned integration, due to the low correlation between 'stay_in_weekend_nights', 'stay_in_weekend_nights', and 'is_canceled', these features have also been consolidated into a new feature named 'days', representing the total duration of hotel stays.
To ascertain the presence of multicollinearity among the independent variables, a Variance Inflation Factor (VIF) test is employed. The computation of VIF is grounded in the principle of variance decomposition in linear regression models, serving as a gauge for the severity of multicollinearity. Table 1 indicates that the VIF values of six independent variables, including 'arrival_date_year', 'arrival_date_week_number', 'market_segment', 'distribution_channel', 'customer-type', and 'numb_custom', exceed 10. The statistical content of the independent variables 'market_segment' and 'distribution_channel' is strikingly analogous, and the classification of 'customer-type' in the dataset lacks sufficient clarity. Based on the assessment of research significance, the four features of 'market_segment', 'arrival_date_year', 'customer-type', and 'arrival_date_week_number' are ultimately eliminated.
Table 1: The VIF of Features
• Feature | • VIF |
• hotel • is_canceled • lead_time • arrival_date_month • arrival_date_day_of_month • meal • distribution_channel • is_repeated_guest • previous_cancellations • previous_bookings_not_canceled • reserved_room_type • assigned_room_type • booking_changes • deposit_type • agent • days_in_waiting_list • adr • required_car_parking_spaces • total_of_special_requests • month • days • number_customer | • 3.715087 • 2.320862 • 2.644729 • 3.407495 • 3.818052 • 1.366215 • 8.906649 • 1.296563 • 1.072212 • 1.264552 • 4.663689 • 4.933069 • 1.171200 • 1.764481 • 3.610325 • 1.062337 • 7.494264 • 1.185602 • 1.791368 • 4.559853 • 3.308563 • 9.906998 |
Aimed at focusing the model's attention on the most important features and make it easy to interpret, the feature filtering step is performed by the SelectKBest class in scikit-learn, which extracts the top ten features with the highest scores. The method used is the F-test classification method suitable for classification problems: f_classicf. Table 2 shows the top ten features with the highest scores, while the Figure 6 illustrates the importance of each feature. Based on them (Table 2 and Figure 6), the four factors of arrival_date_month, arrival_date_day_of_month, days, and meal among the 21 data points are not important for predicting whether hotel guests will cancel their reservations, so they are eliminated.
Table 2: Score for the top 10 features ranked
• Feature | • Feature Score |
• deposit_type • lead_time • total_of_special_requests • required_car_parking_spaces • assigned_room_type • distribution_channel • booking_changes • hotel • previous_cancellations • is_repeated_guest | • 33432.67 • 11082.71 • 6989.76 • 4689.40 • 3794.99 • 3349.74 • 2541.73 • 2172.52 • 1454.21 • 868.92 |
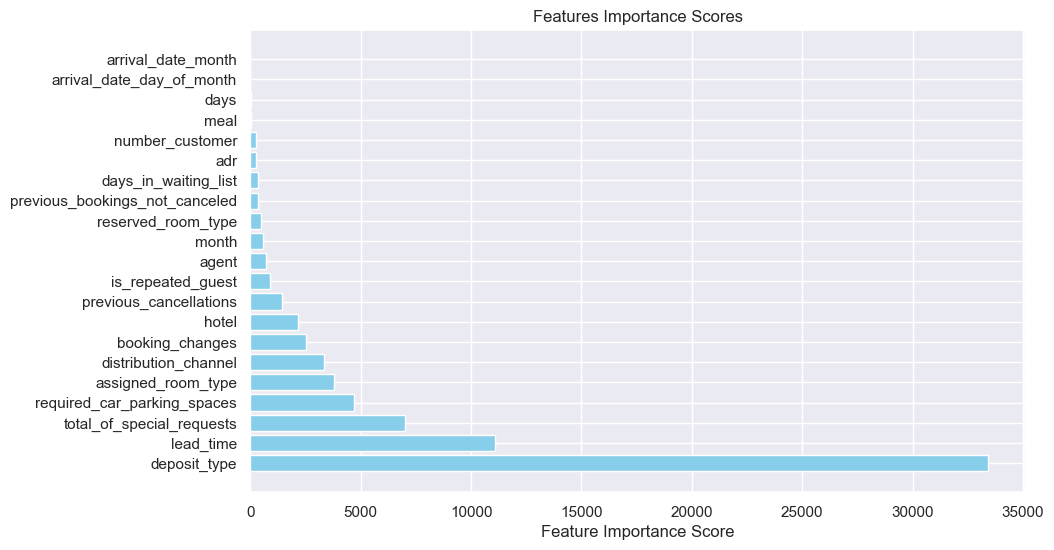
Figure 6: Feature importance score
5. Model Fitting
5.1. Experiment Setting
5.1.1. Dataset partitioning
The input dataset will be randomly divided into a training set and a test set at a 6:4 scale, because the experiment does not involve time series analysis, and 6:4 has been proven to be reliable in a variety of application scenarios.
5.1.2. Algorithm selection
There are three algorithm for decision trees, which are ID3, C4.5, and CART [15]. CART, a commonly utilized decision tree algorithm, is appropriate for predictive tasks using numerical data as well as classification tasks involving categorical data [15]. In this experiment, the CART algorithm will be used.
5.1.3. Confusion matrix
The confusion matrix provides a valuable and thorough display of the classifier's performance, presenting the binary classifier's results in a two-by-two table and illustrating the percentages of four potential classification outcomes: True Positive (TP), False Positive (FP), True Negative (TN), and False Negative (FN) [16]. Accuracy assesses the model’s dependability across both categories and precision summarizes the true positives predicted out of the total positive items forecasted by the models [12]. Recall and specificity can be viewed as two forms of accuracy for actual positive and negative cases respectively, with recall is the ratio of true positive predictions to the total actual positive cases, and specificity is the ratio of true negative predictions to the total actual negative cases [17]. F1 score is the harmonic mean of Precision and Recall, which provides a more comprehensive evaluation of the predictive ability of classification models. All performance metrics mentioned have been computed for each approach and are available in Table 3.
5.2. Experiment Result
According to Table 3, Random forests have the best performance, while logistic regression performs the worst of the three models. The accuracy of random forest is 89.11%, which is 12.15% and 3.88% ahead of logistic regression and decision tree, respectively. Recall and Precision are at odds with decision trees and logic forests. Given that the F1 score is a reconciler of recall and precision, a more robust way of comparing the performance between the models is the F1 score. Random Forest's F1 score of 84.48% is higher than the other two models, so it performs the best.
Table 3: Performance measures for each method are presented
Model | Accuracy | Precision | Recall | Specificity | F1 score |
Logistic Regression | 76.96% | 71.58% | 62.94% | 85.3% | 66.98% |
Decision Tree | 85.23% | 79.78% | 80.67% | 87.9% | 80.23% |
Random Forest | 89.11% | 89.85% | 79.68% | 94.7% | 84.46% |
6. Discussion
In the conducted research, three distinct models are employed: Logistic Regression, Decision Tree, and Random Forest. The Logistic Regression models, with their relatively straightforward mathematical expressions and parameter explanations, are inherently comprehensible and easy to implement. The Decision Tree algorithm possesses the capability to handle both numerical and discrete features without necessitating additional processing. And the Random Forest model, on the other hand, boasts high accuracy and provides a ranking of feature importance. The final results indicate that random forest performs the best in predicting whether travelers will cancel their hotel reservations.
In previous studies, most of them only build a prediction model unlike previous studies. In this paper, the comparison of the three methods not only improves the accuracy of the prediction but also makes the results more credible. Meanwhile, unlike previous studies which only studied external factors [6-8], in this paper we studied internal factors including lead time, deposit type, and so on. We also developed implementable strategies for the system. For special request, the hotel can further identify the customer's needs and contact them to inquire about the needs after they have made the reservation. It is also possible to use the database to record the special requests of historical customers to improve their satisfaction. For lead time, the hotel can set up a penalty system to minimize the financial loss caused by cancellation after booking. Finally, for deposit type, through the implementation of phased payment, such as the first 20% of the booking, check-in after the payment of the rest, this not only reduces the probability of customer cancellation of the booking, but also for the hotel to bring more revenue.
Despite these strengths, the study acknowledges two areas of potential improvement that future research may wish to address. The first limitation pertains to the incomplete resolution of multicollinearity. In this study, features with Variance Inflation Factor (VIF) values exceeding 10 are subjectively eliminated, an action that could potentially result in reduced model interpretability and introduce model bias. The second limitation lies in the suboptimal performance of the research model. Despite comparative analysis of the three models indicating the random forest model as the most effective, its predictive capacity failed to surpass 90%, indicating room for enhancement. Moreover, an imbalance is observed between specificity and recall, suggesting that the models' ability to distinguish between different types of samples is not equally proficient.
7. Conclusion
This study illustrates the feasibility for enhancing hotel operational efficiency by analyzing reservation cancellations. Hotels can handle cancellations better and make more valid decisions about pricing, hotel rooms allocation, and staffing through predictive modeling and optimization techniques.
Consequently, future studies should focus on coordinating external data sources, such as economic barometers or other social factors, to increase the robustness and accuracy of prediction models. What’s more, the application of machine learning algorithms like ensemble learning models -- XGBoost to enhance the predicting accuracy is another approach to be considered. In addition, future research can screen potential multicollinearity features through methods such as Lasso regression and Ridge regression. Although the study has explored the influnce of real-time decision-making tools, such as dynamic pricing, automated rebooking systems may offer hotels a more convenient way to deal with cancellations. The hope is that there are still many avenues to improve the efficiency of hotel operations.
References
[1]. McCabe, L. (2023). SiteMinder’s Hotel Booking Trends: New analysis of 100 million reservations shows surge in global traveller confidence for 2023. [online] SiteMinder. Available at: https://www.siteminder.com/news/siteminder-hotel-booking-trends-2022/.
[2]. EHL Insights (2023). Hospitality industry data and key statistics: 2024 update. [online] hospitalityinsights.ehl.edu. Available at: https://hospitalityinsights.ehl.edu/hospitality-industry-statistics.
[3]. World (2019). Economic Impact. [online] Wttc.org. Available at: https://wttc.org/research/economic-impact#:~:text=In%202019%2C%20prior%20to%20the%20pandemic%2C%20Travel%20%26
[4]. Krishnan, V., Mann, R., Seitzman, N. and Wittkamp, N. (2020). COVID-19’s effect on the hotel industry | McKinsey. [online] www.mckinsey.com. Available at: https://www.mckinsey.com/industries/travel-logistics-and-infrastructure/our-insights/hospitality-and-covid-19-how-long-until-no-vacancy-for-us-hotels.
[5]. USHAKOV, R.N., KRYUKOVA, E.M., KHETAGUROVA, V.S., MUKHOMOROVA, I.V. and ZELENOV, V.V. (2020). Efficiency of Hotel Management. Training of Specialists in Hotel Industry Field. Journal of Environmental Management and Tourism, 11(2), p.388. doi:https://doi.org/10.14505//jemt.11.2(42).17.
[6]. Kwortnik, R.J. and Thompson, G.M. (2008). Unifying Service Marketing and Operations With Service Experience Management. Journal of Service Research, 11(4), pp.389–406. doi:https://doi.org/10.1177/1094670509333595.
[7]. Gavilan, D., Avello, M., & Martinez-Navarro, G. (2018). The influence of online ratings and reviews on hotel booking consideration. Tourism Management, 66, 53-61. https://doi.org/10.1016/j.t ourman.2017.10.018
[8]. Liu, N.K. & Zhang, E.Y. (2014). An investigation of factors affecting customer selection of online hotel booking channels. International Journal of Hospitality Management, 39, pp. 71-83. doi:10.1016/j.ijhm.2014.01.011.
[9]. Lee, J. & Back, K.J. (2008). The role of demographics in the impact of the consumer’s perceived value on customer satisfaction. Journal of Travel Research, 47(4), pp. 445-457. doi:10.1177/0047287508322442.
[10]. Choi, K.M. & Choi, S.J. (2020). Factors affecting hotel booking cancellation. Journal of Hospitality and Tourism Management, 43, pp. 123-133. doi:10.1016/j.jhtm.2019.11.004.
[11]. Gartvall, E. and Skånhagen, O. (2022). Predicting hotel cancellations using machine learning. Handle.net. [online] doi:http://hdl.handle.net/2077/70742.
[12]. Sánchez-Medina, A.J. and C-Sánchez, E. (2020) ‘Using machine learning and big data for efficient forecasting of hotel booking cancellations’, International Journal of Hospitality Management, 89, p. 102546. doi:10.1016/j.ijhm.2020.102546.
[13]. Wu, Y. et al. (2024) ‘Risk assessment of bridge construction investigated using random forest algorithm’, Scientific Reports, 14(1). doi:10.1038/s41598-024-72051-5.
[14]. de Klerk, J. et al. (2024) ‘Modelling bluetongue and African horse sickness vector (Culicoides spp.) distribution in the Western Cape in South Africa using Random Forest Machine Learning’, Parasites & Vectors, 17(1). doi:10.1186/s13071-024-06446-8.
[15]. Yao, G. et al. (2024) ‘Research on the decision-making method for the passive design parameters of zero energy houses in severe cold regions based on decision trees’, Energies, 17(2), p. 506. doi:10.3390/en17020506.
[16]. Krstinić, D. et al. (2020) ‘Multi-label classifier performance evaluation with confusion matrix’, Computer Science & Information Technology [Preprint]. doi:10.5121/csit.2020.100801.
[17]. Vanacore, A., Pellegrino, M.S. and Ciardiello, A. (2024) ‘Fair evaluation of classifier predictive performance based on binary confusion matrix’, Computational Statistics, 39(1), pp. 363–383. doi:10.1007/s00180-022-01301-9.
Cite this article
Li,X.;Xie,X.;Tang,J. (2025). Optimizing Hotel Efficiency Through Predictive Analysis of Reservation Cancellations. Applied and Computational Engineering,134,112-122.
Data availability
The datasets used and/or analyzed during the current study will be available from the authors upon reasonable request.
Disclaimer/Publisher's Note
The statements, opinions and data contained in all publications are solely those of the individual author(s) and contributor(s) and not of EWA Publishing and/or the editor(s). EWA Publishing and/or the editor(s) disclaim responsibility for any injury to people or property resulting from any ideas, methods, instructions or products referred to in the content.
About volume
Volume title: Proceedings of the 5th International Conference on Signal Processing and Machine Learning
© 2024 by the author(s). Licensee EWA Publishing, Oxford, UK. This article is an open access article distributed under the terms and
conditions of the Creative Commons Attribution (CC BY) license. Authors who
publish this series agree to the following terms:
1. Authors retain copyright and grant the series right of first publication with the work simultaneously licensed under a Creative Commons
Attribution License that allows others to share the work with an acknowledgment of the work's authorship and initial publication in this
series.
2. Authors are able to enter into separate, additional contractual arrangements for the non-exclusive distribution of the series's published
version of the work (e.g., post it to an institutional repository or publish it in a book), with an acknowledgment of its initial
publication in this series.
3. Authors are permitted and encouraged to post their work online (e.g., in institutional repositories or on their website) prior to and
during the submission process, as it can lead to productive exchanges, as well as earlier and greater citation of published work (See
Open access policy for details).
References
[1]. McCabe, L. (2023). SiteMinder’s Hotel Booking Trends: New analysis of 100 million reservations shows surge in global traveller confidence for 2023. [online] SiteMinder. Available at: https://www.siteminder.com/news/siteminder-hotel-booking-trends-2022/.
[2]. EHL Insights (2023). Hospitality industry data and key statistics: 2024 update. [online] hospitalityinsights.ehl.edu. Available at: https://hospitalityinsights.ehl.edu/hospitality-industry-statistics.
[3]. World (2019). Economic Impact. [online] Wttc.org. Available at: https://wttc.org/research/economic-impact#:~:text=In%202019%2C%20prior%20to%20the%20pandemic%2C%20Travel%20%26
[4]. Krishnan, V., Mann, R., Seitzman, N. and Wittkamp, N. (2020). COVID-19’s effect on the hotel industry | McKinsey. [online] www.mckinsey.com. Available at: https://www.mckinsey.com/industries/travel-logistics-and-infrastructure/our-insights/hospitality-and-covid-19-how-long-until-no-vacancy-for-us-hotels.
[5]. USHAKOV, R.N., KRYUKOVA, E.M., KHETAGUROVA, V.S., MUKHOMOROVA, I.V. and ZELENOV, V.V. (2020). Efficiency of Hotel Management. Training of Specialists in Hotel Industry Field. Journal of Environmental Management and Tourism, 11(2), p.388. doi:https://doi.org/10.14505//jemt.11.2(42).17.
[6]. Kwortnik, R.J. and Thompson, G.M. (2008). Unifying Service Marketing and Operations With Service Experience Management. Journal of Service Research, 11(4), pp.389–406. doi:https://doi.org/10.1177/1094670509333595.
[7]. Gavilan, D., Avello, M., & Martinez-Navarro, G. (2018). The influence of online ratings and reviews on hotel booking consideration. Tourism Management, 66, 53-61. https://doi.org/10.1016/j.t ourman.2017.10.018
[8]. Liu, N.K. & Zhang, E.Y. (2014). An investigation of factors affecting customer selection of online hotel booking channels. International Journal of Hospitality Management, 39, pp. 71-83. doi:10.1016/j.ijhm.2014.01.011.
[9]. Lee, J. & Back, K.J. (2008). The role of demographics in the impact of the consumer’s perceived value on customer satisfaction. Journal of Travel Research, 47(4), pp. 445-457. doi:10.1177/0047287508322442.
[10]. Choi, K.M. & Choi, S.J. (2020). Factors affecting hotel booking cancellation. Journal of Hospitality and Tourism Management, 43, pp. 123-133. doi:10.1016/j.jhtm.2019.11.004.
[11]. Gartvall, E. and Skånhagen, O. (2022). Predicting hotel cancellations using machine learning. Handle.net. [online] doi:http://hdl.handle.net/2077/70742.
[12]. Sánchez-Medina, A.J. and C-Sánchez, E. (2020) ‘Using machine learning and big data for efficient forecasting of hotel booking cancellations’, International Journal of Hospitality Management, 89, p. 102546. doi:10.1016/j.ijhm.2020.102546.
[13]. Wu, Y. et al. (2024) ‘Risk assessment of bridge construction investigated using random forest algorithm’, Scientific Reports, 14(1). doi:10.1038/s41598-024-72051-5.
[14]. de Klerk, J. et al. (2024) ‘Modelling bluetongue and African horse sickness vector (Culicoides spp.) distribution in the Western Cape in South Africa using Random Forest Machine Learning’, Parasites & Vectors, 17(1). doi:10.1186/s13071-024-06446-8.
[15]. Yao, G. et al. (2024) ‘Research on the decision-making method for the passive design parameters of zero energy houses in severe cold regions based on decision trees’, Energies, 17(2), p. 506. doi:10.3390/en17020506.
[16]. Krstinić, D. et al. (2020) ‘Multi-label classifier performance evaluation with confusion matrix’, Computer Science & Information Technology [Preprint]. doi:10.5121/csit.2020.100801.
[17]. Vanacore, A., Pellegrino, M.S. and Ciardiello, A. (2024) ‘Fair evaluation of classifier predictive performance based on binary confusion matrix’, Computational Statistics, 39(1), pp. 363–383. doi:10.1007/s00180-022-01301-9.