


1. Introduction
The price of cryptocurrencies fluctuates wildly in a short period of time, and this volatility is much higher than that of traditional assets. High volatility brings the possibility of high returns for investors, but it also increases risk and makes the cryptocurrency market unstable. Therefore, investors build portfolios by diversifying their funds across different assets to achieve more stable returns while reducing the impact of individual asset or market fluctuations on overall investments, effectively lowering risk while ensuring returns. In this paper, we try to combine traditional cryptocurrency portfolio optimization methods and LSTM time series prediction, train the price prediction models of three currencies, BTC, ETH, LTC, through a large amount of data, use the models to predict the cryptocurrency price data for January-June 2024, and finally calculate the optimal weights of the portfolios for each month using the extended Markowitz theory.
2. Literature
Over the years, there has been significant academic research on the optimization of cryptocurrency portfolios. Similar to traditional portfolios, most investors use Markowitz's theory (Modern Portfolio Theory, MPT) to optimize cryptocurrency portfolios. Fabozzi, Gupta, & Markowitz stated that "Essentially, MPT is an investment framework for the selection and construction of investment portfolios based on the maximization of expected returns of the portfolio and the simultaneous minimization of investment risk [1]. Markowitz introduced the mean-variance optimization method, emphasizing that by properly allocating multiple assets, investors can maximize returns for a given risk level or minimize risk for a given return level. Portfolio selection uses modeling techniques to quantify "expected portfolio returns" and "acceptable levels of portfolio risk," and provides a method for choosing the best returns [2].
However, there are also some drawbacks to Markowitz's theory. First, it assumes that all investors are rational, aiming to maximize returns and minimize risk. Putra, Dana learned that in the Markowitz approach, the selection of an investor's portfolio is based on the preference for the expected return and the risk of each portfolio choice. In reality, social responsibility metrics also influence investment decisions [3]. Gasser noted that compared to return-risk optimal portfolios, investors who are concerned with social responsibility face a significant decline in the Sharpe ratio [4]. Secondly, in actual markets, asset returns may not follow a normal distribution and may exhibit fat-tail distributions, which could lead to an underestimation of extreme risks. Furthermore, Markowitz's theory relies on historical data to estimate future returns and risks, and the mean-variance model is highly sensitive to input data (such as expected returns, variances, and covariances) [2]. As El Karoui studied the realized risk of Markowitz portfolios computed using parameters estimated from data and generalizations to similar questions involving the out-of-sample risk in quadratic programs with linear equality constraints. The work shows that risk is underestimated in this setting and, further, that in the class of elliptical distributions, the Gaussian case yields the least amount of risk underestimation [5].
Since financial market data is typically time series data, these parameters may change over time. To capture these changes, investors can use the rolling window technique. The rolling window method makes it possible for financiers to readjust their profiles in a prompt manner to respond to changes in market conditions. This approach aids stay clear of dependence on out-of-date historic information, which might result in inaccurate financial investment decisions.Li, Balcilar, & Gupta utilized a twenty-four-month rolling window over the period 1995:02 to 2013:02 in China and 2003:02 to 2013:02 in India to recognize possible time-varying origins in between time collection based on sub-sample data [6]. The rolling window (Rolling Window) technique in time series evaluation and modeling has lots of benefits but likewise has some downsides and limitations. For example, a window that is also tiny might create the model to focus excessively on temporary changes, ignoring lasting fads; a window that is as well huge may cause the design to respond slowly to recent adjustments.
Despite the shortcomings of the rolling window technique, it can be effectively incorporated with LSTM to reduce these issues.Sherstinsky explained that importantly, the normal RNN formulas stemmed from differential equations can work as a starting model that details a clear logical course to the ultimate realization of the LSTM system style [7] .Staudemeyer & Morris noted that LSTM can successfully capture long-term dependences in time series, preventing the slope vanishing trouble in typical RNNs [8] .Gülmez thinks that LSTM can effectively forecast costs by dealing with data with multiple input and outcome time actions [9]. LSTM is especially well-suited for dealing with sequential data, such as message and speech, lining up with the present demands of the artificial intelligence sector. Nelson & Pereira aimed to achieve this objective by developing a forecast design and carrying out a series of experiments. The acquired outcomes were encouraging, with an ordinary precision of up to 55.9% when forecasting whether the price of a particular supply would increase in the near future, showing the advanced nature of the LSTM version, which is commonly promoted internationally [10].Tandon & Tripathi reported a proposed model for predicting the price of the popular Bitcoin cryptocurrency, simultaneously applying different neural network methods, namely Recurrent Neural Networks (RNN) and Long Short-Term Memory (LSTM), as well as 10-fold cross-validation. The neural network model estimated daily price changes, and this research paper compared the proposed model with other existing models, finding that the mean absolute error was significantly lower than that of existing models [11]. The combination of LSTM and the rolling window technique can further enhance performance in time series prediction.
3. Methodology
3.1. Data
Data used for the prediction were taken from Binance Exchange. In this work, daily prices for Bitcoin, Ethereum, and Litecoin over the past six years were collected. Based on the prices of these three cryptocurrencies over the past six years, two metrics are selected—standard deviation and annualized volatility—to measure their volatility. At first, the information are organized right into monthly periods, with each group containing 30 days \( × \) 24 hours, and calculated the standard deviation (see Figure1) and annualized volatility (see Figure2) for each and every month's information separately.
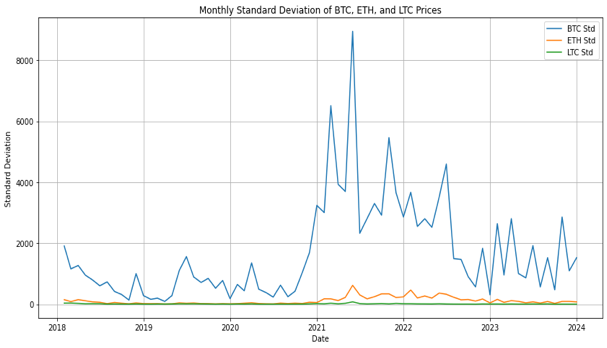
Figure 1: The Standard Deviations of Three Cryptocurrencies.
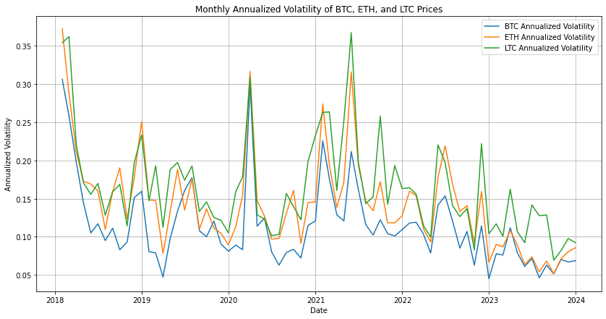
Figure 2: Monthly Annualized Volatility of Three Cryptocurrencies.
3.2. LSTM Time Series Forcasting
The Long Short-Term Memory (LSTM) network is a kind of Recurrent Neural Network (RNN) particularly created for taking care of and predicting time series information. Unlike traditional RNNs, LSTM presents memory cells and numerous gating devices, which deal with the issue of disappearing slopes in long sequences, making it more efficient in recording long-term dependences within the information.
The LSTM version learns by adjusting the weights and predispositions to reduce the mistake in between the anticipated worths and the real worths. A typically utilized loss feature is the Mean Squared Error (MSE), defined as:
\( MSE = \frac{1}{n}\sum _{i=1}^{n}{({y_{i}}-{\hat{y}_{i}})^{2}} \) (1)
During backpropagation, the LSTM utilizes a method called "Backpropagation Through Time" (BPTT) to upgrade the weights throughout time actions, gradually learning the facility patterns in the data.
This way, LSTM is able to properly forecast monetary time series, such as cryptocurrency prices, which gives strong support for the subsequent cryptocurrency portfolio optimization.
In the forecast task, three separate LSTM designs are set up, each targeting BTC, ETH, and LTC, all sharing the very same design. Each version contains an input layer, 2 LSTM layers, a dropout layer with a dropout rate of 0.3, and two dence layers for the last outcome, and the version is educated utilizing a batch dimension of 64 and for 50 dates.
For the training and screening procedure, the historical rate information for each cryptocurrency (BTC, ETH, and LTC) were divided into training and testing collections, with 80% of the information assigned for training and the remaining 20% for screening.
The sliding window approach was made use of to develop a series of 128 time actions needed to train the version. This approach involved making use of the past 128 observations to anticipate the following worth in the series. Particularly, the moving window relocated via the dataset, developing overlapping input sequences, where each sequence was shifted by one-time step.
After changing the information into the ideal format, the improved sequences were utilized as input for the LSTM versions. The moving window not just facilitated the creation of these series yet additionally guaranteed that the model continuously learned from the most current data points, which is critical for precise prediction in monetary time series.
Portfolio Optimization Process
3.2.1. Extended Portfolio Theory
This study utilizes a extended Markowitz framework, which includes short-selling approaches in the asset allocation procedure to optimize a portfolio. In traditional Markowitz portfolio theory, it is typically assumed that asset weights are non-negative, which implies that investors can only profit in rising markets. However, when applying the traditional optimization method, certain assets in a portfolio of it may consistently have zero weights. This outcome suggests that these assets are either perceived as adding no value or as being too risky. To address this limitation, this study extends the traditional model by removing the restriction on short-selling, allowing investors to hedge risks or take advantage of market downturns by short-selling certain assets. And this essay develops an extended Markowitz portfolio model that includes three cryptocurrencies: Bitcoin, Ethereum, and Litecoin. The objective is to optimize the portfolio’s risk-adjusted returns by maximizing the Sharpe Ratio.
3.2.2. Rolling Window Optimisation Method
This study compares two methods for optimizing cryptocurrency portfolios: traditional rolling window optimization and an enhanced approach with LSTM predictions. The traditional method uses six years of historical data, updated monthly with new data, but mainly relies on past information, which may not fully account for future market changes. To address this, the work incorporates LSTM predictions to create a more forward-looking portfolio. Each month, the LSTM-Enhanced methodblends historical data, real new data, and LSTM forecasts, allowing the portfolio to better anticipate market shifts and improve risk-adjusted returns in a dynamic environment. Both methods of rolling windows are explained by Table 1.
Table 1: Comparison between Traditional Rolling Window Method and LSTM-Enhanced Method.
Method | Traditional Rolling Window Method | LSTM-Enhanced Rolling Window Method |
Data Sources | Historical data (past 6 years) + new real data | Combined historical data, real data, and LSTM-predicted data |
Optimization Basis | Mean-variance model | Mean-variance model combined with LSTM predictions |
Adjustment Frequency | Monthly, based on historical and new real data | Monthly, based on historical data, real data, and predicted data |
4. Results
4.1. LSTM model prediction results
In the evaluation of the three cryptocurrency prediction models, four metrics (MAE, MSE, NMSE, and RMSE) are used to evaluate the models. Among them, due to the large price gap among the three cryptocurrencies, the NMSE metric is added, which can measure the relative performance of the models on the dataset, to the mainstream MAE, MSE, and RME metrics for evaluation.
Table 2: Performance metrics for the cryptocurrency models.
Cryptocurrency | MSE | RMSE | MAE | NMSE |
BTC | 24952.60 | 157.96 | 111.13 | 0.00055 |
ETH | 1005.05 | 31.70 | 30.43 | 0.01332 |
LTC | 0.47 | 0.68 | 0.43 | 0.00295 |
Table2 shows the predictive effect of these three cryptocurrencies. As can be seen from the results, Bitcoin (BTC) has the lowest NMSE, indicating that its model works better across the three cryptocurrencies, but, due to its own higher price, Bitcoin (BTC) still has the highest MAE, showing that it has the largest average absolute error in its prediction results on real data.
In contrast, the Litecoin (LTC) model has the lowest MSE, RMSE, and MAE metrics, suggesting that its model is more accurate and has a smaller error on real-data predictions, while Ether (ETH) performs between Bitcoin (BTC) and Litecoin (LTC).
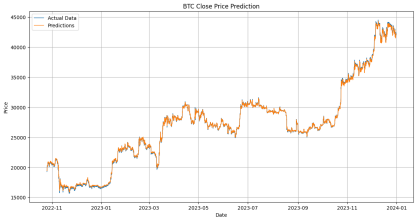
(a) BTC Test Result.
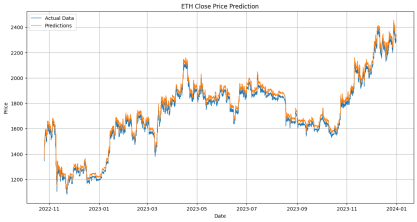
(b) ETH Test Result.
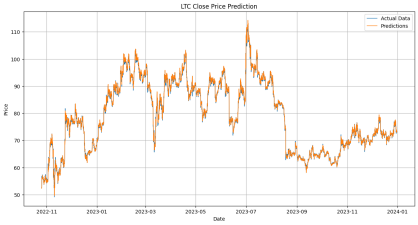
(c) LTC Test Result.
Figure 3: Test Set Results For Three Cryptocurrencies.
Figure3 shows the visualization of the results of the three cryptocurrency predictions. The results can investigate that all three models can predict the price movement well, with ETH's prediction having a slightly larger bias, but also showing the details of the rise and fall of the data better.
4.2. Portfolio Method Comparison
4.2.1. Comparison of Weight Allocations
Based on the weights generated by the two methods, as shown in Table 3, it can be concluded that ETH consistently holds a major position, indicating its relative stability and favourable expected performance, regardless of whether the method relies on historical data or integrates LSTM predictions. BTC’s weight exhibits significant fluctuations in the LSTM-enhanced method, reflecting potential market uncertainty and the model’s responsiveness to dynamic market changes. In contrast, LTC maintains a consistently negative weight in both methods, suggesting a generally pessimistic outlook for its future performance, with the LSTM- enhanced method showing greater sensitivity in predicting LTC’s market behaviour.
Table 3: Cryptocurrency Portfolio Weights: Traditional and LSTM.
Month | BTC | ETH | LTC | |||
Traditional | LSTM | Traditional | LSTM | Traditional | LSTM | |
1 | 0.743493 | 0.756949 | 1.000000 | 1.000000 | -0.743493 | -0.756949 |
2 | 0.747244 | 0.801551 | 1.000000 | 0.983615 | -0.747244 | -0.785166 |
3 | 0.741573 | 0.769938 | 0.990323 | 0.877082 | -0.731896 | -0.647020 |
4 | 0.743249 | 0.822286 | 0.989310 | 0.954974 | -0.732559 | -0.777260 |
5 | 0.743842 | 0.807641 | 0.989569 | 0.983084 | -0.733411 | -0.790726 |
6 | 0.744308 | 0.787112 | 0.990358 | 0.987524 | -0.734665 | -0.774636 |
4.2.2. Comparison of Portfolio Actual Effects
Table 4presents the actual performance in three targets and the line curves in Figure 4 depict the differences between the LSTM-enhanced prediction model and the traditional model in monthly real return, volatility, and Sharpe ratio through bringing the optimal portfolio weight back to the real data for calculation.
Table 4: Comparison of Traditional and LSTM Model in Three Targets.
Month | Real Return | Real Volatility | Sharpe Ratio | |||
Traditional | LSTM | Traditional | LSTM | Traditional | LSTM | |
1 | 0.073812 | 0.074785 | 0.009614 | 0.009582 | 7.677209 | 7.804439 |
2 | 0.673893 | 0.683409 | 0.009620 | 0.009615 | 70.049690 | 71.080162 |
3 | -0.035234 | -0.015893 | 0.009576 | 0.009726 | -3.679366 | -1.634092 |
4 | -0.114468 | -0.110144 | 0.009575 | 0.010132 | -11.955114 | -10.870531 |
5 | 0.300659 | 0.303210 | 0.009577 | 0.009972 | 31.395029 | 30.405664 |
6 | 0.785112 | 0.802312 | 0.008999 | 0.008788 | 86.552130 | 88.214124 |
(a)Real Return. (b) Real Volatility. (c) Real Sharp Ratio.
Figure 4: Three Targets Difference Between Two Models.
As shown in Table 4 and Figure 4, Real Return in LSTM model exhibits slightly higher returns compared to the traditional model, significantly in February and March. The differences in volatility are relatively small, with the LSTM model demonstrating more stability in certain months, though it also exhibits higher volatility in others. And the Sharpe ratio of the LSTM model is superior in most month. These results suggest that the LSTM-enhanced prediction model generally realizes higher returns with relatively low risk, which is an important advantage for investors, especially in volatile cryptocurrency markets. Although there is still potential for improvement in volatility control, its adaptability and flexibility in complex market environments make it a powerful tool.
5. Conclusion
This paper proposes a portfolio optimisation method that combines the predicted cryptocurrency prices and historical cryptocurrency prices from LSTM models on the basis of traditional portfolio optimisation methods. Compared with traditional portfolio optimisation methods, extended portfolio optimisation strategy incorporates forecast data generated through extensive learning by machine learning models when calculating the weights, which can better control the trend of cryptocurrency price changes to help investors obtain lower risks and higher returns. The empirical study uses the hourly closing prices of three cryptocurrencies, BTC, ETH, and LTC, from January to June 2024 for testing and observing their performance in terms of return and risk metrics, and the results show that the portfolio optimisation method using a combination of LSTM time series forecasting can achieve higher returns and avoid more risks compared to the traditional method. Although the cryptocurrency portfolio optimisation method proposed in this paper obtains better results in the test data, the versatility of the method needs to be further explored due to the possible accumulation of errors and the lack of long-term prediction in the practical application of the prediction method.
References
[1]. Fabozzi, F. J., Gupta, F., Markowitz, H. M. (2002) The legacy of modern portfolio theory. The Journal of Investing, 11: 7–22.
[2]. Fabozzi, F. J., Markowitz, H. M., Gupta, F. (2011) Portfolio selection. In: The Theory and Practice of Investment Management. pp. 45–78.
[3]. Fabozzi, F. J., Markowitz, H. M., Gupta, F. (2011) Portfolio selection. In: The Theory and Practice of Investment Management. pp. 45–78.
[4]. Gasser, S. M., Rammerstorfer, M., Weinmayer, K. (2017) Markowitz re-visited: Social portfolio engineering. European Journal of Operational Research, 258: 1181–1190.
[5]. Li, X.-L., Balcilar, M., Gupta, R., Chang, T. (2016) The causal relationship between economic policy uncertainty and stock returns in China and India: Evidence from a bootstrap rolling window approach. Emerging Markets Finance and Trade, 52: 674–689.
[6]. Li, X.-L., Balcilar, M., Gupta, R., Chang, T. (2016) The causal relationship between economic policy uncertainty and stock returns in China and India: Evidence from a bootstrap rolling window approach. Emerging Markets Finance and Trade, 52: 674–689.
[7]. Sherstinsky, A. (2020) Fundamentals of recurrent neural network (RNN) and long short-term memory (LSTM) network. Physica D: Nonlinear Phenomena, 404: 132306.
[8]. Gülmez, B. (2023) Stock price prediction with optimized deep LSTM network with artificial rabbits optimization algorithm. Expert Systems with Applications, 227: 120346.
[9]. Gülmez, B. (2023) Stock price prediction with optimized deep LSTM network with artificial rabbits optimization algorithm. Expert Systems with Applications, 227: 120346.
[10]. Nelson, D. M., Pereira, A. C., De Oliveira, R. A. (2017) Stock market’s price movement prediction with LSTM neural networks. In: 2017 International Joint Conference on Neural Networks (IJCNN). IEEE, pp. 1419–1426.
[11]. Tandon, S., Tripathi, S., Saraswat, P., Dabas, C. (2019) Bitcoin price forecasting using LSTM and 10-fold cross validation. In: 2019 International Conference on Signal Processing and Communication (ICSC). IEEE, pp. 323–328
Cite this article
Xu,Z.;Zhang,X.;Zhou,Z. (2025). Cryptocurrency Portfolio Optimisation Based on LSTM Time Series Forecasting. Applied and Computational Engineering,134,143-150.
Data availability
The datasets used and/or analyzed during the current study will be available from the authors upon reasonable request.
Disclaimer/Publisher's Note
The statements, opinions and data contained in all publications are solely those of the individual author(s) and contributor(s) and not of EWA Publishing and/or the editor(s). EWA Publishing and/or the editor(s) disclaim responsibility for any injury to people or property resulting from any ideas, methods, instructions or products referred to in the content.
About volume
Volume title: Proceedings of the 5th International Conference on Signal Processing and Machine Learning
© 2024 by the author(s). Licensee EWA Publishing, Oxford, UK. This article is an open access article distributed under the terms and
conditions of the Creative Commons Attribution (CC BY) license. Authors who
publish this series agree to the following terms:
1. Authors retain copyright and grant the series right of first publication with the work simultaneously licensed under a Creative Commons
Attribution License that allows others to share the work with an acknowledgment of the work's authorship and initial publication in this
series.
2. Authors are able to enter into separate, additional contractual arrangements for the non-exclusive distribution of the series's published
version of the work (e.g., post it to an institutional repository or publish it in a book), with an acknowledgment of its initial
publication in this series.
3. Authors are permitted and encouraged to post their work online (e.g., in institutional repositories or on their website) prior to and
during the submission process, as it can lead to productive exchanges, as well as earlier and greater citation of published work (See
Open access policy for details).
References
[1]. Fabozzi, F. J., Gupta, F., Markowitz, H. M. (2002) The legacy of modern portfolio theory. The Journal of Investing, 11: 7–22.
[2]. Fabozzi, F. J., Markowitz, H. M., Gupta, F. (2011) Portfolio selection. In: The Theory and Practice of Investment Management. pp. 45–78.
[3]. Fabozzi, F. J., Markowitz, H. M., Gupta, F. (2011) Portfolio selection. In: The Theory and Practice of Investment Management. pp. 45–78.
[4]. Gasser, S. M., Rammerstorfer, M., Weinmayer, K. (2017) Markowitz re-visited: Social portfolio engineering. European Journal of Operational Research, 258: 1181–1190.
[5]. Li, X.-L., Balcilar, M., Gupta, R., Chang, T. (2016) The causal relationship between economic policy uncertainty and stock returns in China and India: Evidence from a bootstrap rolling window approach. Emerging Markets Finance and Trade, 52: 674–689.
[6]. Li, X.-L., Balcilar, M., Gupta, R., Chang, T. (2016) The causal relationship between economic policy uncertainty and stock returns in China and India: Evidence from a bootstrap rolling window approach. Emerging Markets Finance and Trade, 52: 674–689.
[7]. Sherstinsky, A. (2020) Fundamentals of recurrent neural network (RNN) and long short-term memory (LSTM) network. Physica D: Nonlinear Phenomena, 404: 132306.
[8]. Gülmez, B. (2023) Stock price prediction with optimized deep LSTM network with artificial rabbits optimization algorithm. Expert Systems with Applications, 227: 120346.
[9]. Gülmez, B. (2023) Stock price prediction with optimized deep LSTM network with artificial rabbits optimization algorithm. Expert Systems with Applications, 227: 120346.
[10]. Nelson, D. M., Pereira, A. C., De Oliveira, R. A. (2017) Stock market’s price movement prediction with LSTM neural networks. In: 2017 International Joint Conference on Neural Networks (IJCNN). IEEE, pp. 1419–1426.
[11]. Tandon, S., Tripathi, S., Saraswat, P., Dabas, C. (2019) Bitcoin price forecasting using LSTM and 10-fold cross validation. In: 2019 International Conference on Signal Processing and Communication (ICSC). IEEE, pp. 323–328