1. Introduction
With the development of China in the past several decades, urbanization and population increase are significant features [1], which can result in public resource shortages, such as in- adequate infrastructure, pressure on public services, and frequent emergencies [2]. Therefore, it merits attention to detect real-time population in urban areas to be able to allocate resources in time. In this case, existing research has already used current data to estimate population and future population trends, which could contribute to critical infrastructure development in key cities [3]. In addition, another study applied satellite imagery to estimate population, in which to use machine learning techniques for population projections and provide a new solution for social problems [4].
Nevertheless, real-time population prediction presents various challenges that extend beyond mere theoretical and technical issues. To begin with, census data is updated slowly, they almost officially publish figures every five to ten years [5], so it is impossible to gain the latest population conditions to adjust policies or distribute materials immediately. Moreover, simple statistic-based prediction models have many
factors to consider (such as birth rate, mortality rate, migration, etc) and the more complex the model, the more difficult it is to calculate and maintain [6]. On the other hand, for satellite-using estimation, the satellite system ignores the computational overhead of dividing large images into small pieces and processes every single image on DNN [7].
Therefore, a collaborative satellite-ground system is essential, where embedded satellite hard- ware can process images within energy budget constraints and transmit crucial images to the ground despite limited bandwidth challenges [8]. This system enables real-time image acquisition and processing, ensuring that when a downlink system encounters link scarcity, efficient selective transmission under short-term contact time is prioritized. However, current satellites often send images indiscriminately [9]. This work focuses on processing images onboard the satellite and se- lectively transmitting crucial images by effectively utilizing downlink capabilities. Additionally, it aims to leverage nighttime remote sensing data for predicting population dynamics, enhancing the overall utility of the satellite system.
Our contributions can be summarized as follows:
• We have developed a neural network-based model that can quickly predict population using nighttime light data.
• We have created LuminPop, a star-ground computing system with low error rates that can calculate the population of target areas in real time, thereby saving satellite bandwidth resources and energy.
• By integrating multiple existing technologies in an application called ArcGIS that is suitable for LuminPop, we have provided a more efficient approach for similar star-ground computing tasks.
2. Related work
2.1. Satellite computing
Low Earth Orbit satellites (LEO) offer a promising development opportunity for mobile edge computing due to their wide coverage and low cost. However, the environment in space is different from that on Earth where the vacuum prevents the equipment from dissipating heat through the air [10], and the thermal conditions outside the system change as the satellite rotates around the
Earth with and without sunlight [11]. At the same time, unlike ground-edge computing devices that are powered on demand, satellite systems have limited access to solar energy [12] and are subject to expropriation within the satellite system [13]. In this regard, satellite computing is challenging due to the harsh space environment.
2.2. NPP-VIIRS
With urbanization diffusing globally, detecting real-time population distribution and dy- namic variation has become increasingly important. National Polar-orbiting Partnership (NPP) is a satellite mission developed through collaboration between the National Oceanic and At- mospheric Administration (NOAA) and the National Aeronautics and Space Administration (NASA), while the Visible Infrared Imaging Radiometer Suite (VIIRS) is an important sensor on
this mission, used for monitoring Earth’s environment and climate change. VIIRS satellites can capture images that cover hundreds of square kilometers and generate geographical data contain- ing billions of pixels, providing researchers with a wealth of information. These high-resolution images allow for detailed analysis of urban expansion, land use, and population distribution. However, the high speed of satellite moving (up to 7.9km/s) results in limited connecting time with ground stations, generally lasting for several minutes. This kind of short connecting time restricts downlink transmission capability.
Currently, many Earth observation satellites utilize a bent-pipe architecture to transmit raw observation data to ground stations [14], where machine learning algorithms are then employed for processing. However, the downlink rate using Ka-band is often limited to a few hundred Mbps [15], further constraining the daily volume of data that can be downlinked. For instance, if a contact session lasts 6 minutes, the system can downlink approximately 4.39 GB of data at 100 Mbps [16]. Therefore, transmitting high-value VIIRS data is key to improving the accuracy of population dynamic monitoring. By integrating advanced processing algorithms and utilizing satellite-ground collaborative strategies, researchers can better leverage VIIRS data to support real-time population forecasts and make socio-economic analyses and policy-making for densely populated cities.
2.3. Real-time population detection
China has conducted seven population censuses since 1953. Relevant data show that the cen- sus process is not only time-consuming but also requires substantial resources and manpower [17]. With the rapid development of remote sensing technology, more efficient methods have gradually been introduced for population surveys. For instance, researchers have demonstrated a signifi- cant correlation between population numbers and regional nightlight brightness [18], which lays the foundation for the application of remote sensing data in population estimation.
However, there is currently a scarcity of research on real-time population detection. There- fore, we decided to use VIIRS data for modeling. These methods not only enhance the efficiency of surveys but also improve the temporal resolution and spatial accuracy of the data.
2.4. Cloud removal technology
Cloud cover is a significant factor affecting the quality of nightlight images. Current primary methods for cloud removal include layer stacking, machine learning, and radar-assisted detection. The layer stacking method requires multiple cloud-free images over time, which may lead to delays [19]. While machine learning methods can quickly remove clouds, deeper neural networks consume a lot of energy, making them less ideal in terms of energy consumption [20]. This study adopts a layer stacking-based cloud removal method, optimizing computational efficiency to suit the needs of nightlight prediction.
2.5. Area extraction technology
In the field of image recognition and area extraction, traditional tiling methods, which break down images into smaller sections for processing, mask extraction directly identifies.
In star-ground systems, where bandwidth and energy are critical constraints, optimizing resource usage is essential. Existing studies have shown that leveraging ground processing capa- bilities can effectively minimize satellite energy consumption [21]. However, many of these studies overlook the importance of balancing bandwidth and energy efficiency while maintaining model accuracy, which increases computing power consumption and downward pressure on data.
3. System design
3.1. Hypothesis
This study hypothesizes that there is a significant correlation between nighttime light inten- sity as observed by NPP-VIIRS and the population density in various districts of Shanghai from 2015 to 2022. Specifically, we propose the following hypotheses:
•H1: Higher nighttime intensity is correlated with a higher permanent population amount.
•H2: The model train on annual nighttime light data to predict annual population can be fine-tuned into the usage of real-time population prediction as well.
3.2. System structure
3.3. System workflow
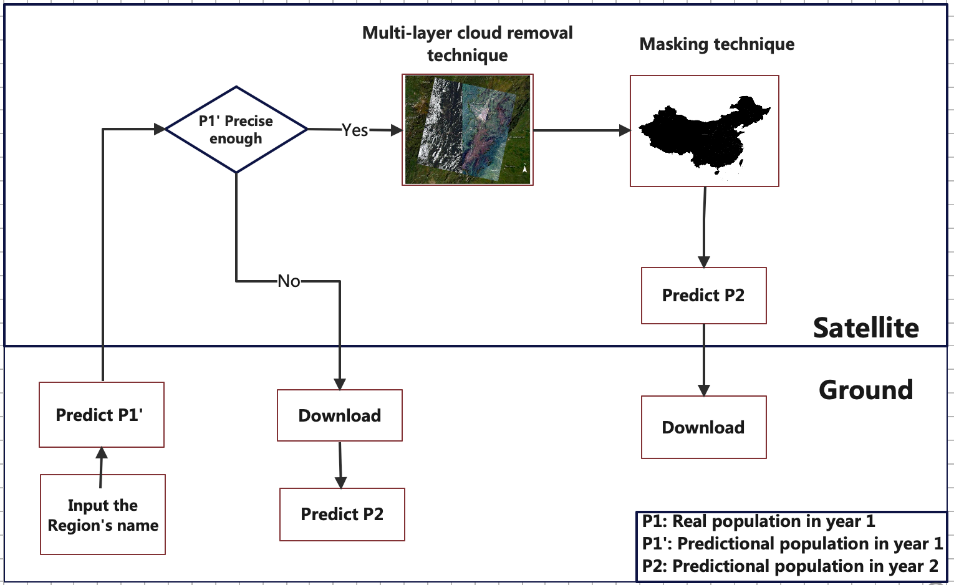
The LuminPop system is a satellite-ground collaborative system tailored for nighttime light prediction calculations. It features a wide-range, low-accuracy model used onboard satellites to predict populations in certain areas. For regions where accurate predictions are challenging,
data is transmitted to the ground for model fine-tuning using local data, ultimately achieving precise predictions. Compared to previous studies on nighttime light and population, our non- linear regression model places greater emphasis on satellite computational energy and bandwidth issues. Given the precious nature of satellite computational resources, solving the population prediction problem via satellite computation requires maximizing resource efficiency for better economic benefits.
Firstly, we analyzed the energy issue by testing potential satellite operations in a virtual environment. The main operations of the LuminPop system are divided into four parts: (1) Removing clouds and synthesizing a world map. (2) Cropping the specified area from the world map. (3) Calculating the nighttime light index for the specified area. (4) Inputting the nighttime light index into the model to output the predicted population. Through algorithm optimization and testing, we found that operations (1) and (2) consume significant energy. Due to our use of a shallow-depth, low-neuron nonlinear regression model, the energy consumed by operation (4) is negligible. Therefore, to save the satellite’s limited energy, the focus must be placed on optimizing parts (1) and (2).
Our LuminPop system employs a multi-layer cloud removal technique and a mask extrac- tion technique and finally achieves bandwidth and energy saving. For each computational task, the ground station first inputs the name of the region to be predicted, processes, and uploads the previous year’s nighttime light index M1 and population data P 1. Since the region name, nighttime light index, and population data are single numbers or string variables, the bandwidth consumed is negligible.
After receiving the data, the system first uses the onboard model to predict the previous year’s nighttime light index M1. If the prediction results P 1′ compared to population data P 1 has an error ∆P within acceptable limits, the satellite extracts recent global nighttime images and stitches multiple images into a cloud-free global nighttime image. This precisely coordinated image can quickly and efficiently yield the target area’s nighttime image using mask extraction technology, significantly reducing the energy consumed by the operation (2). After extracting the target area’s nighttime image, the system will calculate the night light index. At last, the system will predict and download the predicted final result P2. Otherwise, if ∆P is too large, the nighttime image is transmitted for ground processing and model fine-tuning before predicting the final population data P2. In this case, operation (1) is not performed on the satellite, saving processing energy. The pseudo-code of the bandwidth saving is shown in Algorithm 1.
|
Algorithm 1: Bandwidth Saving Procedure 1 Upload(M1, P 1); 2 P 1′ = model(M1); 3 ∆P = P 1 − P 1′ ; 4 if ∆P/P 1 > 15% then 5 Download(Image); 6 else 7 Processing(Image); 8 end |
3.4. Modeling
In the current environment, a satellite often needs to handle more than one problem. Addi- tionally, since satellites rely on low-output solar panels for energy, unlike ground-based on-demand electricity supply, saving energy and downlink bandwidth is crucial. To achieve this goal while obtaining a practically applicable model, we chose a model structure that is easy to deploy and can effectively converge with noisy data.
3.4.1. Models comparing
Before modeling, we observed the data and found that the preprocessed and normalized data exhibited a strong positive non-linear relationship between population and night light index. This differs from the linear relationships found in some earlier studies [22]. We speculate that the reason for this difference is due to the continuous use of high-brightness LED lights in recent years to decorate commercial areas and tourist spots in urban areas. As shown in Figure 2 and Figure 3, the brightness of the lights in Pudong New Area at night in 2007 and 2023 is very different. This has led to even higher brightness in these already bright areas, while the brightness in residential areas does not change significantly over time, causing the relationship between night light intensity and population to transition from a linear to a non-linear one.


3.4.2. Model building
The model is built using the PyTorch framework as a two-layer nonlinear regression model. The fully connected layer (input layer) processes the input data. The model has one hidden layer. Experiments show that increasing the number of neurons (perceptrons) in the hidden layer to 10 does not significantly improve accuracy, so we set the number of neurons to 12. Data is then normalized to the range [−1, 1], and the Tanh (hyperbolic tangent) function is applied element-wise for activation.
In Formula (1), x is neurons, and tanh(x) is the mapping result of each neuron. This function effectively avoids the vanishing gradient problem of the Tanh function, leveraging its smooth transitions and clear predictions.
3.4.3. Model compilation
During the model compilation process, the Mean Squared Error (MSE) cost function is used to assess the predictive capability of the model.
In Formula (2), xi is the true value and yi is the expected value. The MSE cost function determines the accuracy of the model’s predictions by calculating the expected value of the squared difference between the estimated values and the true parameters. The MSE cost function is primarily suitable for regression functions. Due to the significant impact of spatial and temporal variations on the relationship between night lights and population, it is necessary to model each area or city separately in practical applications.
Additionally, night light data processing is prone to generating noise, which can affect the convergence of the model. Taking into account the issues above, the model optimizer utilizes the Stochastic Gradient Descent (SGD) algorithm.
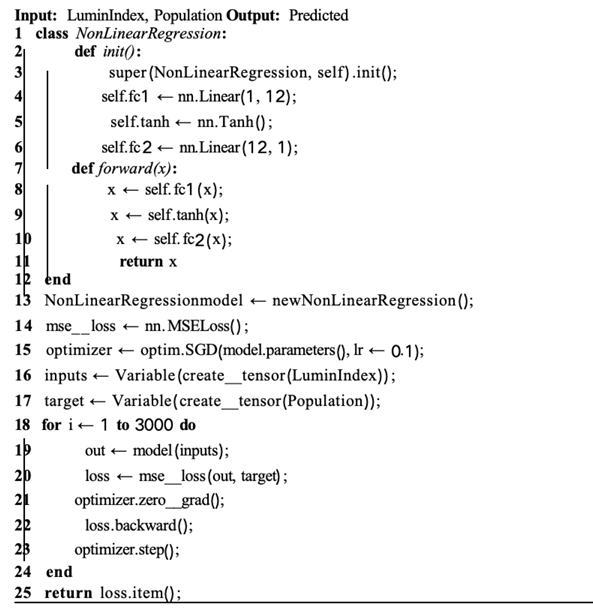
In Formula (3), θ represents the model parameters, t indicates the number of iterations, η is the learning rate, which controls the step size, f is the loss function for the ith data point. The algorithm calculates gradients using only a single sample at a time. This approach effectively enhances the speed of model training, conserves on-board computational resources and transmis- sion bandwidth, and facilitates modeling for multiple regions. Moreover, the SGD algorithm can effectively converge in most cases even with data noise. The pseudo-code of the model training is shown in Algorithm 2.
Algorithm 2: Model Training Procedure
3.5. System technology
3.5.1. Multi-layer cloud removal technique
In the experiment of predicting population based on night lights, most cities are located in coastal areas where images are often more susceptible to cloud cover compared to inland regions. Globally, approximately 60% of the area is estimated to be covered by clouds, posing a significant challenge for satellite image processing [23]. Cloud cover leads to missing critical information and can force adjustments in detection timing due to real-time detection becoming impossible when large cloud cover is present. Even thin cloud layers can adversely affect data, significantly decreasing the prediction accuracy of night light models. Therefore, cloud removal becomes a necessary task.
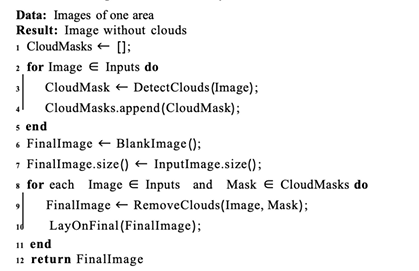
Given that population data and night light data do not undergo significant changes over short periods, synthesizing data from the current day and preceding days is feasible. Thus, utilizing layer stacking for cloud removal is more suitable for the LuminPop system. The specific operation involves initially processing multiple images of the same area, then employing existing algorithms to identify and remove cloud layers, and finally overlaying all cloud-free images onto a single layer to complete cloud removal. The pseudo-code of cloud removal is shown in Algorithm 3.
Algorithm 3: Multi-layer Cloud Removal Procedure
3.5.2. Masking technique
In our LuminPop system, we employ mask extraction algorithms to swiftly extract images of specific areas from overall pictures for processing. Mask extraction algorithms are based on a mask raster layer that filters pixels from another raster dataset, extracting the user’s areas of interest. Processed satellite images must have a clear coordinate system and undergo composite processing of the images captured by satellites. Subsequently, the images are extracted based on existing masks to obtain the final images of the target areas.
By executing initial processing onboard the satellite, we can quickly generate masks that highlight areas of interest. This allows us to selectively transmit only the essential data to the ground for further analysis, significantly reducing the volume of data transferred and conserving bandwidth. Consequently, this collaborative approach not only optimizes energy usage but also enhances the overall efficiency of the population detection process. The pseudo-code of masking is shown in Algorithm 4.
Algorithm 4: Masking Procedure
Input: NightLightMap
Input: RegionMask
Output: RegionImage
1 Function NightLightMap, RegionMask:
2 RegionImage ← [];
3 for each(x, y) ∈ WorldMap do
4 if RegionMask(x, y) then
5 RegionImage.add(WorldMap(x, y));
6 end
7 end
8 return RegionImage;
4. Evaluation
4.1. Data collection
This paper involves nighttime light data, vector data, and statistical population data from 2015 to 2022, data source, and main parameters as shown in Table 1. Nighttime light data specifically is NPP-VIIRS nighttime light, which is shown in Figure 4. VIIRS sensors can capture information like the atmosphere and surface of the earth including visible, infrared, and thermal infrared wavelengths through multiple bands. Compared with other remote sensing devices, VIIRS data could not only provide higher-resolution images, which can reveal clearer and more detailed features of the earth’s surface but also support real-time monitoring that helps researchers and decision-makers deal with dynamic environmental obstacles. We adopt some pretreatment ways to deal with VIIRS data to enhance the accuracy rating of our experiments. Besides, population data are selected from the land area and resident population data of each district under the directory of ”Population, Employment and Wages” in the Shanghai Statistical Yearbook published by the official website of the Shanghai Statistics Bureau over the past several years [24].
4.2. Data processing
During data processing, we normalized the data by mapping the total light intensity of Minhang District in 2019 as the independent variable unit 1, the permanent population number of Minhang District in 2019 as the dependent variable unit 1, the total light intensity of Huangpu District in 2019 as the independent variable unit 0, and the permanent population number of Huangpu District in 2019 as the dependent variable unit 0, and mapped the training data to the [−1, 1] interval. This processing method can effectively enhance the convergence speed of the algorithm.
|
Data Type |
Data Name |
Source |
Resolution/m |
Proportional Scale |
|
Nighttime light data |
NPP-VIIRS nighttime light |
NGDC |
500 |
- |
|
Vector data |
Administrative Divi- sions of Shanghai |
Shanghai Municipal Civil Affairs Bureau |
- |
1:150000 |
|
Statistical population data |
Statistical Data on Per- manent Resident Popu- lation by Shanghai |
Shanghai Municipal Statis- tics Bureau |
- |
- |

4.3. Model accuracy
As the primary task of our LuminPop system, the population prediction model requires high accuracy and generalizability to predict the population in most cities globally. However, light
data is closely related to the industrial structure of the area, the proportion of residential areas, and other data, making it difficult to directly use the same model and parameters to predict all areas.
In our experiment, we tested data from all districts of Shanghai from 2019 to 2022. In the results, data from some of the districts in Shanghai, including Jinshan District, Baoshan District, Shekou District, Putuo District, and Xuhui District, were difficult to predict.
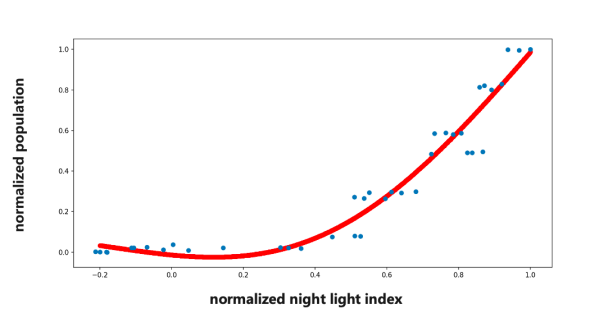
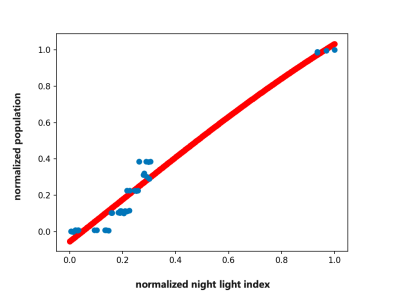
In the following three pictures, the x-axis represents the night light index, in addition, the y-axis represents the population. Figure 5 shows the model prediction results with these districts, indicating that these areas have significantly higher populations compared to other districts at the same night light index. Additionally, the Pudong New Area was omitted due to its signif- icantly higher brightness and population, which severely affected the assessment of the model’s effectiveness. Figure 6 shows the effect after adding Pudong New Area to the predictable data. The data for the remaining districts can be predicted with reasonable accuracy, with an average error of 107,000 people per district, approximately 5.6% of the actual total population. Figure 7 shows the model’s predictions for these areas. The experiment also indicated that if the pop ulation of an area for a certain year can be accurately predicted, then the data for that area in other years can also be predicted well. This is why we choose to use past data from the target area for advanced prediction to assess whether the model can complete the task.
During the experiment, we found that a set of model parameters could not accurately predict the population data for all areas. To address this issue, we fine-tuned the model using historical data from each location. Testing showed that this approach effectively improved the model’s accuracy, allowing it to predict the population data for most areas with fine-tuning, enhancing the system’s precision and generalizability, thereby increasing the practical value of the system. The results of fine-tuning the model using data from five areas that were difficult to predict in Shanghai, has an average error of 82,000 people per district, approximately 8.1% of the total population.
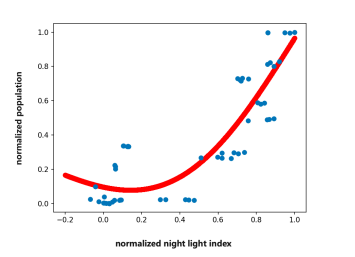
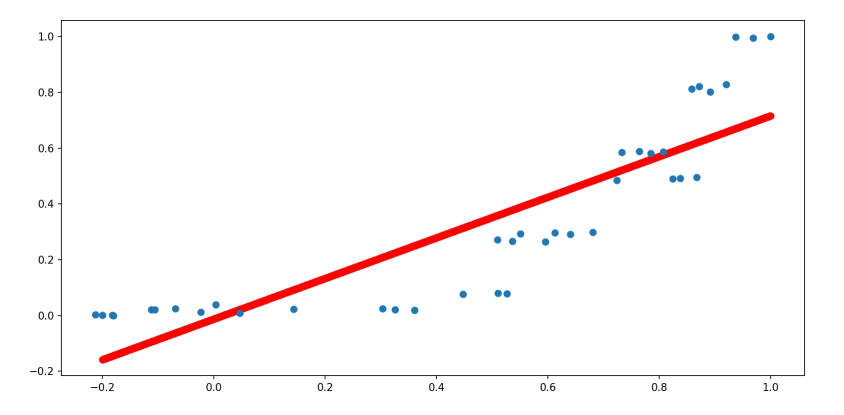
We also tested different models, and the linear econometric model resulted in significant errors when predicting population, with an average error of around 273,000 people per district, accounting for 15.2% of the total population. Not as good as neural network-based models. Figure 8 shows the numbers predicted by the linear model alongside the true numbers from the data.
4.4. Bandwidth and energy
We conducted tests and comparisons of bandwidth and energy consumption for various tasks performed by the system during operation. In the experiment, we simulated a space computing environment using an ARM architecture aerospace-grade processor, which is currently one of the most advanced processors focused on high performance. In this experiment, energy loss is measured as the time spent on task computation multiplied by the processor usage rate, while bandwidth is measured in bytes. We first tested the energy consumption of several essential tasks, and the results are shown in Table 2. During this phase, we evaluated the energy consumption of using mask extraction and traversal extraction when extracting target areas. The results indicated that mask extraction can indeed save a significant amount of energy. In the subsequent section as shown in Table 3, we tested the bandwidth savings that could be achieved by not downloading data when it can be processed on the satellite. The results showed that since the high-quality world map is a large image, processing it on the satellite will save much bandwidth.
|
Working type |
Energy consumption estimation |
Bandwidth consumption estimation |
|
Upload population and glow-in-the-dark index |
- |
<1KB |
|
Musk extraction |
8.4s*15% |
- |
|
Ergodic extraction |
180.9s*26% |
- |
|
Operating model |
4.1s*10.8% |
- |
|
Condition |
Work type |
Energy consumption estimation |
Bandwidth consumption estimation |
|
Direct processing |
Cloud Remove |
211.5s*21% |
- |
|
Direct processing |
Musk extraction |
8.4s*15% |
- |
|
Direct processing |
Night light index analysis |
46.3s*17% |
- |
|
Direct processing |
Download results |
- |
<1KB |
|
Download data |
Download the target images |
- |
10.8GB |
5. Discussion
This study aims to fill a significant gap in the field of real-time population monitoring, specifically how to utilize nighttime light data for efficient urban population forecasting. Tra- ditional census methods are updated slowly and fail to reflect dynamic population changes in ities promptly, leading to delayed public resource allocation [25]. By developing the LuminPop system, we seek to address this issue, providing timely data support for urban management and emergency response.
In this study, we employed a neural network-based model to analyze NPP-VIIRS nighttime light data, successfully achieving real-time population predictions for urban areas in Shanghai. Our main finding is that there is a significant non-linear relationship between nighttime light intensity and resident population numbers. Additionally, by optimizing model structure and algorithms, our system demonstrated a low average prediction error of 5.6% across multiple regions, indicating strong accuracy. This finding contrasts with studies reporting a primarily linear relationship between nighttime light and population [26]. We believe this discrepancy arises from variations in nighttime light sources and urban development stages across different regions. It is precisely because of these differences that our model predicts the various districts of the target city based on the data of that city, rather than considering all cities as a whole. This also causes the relationship between the two variables to become non-linear. In addition, to save scarce bandwidth resources, a selection structure is designed for whether the original image is downloaded or not.
In addition to the main findings, our research revealed that the accuracy of nighttime light data is affected by cloud cover and other environmental factors. Despite employing advanced cloud removal techniques, some areas still exhibited trends of inaccurate predictions. This finding is consistent with previous research that highlights the impact of cloud cover on nighttime remote sensing data. We recommend further exploration into improving cloud removal techniques in future studies to enhance the quality of nighttime light data.
The limitations of this study primarily relate to the representativeness of the model, the sample size, and environmental differences. While our model performed well across various dis- tricts in Shanghai, since it is hard to get population data in other regions, its applicability has yet to be validated on a broader scale. Additionally, the size of the sample may influence the model’s generalizability, especially when comparing different cities or regions. Environmental
limitations could also impact the result of experiments, the simulation system on the ground cannot fully simulate the space environment, and we cannot get the actual energy management and computing power changes of our system and analyze them.
6. Conclusion
In this paper, we create a system called LuminPop to detect real-time population, which is a collaborative satellite-ground system that can not only monitor real-time population precisely but also efficiently occupy scarce satellite computing resources. Based on NPP-VIIRS nighttime light data, we create a model that relates the population with the night light index. Muti-layer cloud removal technique and masking technique are used in our system to help deal with images. Experiments and comparisons reveal our system is effective in that it only has a 5.6% average error of the actual population. In the future, we will apply our system to more regions and countries that can enhance real-time population detection, and then assist the governments in responding to emergencies in urban areas or distributing supplies.
References
[1]. Mingxing Chen, Weidong Liu, and Xiaoli Tao. Evolution and assessment on china’s urbaniza- tion 1960–2010: Under-urbanization or over-urbanization? Habitat International, 38: 25–33, 2013.
[2]. Abby Liu and Geoffrey Wall. Human resources development in china. Annals of Tourism Research, 32(3): 689–710, 2005.
[3]. Daniel Hoornweg and Kevin Pope. Population predictions for the world ’s largest cities in the 21st century. Environment and urbanization, 29(1): 195–216, 2017.
[4]. Caleb Robinson, Fred Hohman, and Bistra Dilkina. A deep learning approach for population estimation from satellite imagery. In Proceedings of the 1st ACM SIGSPATIAL Workshop on Geospatial Humanities, pages 47–54, 2017.
[5]. Bernard Baffour and Paolo Valente. An evaluation of census quality. Statistical Journal of the IAOS, 28(3-4): 121–135, 2012.
[6]. William Brass. Perspectives in population prediction: Illustrated by the statistics of england and wales. Journal of the Royal Statistical Society Series A: Statistics in Society, 137(4): 532– 570, 1974.
[7]. Adam Van Etten. You only look twice: Rapid multi-scale object detection in satellite imagery. arXiv preprint arXiv: 1805.09512, 2018.
[8]. Harsh Desai and Brandon Lucia. A power-aware heterogeneous architecture scaling model for energy-harvesting computers. IEEE Computer Architecture Letters, 19(1): 68–71, 2020.
[9]. Shangguang Wang, Qing Li, Mengwei Xu, Xiao Ma, Ao Zhou, and Qibo Sun. Tiansuan constellation: An open research platform. In 2021 IEEE International Conference on Edge Computing (EDGE), pages 94–101. IEEE, 2021.
[10]. Jianyin Miao, Qi Zhong, Qiwei Zhao, Xin Zhao, Jianyin Miao, Qi Zhong, Qiwei Zhao, and Xin Zhao. Design of spacecraft thermal control subsystem. Spacecraft Thermal Control Technologies, pages 45–64, 2021.
[11]. Sumitaka Tachikawa, Hosei Nagano, Akira Ohnishi, and Yuji Nagasaka. Advanced passive thermal control materials and devices for spacecraft: a review. International Journal of Thermophysics, 43(6): 91, 2022.
[12]. Vaclav Knap, Lars Kjeldgaard Vestergaard, and Daniel-Ioan Stroe. A review of battery technology in cubesats and small satellite solutions. Energies, 13(16): 4097, 2020.
[13]. Mark White. Commercial off-the-shelf (cots) parts risk and reliability user and application guide. Technical report, 2017.
[14]. Bradley Denby and Brandon Lucia. Orbital edge computing: Nanosatellite constellations as a new class of computer system. In Proceedings of the Twenty-Fifth International Conference on Architectural Support for Programming Languages and Operating Systems, pages 939–954, 2020.
[15]. Sonja Caldwell. State-of-the-art of small spacecraft technology. NASA: Washington, DC, USA, 2021.
[16]. Qiyang Zhang, Xin Yuan, Ruolin Xing, Yiran Zhang, Zimu Zheng, Xiao Ma, Mengwei Xu, Schahram Dustdar, and Shangguang Wang. Resource-efficient in-orbit detection of earth objects. arXiv preprint arXiv: 2402.01675, 2024.
[17]. Tunga S Bastola and Radha Krishna GC. A perspective on population census 2001. Central Bureau of Statistics (ed) Population Monograph of Nepal, 1: 1–27, 2003.
[18]. Yuhao Lu and Nicholas C Coops. Bright lights, big city: Causal effects of population and gdp on urban brightness. PloS one, 13(7): e0199545, 2018.
[19]. Patrick MacAlpine and Peter Stone. Overlapping layered learning. Artificial Intelligence, 254: 21–43, 2018.
[20]. Bu-Yo Kim, Joo Wan Cha, and Ki-Ho Chang. Twenty-four-hour cloud cover calculation using a ground-based imager with machine learning. Atmospheric Measurement Techniques, 14(10): 6695–6710, 2021.
[21]. Jian Li, Kaiping Xue, David SL Wei, Jianqing Liu, and Yongdong Zhang. Energy efficiency and traffic offloading optimization in integrated satellite/terrestrial radio access networks. IEEE Transactions on Wireless Communications, 19(4): 2367–2381, 2020.
[22]. Li Xiang, Chen Zhenjie, Wu Jiexuan, Wang Wenxiang, Qu Le 'an, Zhou Chen, and Han Xiaofeng. Research on the Griding Method of Urban Permanent Resident Population Based on Nighttime Light Data and Spatial Regression Model. Journal of Earth Information Science, 19(10): 1298-1305, 2017.
[23]. Tang Yahui, Zhou Yuquan, CAI Miao, and Ma Xirong. Research on Global Cloud Distribution Characteristics Based on Joint Observations of cloudsat and calipso. Journal of Atmospheric Sciences, 43(05): 917-931, 2020 [24]. World Ebook Library. National bureau of statistics of china. 2005.
[24]. World Ebook Library. National bureau of statistics of china. 2005.
[25]. Jeffrey D Brawn and Scott K Robinson. Source-sink population dynamics may complicate the interpretation of long-term census data. Ecology, 77(1): 3–12, 1996.
[26]. Noam Levin and Qingling Zhang. A global analysis of factors controlling viirs nighttime light levels from densely populated areas. Remote sensing of environment, 190: 366–382, 2017.
Cite this article
Zhang,Q. (2025). LuminPop: A Real-Time Satellite-Ground Collaborative System for Population Detection Based on Nighttime Imagery. Applied and Computational Engineering,164,102-116.
Data availability
The datasets used and/or analyzed during the current study will be available from the authors upon reasonable request.
Disclaimer/Publisher's Note
The statements, opinions and data contained in all publications are solely those of the individual author(s) and contributor(s) and not of EWA Publishing and/or the editor(s). EWA Publishing and/or the editor(s) disclaim responsibility for any injury to people or property resulting from any ideas, methods, instructions or products referred to in the content.
About volume
Volume title: Proceedings of CONF-CDS 2025 Symposium: Data Visualization Methods for Evaluation
© 2024 by the author(s). Licensee EWA Publishing, Oxford, UK. This article is an open access article distributed under the terms and
conditions of the Creative Commons Attribution (CC BY) license. Authors who
publish this series agree to the following terms:
1. Authors retain copyright and grant the series right of first publication with the work simultaneously licensed under a Creative Commons
Attribution License that allows others to share the work with an acknowledgment of the work's authorship and initial publication in this
series.
2. Authors are able to enter into separate, additional contractual arrangements for the non-exclusive distribution of the series's published
version of the work (e.g., post it to an institutional repository or publish it in a book), with an acknowledgment of its initial
publication in this series.
3. Authors are permitted and encouraged to post their work online (e.g., in institutional repositories or on their website) prior to and
during the submission process, as it can lead to productive exchanges, as well as earlier and greater citation of published work (See
Open access policy for details).
References
[1]. Mingxing Chen, Weidong Liu, and Xiaoli Tao. Evolution and assessment on china’s urbaniza- tion 1960–2010: Under-urbanization or over-urbanization? Habitat International, 38: 25–33, 2013.
[2]. Abby Liu and Geoffrey Wall. Human resources development in china. Annals of Tourism Research, 32(3): 689–710, 2005.
[3]. Daniel Hoornweg and Kevin Pope. Population predictions for the world ’s largest cities in the 21st century. Environment and urbanization, 29(1): 195–216, 2017.
[4]. Caleb Robinson, Fred Hohman, and Bistra Dilkina. A deep learning approach for population estimation from satellite imagery. In Proceedings of the 1st ACM SIGSPATIAL Workshop on Geospatial Humanities, pages 47–54, 2017.
[5]. Bernard Baffour and Paolo Valente. An evaluation of census quality. Statistical Journal of the IAOS, 28(3-4): 121–135, 2012.
[6]. William Brass. Perspectives in population prediction: Illustrated by the statistics of england and wales. Journal of the Royal Statistical Society Series A: Statistics in Society, 137(4): 532– 570, 1974.
[7]. Adam Van Etten. You only look twice: Rapid multi-scale object detection in satellite imagery. arXiv preprint arXiv: 1805.09512, 2018.
[8]. Harsh Desai and Brandon Lucia. A power-aware heterogeneous architecture scaling model for energy-harvesting computers. IEEE Computer Architecture Letters, 19(1): 68–71, 2020.
[9]. Shangguang Wang, Qing Li, Mengwei Xu, Xiao Ma, Ao Zhou, and Qibo Sun. Tiansuan constellation: An open research platform. In 2021 IEEE International Conference on Edge Computing (EDGE), pages 94–101. IEEE, 2021.
[10]. Jianyin Miao, Qi Zhong, Qiwei Zhao, Xin Zhao, Jianyin Miao, Qi Zhong, Qiwei Zhao, and Xin Zhao. Design of spacecraft thermal control subsystem. Spacecraft Thermal Control Technologies, pages 45–64, 2021.
[11]. Sumitaka Tachikawa, Hosei Nagano, Akira Ohnishi, and Yuji Nagasaka. Advanced passive thermal control materials and devices for spacecraft: a review. International Journal of Thermophysics, 43(6): 91, 2022.
[12]. Vaclav Knap, Lars Kjeldgaard Vestergaard, and Daniel-Ioan Stroe. A review of battery technology in cubesats and small satellite solutions. Energies, 13(16): 4097, 2020.
[13]. Mark White. Commercial off-the-shelf (cots) parts risk and reliability user and application guide. Technical report, 2017.
[14]. Bradley Denby and Brandon Lucia. Orbital edge computing: Nanosatellite constellations as a new class of computer system. In Proceedings of the Twenty-Fifth International Conference on Architectural Support for Programming Languages and Operating Systems, pages 939–954, 2020.
[15]. Sonja Caldwell. State-of-the-art of small spacecraft technology. NASA: Washington, DC, USA, 2021.
[16]. Qiyang Zhang, Xin Yuan, Ruolin Xing, Yiran Zhang, Zimu Zheng, Xiao Ma, Mengwei Xu, Schahram Dustdar, and Shangguang Wang. Resource-efficient in-orbit detection of earth objects. arXiv preprint arXiv: 2402.01675, 2024.
[17]. Tunga S Bastola and Radha Krishna GC. A perspective on population census 2001. Central Bureau of Statistics (ed) Population Monograph of Nepal, 1: 1–27, 2003.
[18]. Yuhao Lu and Nicholas C Coops. Bright lights, big city: Causal effects of population and gdp on urban brightness. PloS one, 13(7): e0199545, 2018.
[19]. Patrick MacAlpine and Peter Stone. Overlapping layered learning. Artificial Intelligence, 254: 21–43, 2018.
[20]. Bu-Yo Kim, Joo Wan Cha, and Ki-Ho Chang. Twenty-four-hour cloud cover calculation using a ground-based imager with machine learning. Atmospheric Measurement Techniques, 14(10): 6695–6710, 2021.
[21]. Jian Li, Kaiping Xue, David SL Wei, Jianqing Liu, and Yongdong Zhang. Energy efficiency and traffic offloading optimization in integrated satellite/terrestrial radio access networks. IEEE Transactions on Wireless Communications, 19(4): 2367–2381, 2020.
[22]. Li Xiang, Chen Zhenjie, Wu Jiexuan, Wang Wenxiang, Qu Le 'an, Zhou Chen, and Han Xiaofeng. Research on the Griding Method of Urban Permanent Resident Population Based on Nighttime Light Data and Spatial Regression Model. Journal of Earth Information Science, 19(10): 1298-1305, 2017.
[23]. Tang Yahui, Zhou Yuquan, CAI Miao, and Ma Xirong. Research on Global Cloud Distribution Characteristics Based on Joint Observations of cloudsat and calipso. Journal of Atmospheric Sciences, 43(05): 917-931, 2020 [24]. World Ebook Library. National bureau of statistics of china. 2005.
[24]. World Ebook Library. National bureau of statistics of china. 2005.
[25]. Jeffrey D Brawn and Scott K Robinson. Source-sink population dynamics may complicate the interpretation of long-term census data. Ecology, 77(1): 3–12, 1996.
[26]. Noam Levin and Qingling Zhang. A global analysis of factors controlling viirs nighttime light levels from densely populated areas. Remote sensing of environment, 190: 366–382, 2017.


