


1. Introduction
Electricity is a foundational component of urban infrastructure, and demand for it varies not only over time but also across space. In New York City (NYC), demographic diversity, infrastructure age, and economic disparity all contribute to highly uneven energy usage patterns. While utility providers may forecast demand at an aggregate level, understanding localized patterns is essential for designing equitable policies and investment strategies.
The application of machine learning (ML) to electricity demand forecasting has gained significant momentum in recent years. Traditional time series models such as ARIMA and Holt-Winters have been widely used but often struggle with nonlinearities and seasonal shifts in urban electricity use [1]. More recent work leverages ML techniques—Random Forest, Gradient Boosting Machines (GBMs), and neural networks—to capture complex temporal and contextual dependencies [2,3]. XGBoost, in particular, has shown excellent performance in short-term load forecasting across spatial units [4].
The Prophet model, developed by Facebook, offers a flexible and interpretable approach to time series forecasting with strong performance on daily and monthly load data [5]. Its robustness to missing data and seasonal decomposition makes it well-suited for public-sector energy data, yet few urban studies apply Prophet to disaggregated spatial units like boroughs or neighborhoods.
On the spatial side, equity in energy modeling remains under-addressed. The field of energy justice has emphasized uneven energy burdens across racial and economic lines [6], but most predictive modeling research focuses on accuracy, not fairness. A few recent works explore model residuals as a fairness diagnostic [7,8], suggesting that patterns of over-or underestimation can reveal systemic underrepresentation of marginalized communities. However, these ideas are rarely operationalized in large-scale urban load modeling.
There is also a gap in applying classification models to identify high-demand areas, which could assist in infrastructure prioritization. While some studies on urban microgrids use clustering and regression methods to model electricity demand [9], classification models—especially interpretable ones like Random Forest—can offer a practical tool for urban planners when geographic targeting is required.
This study contributes to the literature by combining multiple ML techniques—classification, regression, and time series forecasting—to evaluate spatial patterns of electricity use in New York City. Most importantly, it integrates spatial fairness metrics such as Gini coefficients and residual mapping into standard ML workflows, offering a reproducible framework for auditing predictive equity in real-world urban contexts.
Specifically, are certain areas systematically under- or overestimated by standard predictive tools? Do future demand forecasts align with historical patterns of under-service?
2. Methodology
2.1. Data sources
This study integrates multiple publicly available datasets to model electricity consumption and assess spatial inequities across New York City's five boroughs.
First, the NYCHA Electricity Consumption Dataset (2021–2024) provides monthly utility billing information for public housing developments throughout NYC. Key variables include the service start date, which marks the beginning of each billing period; the borough in which the development is located (covering all five NYC boroughs); the development name, serving as a unique site identifier mapped to the Neighborhood Tabulation Area (NTA); and electricity usage, measured in kilowatt-hours (KWH) per meter.
Second, the NYC Neighborhood Tabulation Area (NTA) Shapefile (2020) offers detailed geographic boundary definitions for each NTA. Each polygon includes descriptive attributes such as the borough name (BoroName) and the neighborhood tabulation area name (NTAName), which are used for spatial joins and geographic visualization. Third, the NYISO Hourly Temperature Dataset (2021–2024) provides hourly temperature readings from the JFK station. These values were aggregated into monthly averages to align temporally with the energy consumption data.
Finally, the Prophet Forecast Output includes borough-level predictions based on log-transformed monthly KWH values from 2021 to early 2025. Prophet models were trained separately for each borough and used to forecast monthly electricity usage for the following 12-month period.
2.2. Data preprocessing
The preprocessing involved several structured steps to prepare the data for modeling and analysis. First, electricity records were filtered to include only entries from January 2021 to December 2024, based on the service start date. Non-numeric and missing consumption values were removed to ensure data integrity. The remaining records were grouped by borough and year-month to generate a monthly aggregated KWH time series. To stabilize variance and normalize the distribution, a logarithmic transformation (log(KWH)) was applied to the consumption values. Next, hourly temperature data was parsed and resampled to compute monthly mean temperatures. These monthly averages were then merged with the energy consumption data using the YearMonth field as the join key, ensuring temporal alignment across datasets. For forecasting purposes, Prophet-compatible datasets were constructed, containing ds as the monthly timestamp (derived from YearMonth) and y as the log-transformed consumption (log_kwh). Separate Prophet models were trained for each borough, generating monthly electricity consumption forecasts that extended 12 months into the future, through 2025. Finally, energy consumption values and/or forecast residuals were spatially joined with the NTA shapefile using the BoroName and/or NTAName fields. This enabled spatial visualization of both electricity usage and model residuals, providing a basis for evaluating geographic fairness in forecast accuracy.
2.3. Feature engineering
Given the available data, this study focused on two key temporal features. The first is YearMonth, which was extracted from the service start date and used as the aggregation unit for monthly electricity consumption. The second is temperature, derived from NYISO’s hourly readings, which were aggregated into monthly averages and joined to the electricity data by borough and month. To address the scale of consumption data and improve model performance, a logarithmic transformation was applied to the total KWH values, resulting in the creation of a Log_KWH column. This transformation helped normalize the distribution and reduce the influence of extreme values.
2.4. Predictive modeling
2.4.1. Time series forecasting with prophet
For each of the five NYC boroughs, monthly electricity consumption data from 2021 to 2024 was modeled using the Prophet framework. This method allows flexible modeling of seasonal trends and incorporates holiday effects if available.
The Prophet models were trained on Log_KWH values using YearMonth as the date column. A 12-month forecast was generated for each borough, covering the entirety of 2025.
The model outputs included predicted values (yhat) and uncertainty intervals (yhat_lower, yhat_upper). The forecasts were used for two further analyses, computing borough-level growth rates from 2024 to 2025 and assessing seasonal fluctuations in energy usage.
2.4.2. Machine learning regression with XGBoost
To further assess spatial patterns in electricity demand, this study implemented an XGBoost regression model using the following features: Month (numerical month extracted from YearMonth); Temperature (monthly average temperature).
The target variable was Log_KWH. A separate model was trained per borough to capture localized consumption dynamics. Model performance was evaluated using Root Mean Squared Error (RMSE) and R-squared (R²) scores on a held-out test set (typically from 2024). Residual analysis was performed to identify under- or over-predicted months, which may indicate latent structural inequities.
3. Results
3.1. Citywide load forecasting performance
To evaluate the accuracy of electricity demand forecasting, three models were tested with different feature configurations: a baseline using lagged consumption, a temporal feature-only model and a weather-augmented model.
As shown in Table 1, the baseline model produced an RMSE of 214.53 and MAE of 165.88, while incorporating temporal features alone significantly improved performance (RMSE = 66.97, MAE = 45.11). The final model that incorporated temperature features achieved the best performance with an RMSE of 63.47 and MAE of 42.59, corresponding to an R² of 0.9975.
|
Model Type |
RMSE |
MAE |
R² |
|
Lagged Consumption Only |
214.53 |
165.88 |
0.9711 |
|
Temporal Features Only |
66.97 |
45.11 |
0.9972 |
|
+Temperature Features |
63.47 |
42.59 |
0.9975 |
Figure 1 demonstrates that the weather-augmented model produces highly accurate short-term forecasts. The predicted load (orange dashed line) closely follows the actual load (blue solid line) across multiple daily cycles. Peak loads around 6,500 MW and troughs near 4,000 MW are captured with minimal lag. This aligns with the quantitative results reported in Table 1, where the model achieves an RMSE of 63.47 MW, MAE of 42.59 MW, and an R² of 0.9975, confirming both visual and statistical consistency in the forecast quality.
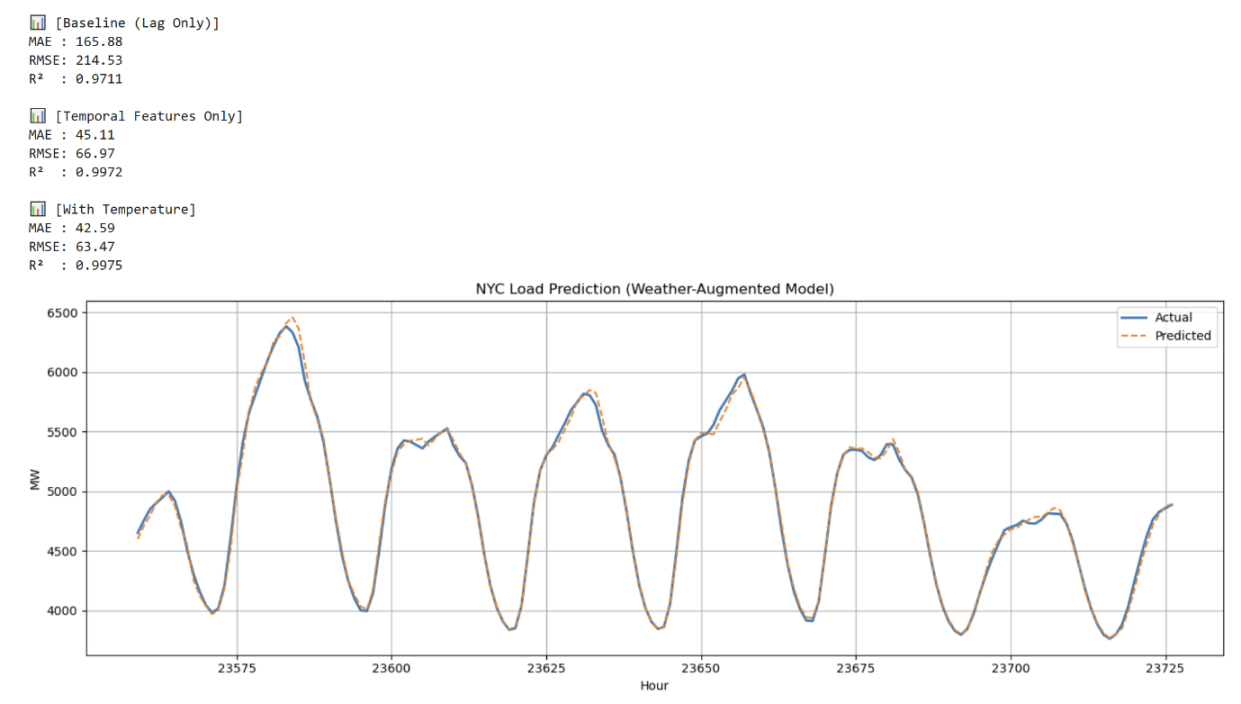
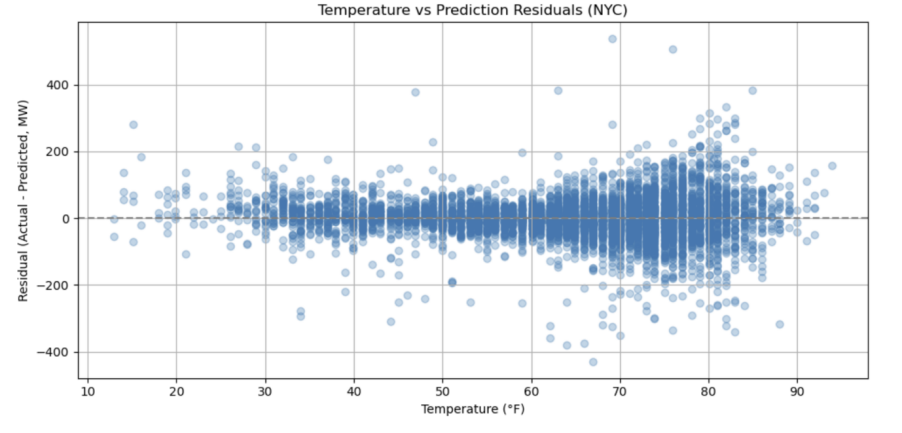
Figure 2 shows that model residuals exhibit clear heteroskedasticity with respect to temperature. In particular, residuals remain mostly within ±100 MW between 40°F and 70°F, but increase substantially outside this range. At temperatures below 30°F or above 80°F, residuals exceed ±300 MW in several cases, with extreme values reaching above +400 MW and below -400 MW. This result indicates a strong link between forecast error and temperature extremes, likely due to unmodeled behavioral or infrastructural responses during peak heating or cooling periods.
3.2. Borough-level electricity forecasts
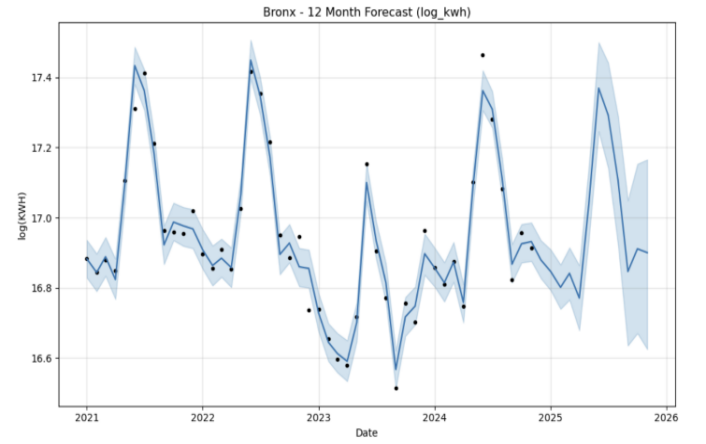
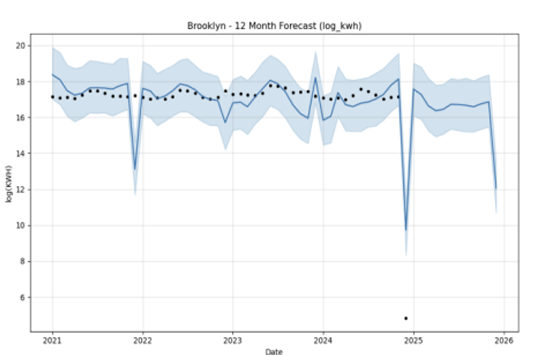
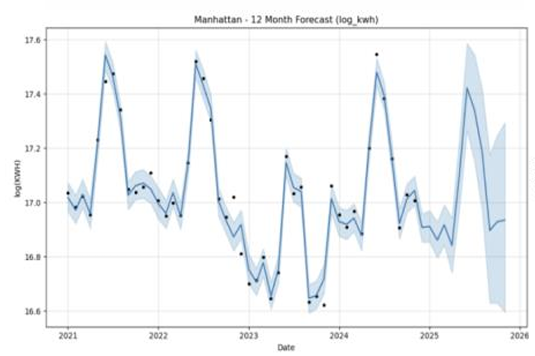
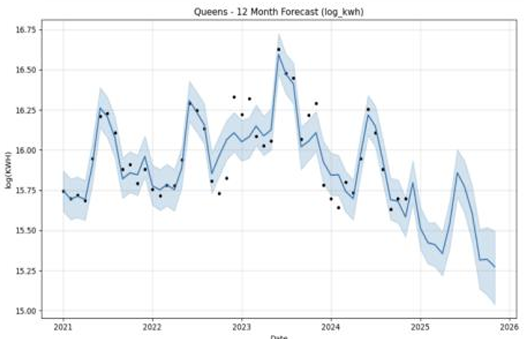
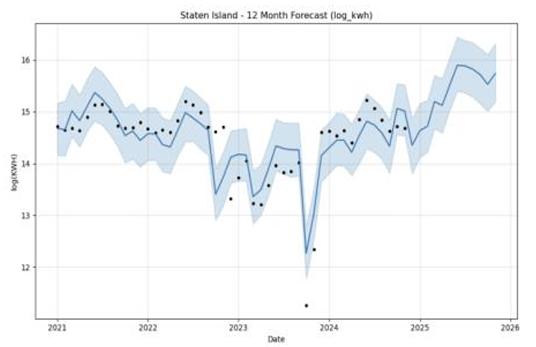
Using Facebook Prophet, electricity consumption was forecasted for each of the five NYC boroughs individually for a 12-month horizon.
Figures 3 to 7 illustrate the forecast trajectories for Bronx, Brooklyn, Manhattan, Queens, and Staten Island respectively. All boroughs exhibit strong seasonal patterns, with summer peaks corresponding to air conditioning usage. Brooklyn displays the most stable and elevated levels of consumption, while Staten Island and Queens show greater inter-annual variability.
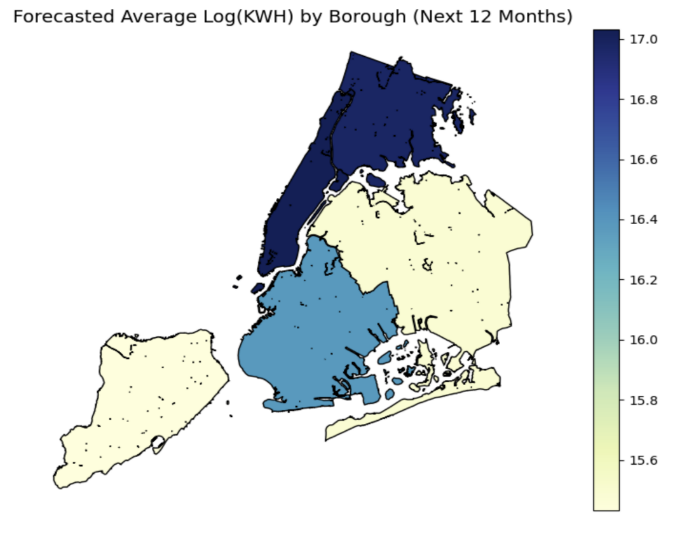
Figure 8 visualizes the spatial distribution of forecasted average log(KWH) values across NYC boroughs. Manhattan exhibits the highest average value (~17.0), followed by Brooklyn (~16.5). Queens and Staten Island fall within the 15.8–16.1 range, while the Bronx records the lowest forecasted value at approximately 15.6. These spatial disparities suggest persistent differences in baseline electricity demand that could reflect underlying variations in infrastructure intensity, population density, or building stock.
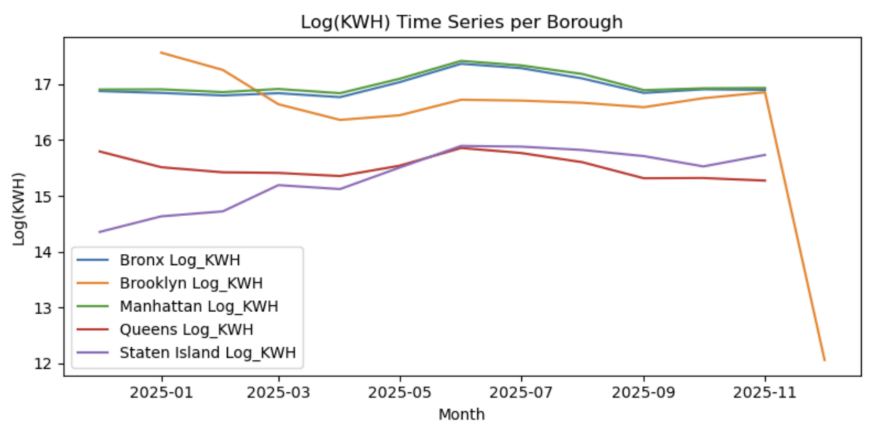
Figure 9 shows the monthly log(KWH) forecasts for each borough over the 2025 horizon. Manhattan consistently remains the top-consuming borough, peaking around 17.2 in July. Brooklyn maintains a relatively stable trend near 16.8, while the Bronx and Queens exhibit lower demand between 15.2 and 15.8. Staten Island shows a gradual rise, reaching ~15.9 in summer months, before all boroughs converge downward toward year-end. These patterns highlight seasonal fluctuations as well as consistent cross-borough consumption hierarchies.
3.3. Temporal trend indicators
Two trend-related metrics were computed across boroughs: growth rate and seasonal profile.Figure 10 visualizes the monthly log(KWH) growth rates. The Bronx and Staten Island display stronger positive growth rates in early 2025, while Brooklyn exhibits a sharp decline toward the end of the forecast window. This may warrant further investigation or model calibration.
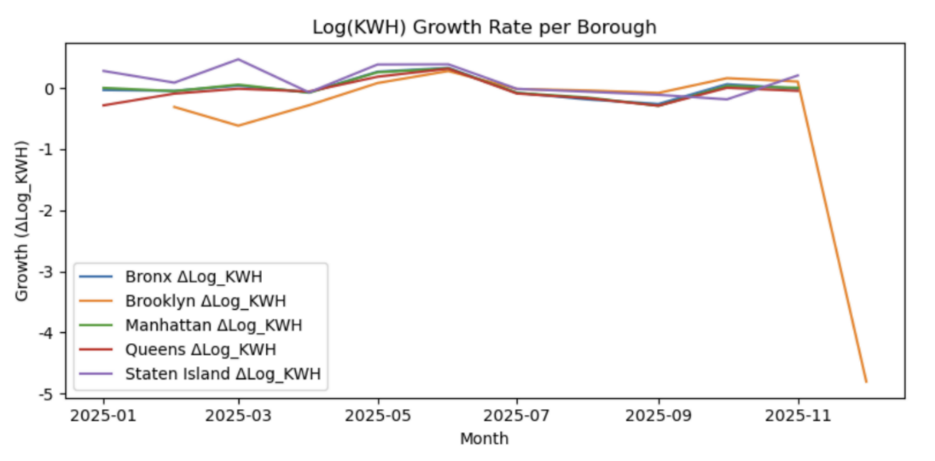
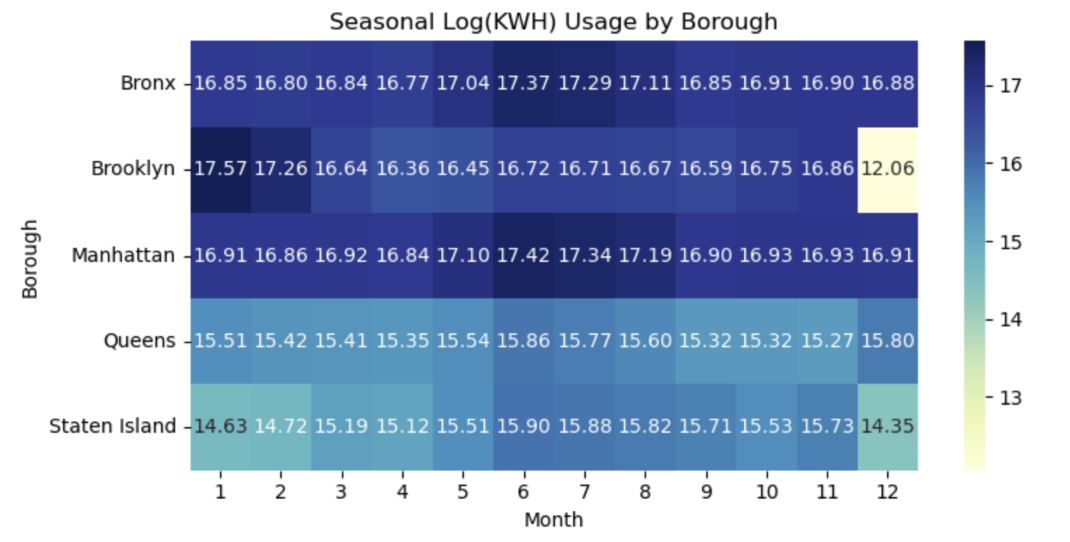
Figure 11 summarizes the seasonal profile of electricity demand using a month-by-borough heatmap. A consistent summer peak is visible across all boroughs, with July showing the highest usage across the board. Staten Island shows the most pronounced seasonal amplitude, likely due to higher sensitivity to residential HVAC demand.
3.4. Equity assessment of forecasted consumption
To assess spatial disparities in energy demand, this study computed the Gini coefficient of forecasted consumption.
As a reference baseline, Figure 12 visualizes borough-level average electricity usage from 2021 to 2024, which underpins the spatial inequality patterns observed.
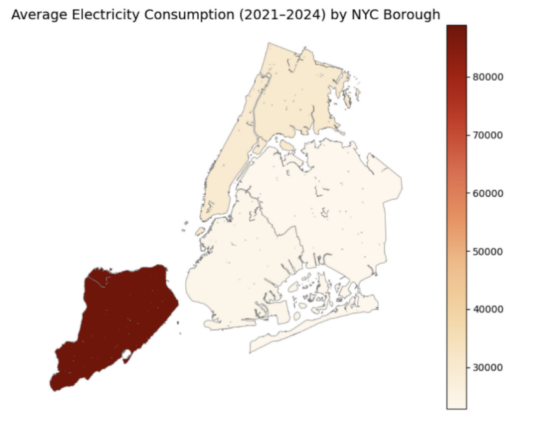
The Gini index for borough-level electricity usage in the forecast period is 0.2835, indicating moderate inequality in spatial distribution.
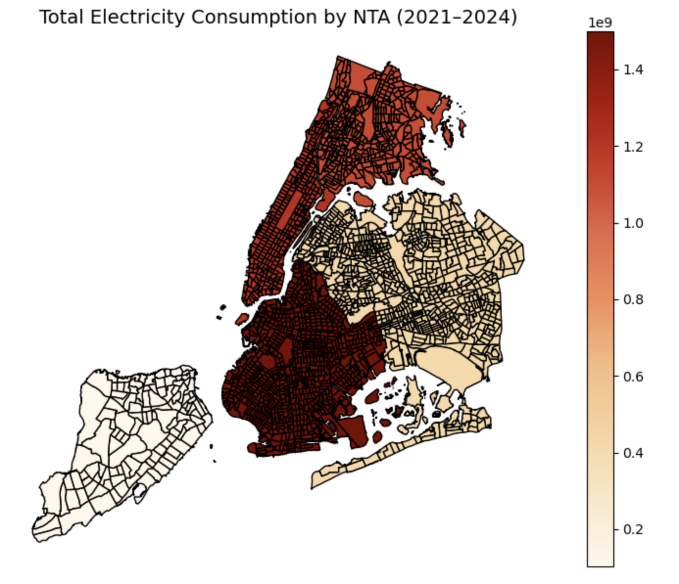
Additionally, Figure 13 shows the total forecasted consumption at the Neighborhood Tabulation Area (NTA) level. Higher energy usage is observed in northern Brooklyn and southern Queens, reflecting both population density and built environment characteristics.
Figure 14 compares the performance of three machine learning models—Random Forest, XGBoost, and SVM—on borough-level electricity prediction tasks. All models show poor fit, with R² scores of -0.03 (XGBoost), -0.04 (Random Forest), and -0.19 (SVM). Corresponding RMSE values are 38.6 million, 38.7 million, and 41.5 million, respectively. The uniformly negative R² scores indicate that these models performed worse than a simple mean predictor, underscoring the limitations of using only temporal and temperature features at coarse spatial scales. This finding reinforces the relative strength of the weather-augmented Prophet model, which achieved R² > 0.99 at the city-wide level.

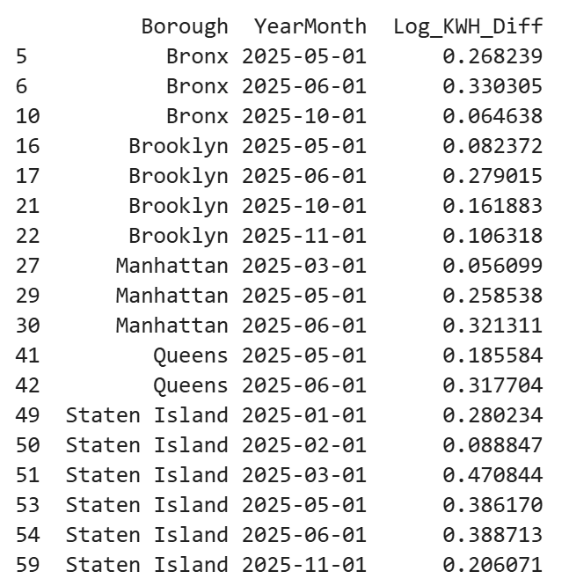
Finally, Figure 15 identifies borough-month pairs where forecasted values substantially under-estimate observed values. These discrepancies can help prioritize neighborhoods for more granular monitoring or equity-aware resource allocation strategies.
4. Discussion
This study demonstrates the utility of machine learning models in understanding spatial and temporal disparities in electricity consumption across New York City (NYC). Using only temporal variables and temperature as inputs, these models—particularly the weather-augmented XGBoost and Prophet—achieved high predictive performance for both hourly city-wide load and monthly borough-level usage. The low MAE and RMSE, alongside high R² values (up to 0.9975), reflect the importance of seasonal and climatic signals in shaping electricity demand patterns.
Residual analysis revealed a systematic underestimation of demand during extreme temperature periods, indicating that model accuracy decreases during peak load conditions—likely due to unobserved behavioral or socioeconomic responses not captured by temperature alone. This suggests the potential value of incorporating external variables such as building characteristics or socioeconomic indicators in future work, although the present analysis intentionally avoids such feature expansion.
The borough-level forecasts reveal meaningful spatial heterogeneity. For instance, Staten Island shows a steady upward trend in log (KWH) consumption, while Brooklyn exhibits erratic fluctuations. Spatial visualizations further highlight the unequal burden of energy consumption, with Gini coefficients indicating moderate spatial inequality. Notably, some high-use areas, such as northern Manhattan and parts of Brooklyn, are predicted to continue exhibiting elevated consumption in the future. This raises potential concerns about sustainability and resource targeting.
Furthermore, temporal growth rate analysis reveals acceleration in some boroughs (e.g., Staten Island), while others show stagnation or even declines. These insights point to diverging trajectories in energy demand that warrant further investigation, particularly in relation to urban development and infrastructure changes.
Despite robust methodological design, these models have several limitations. Most critically, the exclusion of non-temporal features—though intentional—limits explanatory richness. Additionally, the Prophet model assumes continuity and stationarity that may not fully capture structural shocks or long-term behavioral shifts. The spatial resolution was constrained to borough and NTA levels due to data availability, limiting granularity.
5. Conclusion
This research provides a data-driven framework for forecasting and analyzing spatial inequities in urban electricity demand. By applying machine learning models to NYC electricity consumption data, this study uncovered both temporal dynamics and geographic disparities in usage patterns. High predictive accuracy was achieved using only lagged demand, calendar variables, and temperature, underscoring the predictive strength of time and weather in energy forecasting.
These results reveal not only cyclical seasonal demand but also diverging borough-level consumption trajectories, suggesting varying levels of energy resilience and resource strain across communities. The geographic inequality—quantified through choropleth maps and Gini analysis—emphasizes the importance of spatial justice in future energy planning.
Moving forward, this framework could inform urban policy by identifying high-risk, high-consumption areas that may benefit from targeted interventions. While this study refrained from adding complex feature engineering, future research could explore the inclusion of socioeconomic and infrastructural data to refine model interpretability and policy relevance.
References
[1]. Fan, S., & Hyndman, R. J. (2012). Short-term load forecasting based on a semi-parametric additive model. IEEE Transactions on Power Systems, 27(1), 134–141. https: //doi.org/10.1109/TPWRS.2011.2158559
[2]. Deb, C., Zhang, F., Yang, J., Lee, S. E., & Shah, K. W. (2017). A review on time series forecasting techniques for building energy consumption. Renewable and Sustainable Energy Reviews, 74, 902–924. https: //doi.org/10.1016/j.rser.2017.02.085
[3]. Kong, W., Dong, Z. Y., Jia, Y., Hill, D. J., Xu, Y., & Zhang, Y. (2019). Short-term residential load forecasting based on LSTM recurrent neural network. IEEE Transactions on Smart Grid, 10(1), 841–851. https: //doi.org/10.1109/TSG.2017.2753802
[4]. Taieb, S. B., & Hyndman, R. J. (2014). A gradient boosting approach to the Kaggle load forecasting competition. International Journal of Forecasting, 30(2), 382–394. https: //doi.org/10.1016/j.ijforecast.2014.03.001
[5]. Taylor, S. J., & Letham, B. (2018). Forecasting at scale. The American Statistician, 72(1), 37–45. https: //doi.org/10.1080/00031305.2017.1380080
[6]. Sovacool, B. K., Lipson, M. M., & Chard, R. (2019). Temporality, vulnerability, and energy justice in household low carbon innovations. Energy Policy, 128, 495–504. https: //doi.org/10.1016/j.enpol.2019.01.010
[7]. Binns, R., Veale, M., Van Kleek, M., & Shadbolt, N. (2018). ‘It's reducing a human being to a percentage’: Perceptions of justice in algorithmic decisions. Proceedings of the 2018 CHI Conference on Human Factors in Computing Systems, 1–14. https: //doi.org/10.1145/3173574.3173951
[8]. Kearns, M., Neel, S., Roth, A., & Wu, Z. S. (2019). An empirical study of rich subgroup fairness for machine learning. Proceedings of the Conference on Fairness, Accountability, and Transparency, 100–109. https: //doi.org/10.1145/3287560.3287592
[9]. Rao, S. N. B., Yellapragada, V., Padma, K., Pradeep, D. J., Reddy, C. P., Amir, M., & Refaat, S. (2022). Day-ahead load demand forecasting in urban community cluster microgrids using machine learning methods. Energies, 15(17), 6124. https: //doi.org/10.3390/en15176124
Cite this article
Xu,Z. (2025). Modeling Urban Electricity Demand and Spatial Fairness Using Machine Learning: Evidence from New York City. Applied and Computational Engineering,179,56-67.
Data availability
The datasets used and/or analyzed during the current study will be available from the authors upon reasonable request.
Disclaimer/Publisher's Note
The statements, opinions and data contained in all publications are solely those of the individual author(s) and contributor(s) and not of EWA Publishing and/or the editor(s). EWA Publishing and/or the editor(s) disclaim responsibility for any injury to people or property resulting from any ideas, methods, instructions or products referred to in the content.
About volume
Volume title: Proceedings of CONF-MLA 2025 Symposium: Intelligent Systems and Automation: AI Models, IoT, and Robotic Algorithms
© 2024 by the author(s). Licensee EWA Publishing, Oxford, UK. This article is an open access article distributed under the terms and
conditions of the Creative Commons Attribution (CC BY) license. Authors who
publish this series agree to the following terms:
1. Authors retain copyright and grant the series right of first publication with the work simultaneously licensed under a Creative Commons
Attribution License that allows others to share the work with an acknowledgment of the work's authorship and initial publication in this
series.
2. Authors are able to enter into separate, additional contractual arrangements for the non-exclusive distribution of the series's published
version of the work (e.g., post it to an institutional repository or publish it in a book), with an acknowledgment of its initial
publication in this series.
3. Authors are permitted and encouraged to post their work online (e.g., in institutional repositories or on their website) prior to and
during the submission process, as it can lead to productive exchanges, as well as earlier and greater citation of published work (See
Open access policy for details).
References
[1]. Fan, S., & Hyndman, R. J. (2012). Short-term load forecasting based on a semi-parametric additive model. IEEE Transactions on Power Systems, 27(1), 134–141. https: //doi.org/10.1109/TPWRS.2011.2158559
[2]. Deb, C., Zhang, F., Yang, J., Lee, S. E., & Shah, K. W. (2017). A review on time series forecasting techniques for building energy consumption. Renewable and Sustainable Energy Reviews, 74, 902–924. https: //doi.org/10.1016/j.rser.2017.02.085
[3]. Kong, W., Dong, Z. Y., Jia, Y., Hill, D. J., Xu, Y., & Zhang, Y. (2019). Short-term residential load forecasting based on LSTM recurrent neural network. IEEE Transactions on Smart Grid, 10(1), 841–851. https: //doi.org/10.1109/TSG.2017.2753802
[4]. Taieb, S. B., & Hyndman, R. J. (2014). A gradient boosting approach to the Kaggle load forecasting competition. International Journal of Forecasting, 30(2), 382–394. https: //doi.org/10.1016/j.ijforecast.2014.03.001
[5]. Taylor, S. J., & Letham, B. (2018). Forecasting at scale. The American Statistician, 72(1), 37–45. https: //doi.org/10.1080/00031305.2017.1380080
[6]. Sovacool, B. K., Lipson, M. M., & Chard, R. (2019). Temporality, vulnerability, and energy justice in household low carbon innovations. Energy Policy, 128, 495–504. https: //doi.org/10.1016/j.enpol.2019.01.010
[7]. Binns, R., Veale, M., Van Kleek, M., & Shadbolt, N. (2018). ‘It's reducing a human being to a percentage’: Perceptions of justice in algorithmic decisions. Proceedings of the 2018 CHI Conference on Human Factors in Computing Systems, 1–14. https: //doi.org/10.1145/3173574.3173951
[8]. Kearns, M., Neel, S., Roth, A., & Wu, Z. S. (2019). An empirical study of rich subgroup fairness for machine learning. Proceedings of the Conference on Fairness, Accountability, and Transparency, 100–109. https: //doi.org/10.1145/3287560.3287592
[9]. Rao, S. N. B., Yellapragada, V., Padma, K., Pradeep, D. J., Reddy, C. P., Amir, M., & Refaat, S. (2022). Day-ahead load demand forecasting in urban community cluster microgrids using machine learning methods. Energies, 15(17), 6124. https: //doi.org/10.3390/en15176124