1. Introduction
Improving user-perceived speed is key for 5G mobile operators to retain users, boost competitiveness, reduce complaints, and achieve sustainable growth [1-3]. Wireless indicators like Low-Speed Ratio (K1) and cell throughput, critical for user perception, directly determine network smoothness and stability [4-6].
Regional operators need to deploy vendor A’s licensed, paid feature X to meet assessment metrics but cannot roll it out network-wide due to costs. Typically, temporary authorization allows X deployment across all cells to capture K1 before and after deployment. Existing algorithm 1 selects cells by ranking K1 gains post-X, ignoring inter-cell wireless performance interactions and yielding suboptimal total gains. Algorithm 2 identifies optimal M-cell sets from N authorized cells by calculating K1 gains for all combinations, but its high time complexity hinders quick responses. This paper focuses on feature X, aiming to efficiently select optimal cells for operators. It proposes a cell value scoring-based algorithm, validated against the two existing ones via performance gains, time complexity, and applicability to demonstrate its effectiveness and superiority. It helps operators balance performance and costs under budget constraints, driving industry progress; it offers scalable, referable optimization insights for researchers.
2. An optimal algorithm for feature activation based on cell value scoring
2.1. An optimal algorithm based on cell value scoring
2.1.1. Data sources and indicator definitions
The data used in this algorithm mainly comes from the wireless indicator K1 data collected before and after the deployment of feature X, after vendor A obtained a temporary authorization permit for applying feature X in the cells of a mobile operator in a certain city. Specifically, it includes:
A. Basic information of the cell, such as the cell wireless network identifier and the deployment time point of feature X [7];
B. Wireless indicator data collected before and after the deployment of feature X, mainly including the number of cell users, the number of sample points in the speed distribution interval of the cell uplink Ue Equipment Throughput (i.e., UE Throughput) and the cell downlink UE Throughput [8-10];
C. Uplink Low-Speed threshold (cell uplink UE Throughput <= 2Mbps) and downlink Low-Speed threshold (cell downlink UE Throughput <= 5Mbps);
These data can be obtained through the mobile operator's network management system or the monitoring platform of vendor. The accuracy and integrity of the data are the keys to ensuring the effective operation of the algorithm. This paper takes the wireless assessment indicator K1 = "uplink - downlink Low-Speed Ratio (%)" (hereinafter referred to as the Low-Speed Ratio indicator) of the mobile operator as the optimization target, and carries out a comparative analysis before and after the deployment of the feature algorithm X.
2.1.2. The principle of the optimal algorithm based on cell value scoring
The core principle of the optimal algorithm based on cell value scoring is to comprehensively consider the gain of the wireless indicator K1 after the deployment of feature X in the cell and the contribution of the cell to the overall network performance to determine the value score of the cell. The gain of the wireless indicator K1 reflects the degree of improvement in the performance of the cell itself after the deployment of feature X, while the contribution to the entire network reflects the importance of the cell in the network. By calculating the value score of the cell, it is possible to more comprehensively evaluate the performance of deploying feature X in the cell. Therefore, when selecting a cell for deployment, not only can the selected cell have a good performance improvement, but also the performance of the entire network can be maximally improved.
2.1.3. The process of the optimal algorithm based on cell value scoring
A. Input the number of cells N, KPI indicator K1 of each cell before and after feature deployment
B. Calculate the indicator K1 and its gain
C. For i = 1 to N do:
(1) Exclude cell
(2) Calculate the value score of cell
D. Sort
E. For j = 1 to N do:
Take the first j cells from
F. Return Lists
2.2. Analysis of the results of the optimal algorithm based on cell value scoring
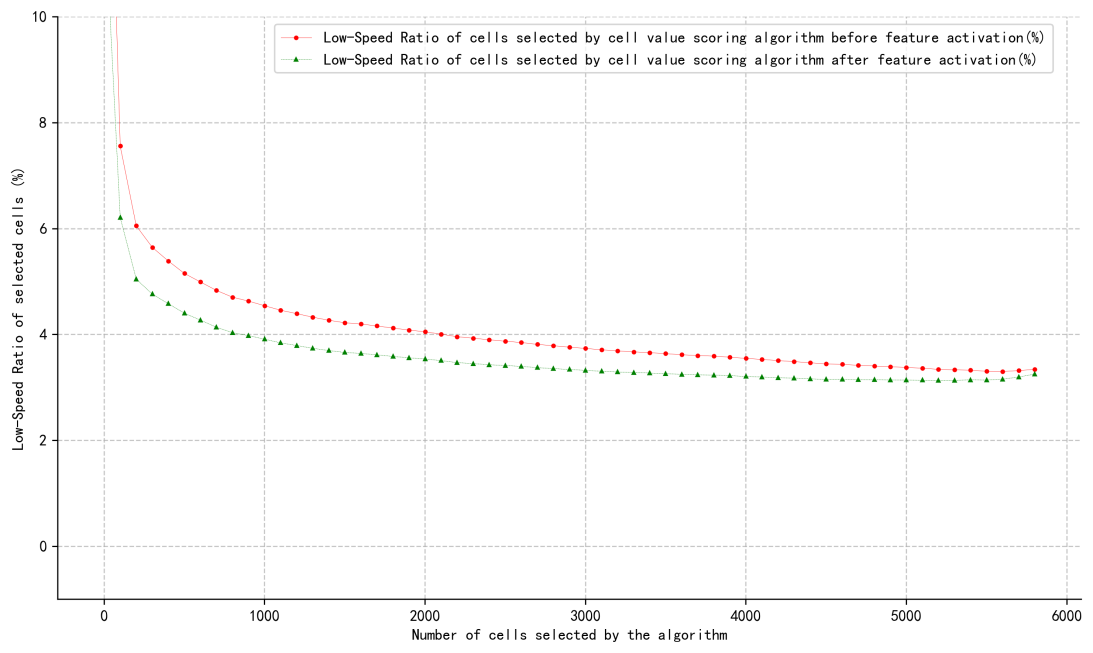
2.2.1. Comparison of the Low-Speed Ratio K1 of the cells selected by this algorithm before and after feature X deployment
Verify the improvement effect of feature X on the Low-Speed performance of cells by comparing the Low-Speed Ratio indicator K1 of cells before and after deploying feature X.

As can be seen from Figure 1, after deploying feature X, regardless of the number of cells selected, the overall Low-Speed Ratio K1 of the selected cells has decreased significantly. This indicates that feature X can effectively decrease the Low-Speed Ratio of cells.
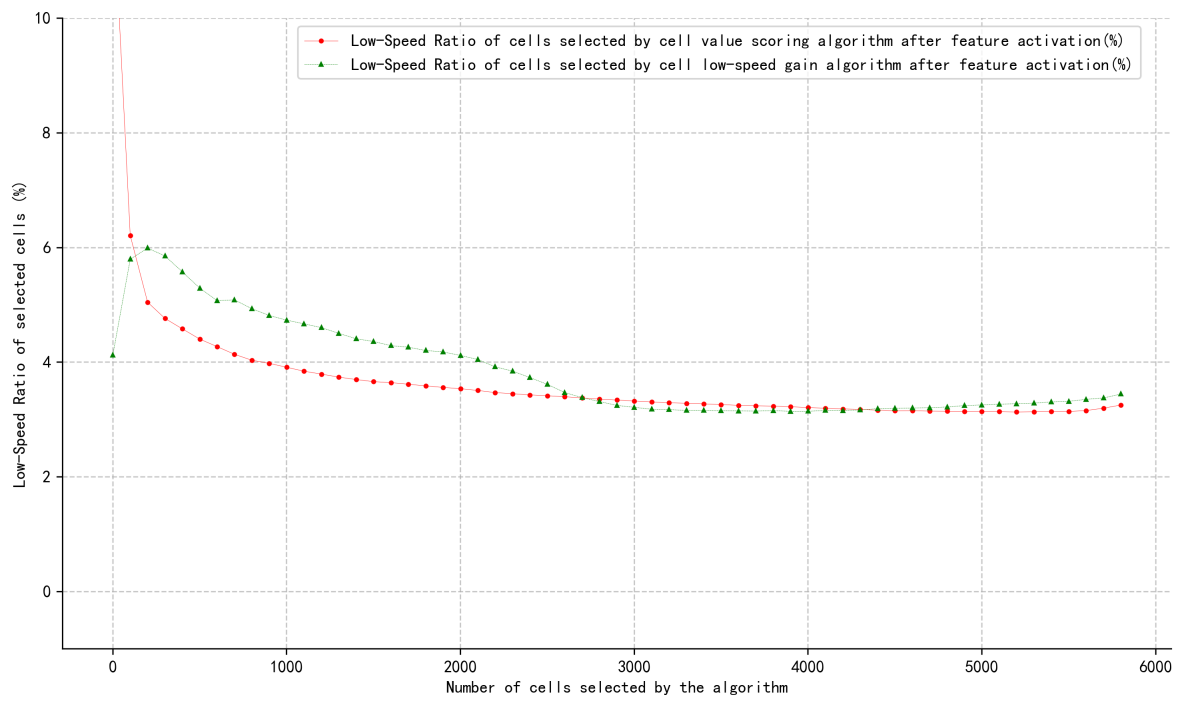
2.2.2. Comparison of Low-Speed Ratio K1 of cells after deployment between this algorithm and conventional algorithm 1
Compare the Low-Speed Ratios K1 of the cells selected by the algorithm in this paper and the conventional algorithm 1 (algorithm based on the Low-Speed Ratio gain of cells) after feature X is enabled.

As can be seen from Figure 2, when the number of deployed cells is the same, in most cases, the Low-Speed Ratio of the cells selected by the algorithm in this paper is lower than that of conventional algorithm 1.
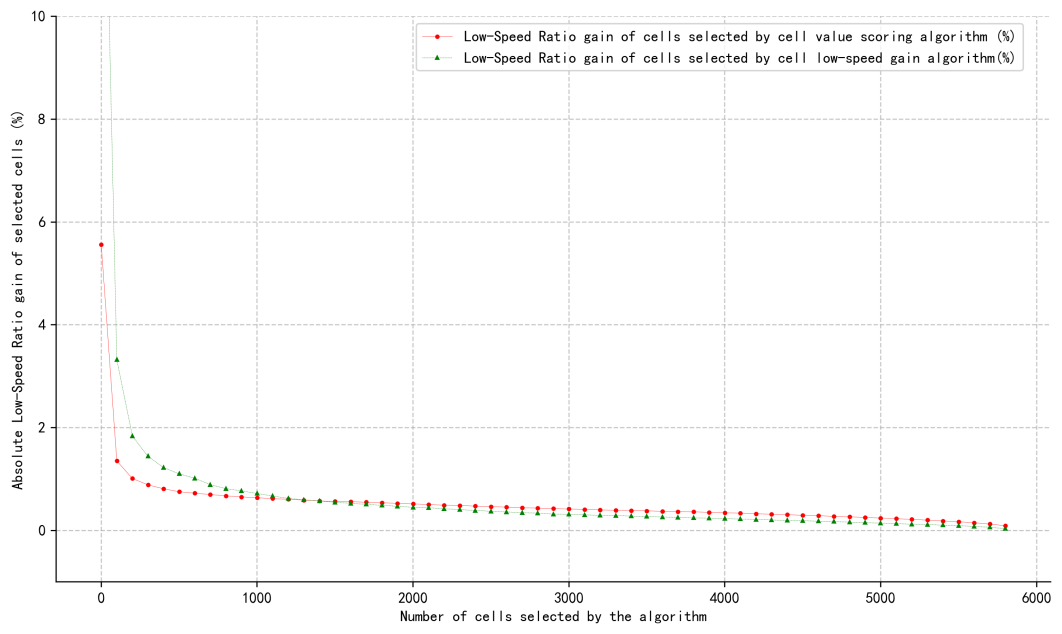
Compare the absolute gains of the Low-Speed Ratio K1 of the cells selected by the two algorithms after feature X is enabled.

As can be seen from Figure 3, when the number of deployed cells is less than 1000, the absolute gain of the Low-Speed Ratio K1 of conventional algorithm 1 is higher than the algorithm in this paper. However, as the number of deployed cells further increases, the absolute gain of the Low-Speed Ratio K1 of the algorithm in this paper will exceed that of conventional algorithm 1. Considering that in practical situations, the number of deployed cells is at least several thousand, and sometimes even reaches tens of thousands, in practical applications, deployment according to the algorithm in this paper has a more significant improvement on the Low-Speed Ratio K1 of cells. At the same time, the curve trends of the two algorithms can be combined to select the optimal cell combination.
In conclusion, by comparing the Low-Speed Ratio K1 and the absolute gain of the Low-Speed Ratio K1 of the cells selected by the two algorithms after deploying feature X, it can be verified that this algorithm has more advantages in improving the network’s Low-Speed indicator.
2.2.3. Comparison of time complexity between this algorithm and conventional algorithm 2
The time complexity of the traditional algorithm 2 (combination algorithm) is
For the optimal algorithm based on cell value scoring proposed in this paper, the time complexity of calculating the indicator K1 and its gain
In the mobile operator network, usually
3. Conclusion
This paper proposes an optimal algorithm for feature activation based on cell value scoring, aiming to solve the problem of low efficiency in cell selection when mobile operators deploy specific features in the field of wireless communication. This algorithm comprehensively considers the Low-Speed gain of cells after feature deployment and their contribution to the entire network, calculates the value score of cells, and then quickly determines the optimal list and number of deployed cells.
The experimental results show that by comparing the Low-Speed Ratios before and after feature deployment, the improvement effect of feature X on cell performance is verified. By comparing the post-deployment Low-Speed indicators with those of conventional algorithm 1, the advantages of this algorithm in improving network performance are demonstrated. By comparing the time complexity with that of conventional algorithm 2, the high efficiency of this algorithm is proven, which can quickly respond to the needs of mobile operators.
This research provides a scientific and efficient decision-making basis for mobile operators to deploy features under a limited budget, and has a certain promoting effect on the development of the wireless communication industry. However, the value scoring model in this paper depends on temporary deployment and collection of network-wide KPI data, which is relatively difficult to operate. Future research can attempt to build a neural network model using historical KPI data. For example, wireless indicators such as the number of cell users, load, modulation mode distribution, and the ratio of each speed interval are used as feature inputs, and the cell value score is used as the output of the model, so as to quickly predict and select the optimal cells in a new network. In addition, this framework can also be extended to the scenario of joint deployment of multiple features, and multiple key indicators such as the Low-Speed Ratio and uplink traffic can be improved simultaneously through multi-objective optimization methods.
References
[1]. Zhu Lilei. Research on 5G User Perception Optimization Speed Improvement and Application. Data Communications. 2021, (02), 11 - 16.
[2]. Fan Zhongyang, Tang Bing, Zhang Xiaodong, Zhao Xin. Research and Practice on 5G User Perceived Speed Improvement. communications Management and Technology. 2021, (01), 46 - 48.
[3]. Chen Yue, Chen Yu, Xu Weihua, Zhang Zhenyi, Guo Hua. Research on the Method of Improving User Perceived Speed in High - value Residential Areas. Information Recording Materials. 2022, 23(03), 196 - 199.
[4]. Qiang Jun. Summary of Optimization Experience for 5G Low - speed Cells. Data Communications. 2025, (02), 37 - 39.
[5]. Hao Yue, Tian Yuqi, Li Xin, Liu Jianhua, Chen Zhuo & Deng Wei. Performance Analysis and Improvement Scheme of MU - MIMO. 5G Network Innovation Seminar (2020), 267-271.
[6]. Jiang Xiaoyu. Test Progress and Performance Analysis of Massive MIMO. Communications World. 2018, (22), 33.
[7]. Xie Liang. Research on LTE Positioning Service System and the Method of Obtaining the Network Identification of the Cell Where the User is Located. Information and Communications Technology and Policy. 2011, (11), 27-30.
[8]. 3GPP TS 28.552-f60: "5G performance measurements (Release 15)". 2019, P11
[9]. Tae Yoon Park, Jong Won Han & Een Kee Hong.UE throughput guaranteed small cell on/off algorithm with machine learning. Journal of Communications and Networks, 2020, 22(3), 223-229.
[10]. Al Janaby Ali Othman. 5G Downlink Throughput Enhancement by Beams Consolidating at Vacant Traffic. Journal of Communications Software and Systems, 2019, 15(4), 311-316.
Cite this article
Ji,Z. (2025). An Optimal Algorithm for Feature Activation Based on Cell Value Scoring in the Field of Wireless Communication. Applied and Computational Engineering,183,1-6.
Data availability
The datasets used and/or analyzed during the current study will be available from the authors upon reasonable request.
Disclaimer/Publisher's Note
The statements, opinions and data contained in all publications are solely those of the individual author(s) and contributor(s) and not of EWA Publishing and/or the editor(s). EWA Publishing and/or the editor(s) disclaim responsibility for any injury to people or property resulting from any ideas, methods, instructions or products referred to in the content.
About volume
Volume title: Proceedings of CONF-MLA 2025 Symposium: Applied Artificial Intelligence Research
© 2024 by the author(s). Licensee EWA Publishing, Oxford, UK. This article is an open access article distributed under the terms and
conditions of the Creative Commons Attribution (CC BY) license. Authors who
publish this series agree to the following terms:
1. Authors retain copyright and grant the series right of first publication with the work simultaneously licensed under a Creative Commons
Attribution License that allows others to share the work with an acknowledgment of the work's authorship and initial publication in this
series.
2. Authors are able to enter into separate, additional contractual arrangements for the non-exclusive distribution of the series's published
version of the work (e.g., post it to an institutional repository or publish it in a book), with an acknowledgment of its initial
publication in this series.
3. Authors are permitted and encouraged to post their work online (e.g., in institutional repositories or on their website) prior to and
during the submission process, as it can lead to productive exchanges, as well as earlier and greater citation of published work (See
Open access policy for details).
References
[1]. Zhu Lilei. Research on 5G User Perception Optimization Speed Improvement and Application. Data Communications. 2021, (02), 11 - 16.
[2]. Fan Zhongyang, Tang Bing, Zhang Xiaodong, Zhao Xin. Research and Practice on 5G User Perceived Speed Improvement. communications Management and Technology. 2021, (01), 46 - 48.
[3]. Chen Yue, Chen Yu, Xu Weihua, Zhang Zhenyi, Guo Hua. Research on the Method of Improving User Perceived Speed in High - value Residential Areas. Information Recording Materials. 2022, 23(03), 196 - 199.
[4]. Qiang Jun. Summary of Optimization Experience for 5G Low - speed Cells. Data Communications. 2025, (02), 37 - 39.
[5]. Hao Yue, Tian Yuqi, Li Xin, Liu Jianhua, Chen Zhuo & Deng Wei. Performance Analysis and Improvement Scheme of MU - MIMO. 5G Network Innovation Seminar (2020), 267-271.
[6]. Jiang Xiaoyu. Test Progress and Performance Analysis of Massive MIMO. Communications World. 2018, (22), 33.
[7]. Xie Liang. Research on LTE Positioning Service System and the Method of Obtaining the Network Identification of the Cell Where the User is Located. Information and Communications Technology and Policy. 2011, (11), 27-30.
[8]. 3GPP TS 28.552-f60: "5G performance measurements (Release 15)". 2019, P11
[9]. Tae Yoon Park, Jong Won Han & Een Kee Hong.UE throughput guaranteed small cell on/off algorithm with machine learning. Journal of Communications and Networks, 2020, 22(3), 223-229.
[10]. Al Janaby Ali Othman. 5G Downlink Throughput Enhancement by Beams Consolidating at Vacant Traffic. Journal of Communications Software and Systems, 2019, 15(4), 311-316.


