


1. Introduction
Sustainable investment has expanded rapidly, yet the informational plumbing required to connect ESG narratives to prices remains incomplete. Corporate sustainability reports are rich in detail but heterogeneous in style, scope, and verification status [1]. The same firm may report baseline emissions, target trajectories, achieved outcomes, supplier audits, and governance changes across multiple formats over time; analysts then face the dual challenge of structuring these claims and determining their financial materiality at the moment of issuance for green bonds or sustainability-linked loans. Traditional extraction pipelines can produce fragmented, partially verified triples, while text-only predictive models often achieve reasonable accuracy but struggle to justify why particular factors drive spreads, limiting trust and hindering regulatory auditability [2].
This paper advances a joint solution that positions structure and valuation as mutually reinforcing tasks. We fine-tune a schema-constrained generative model that converts passages from ESG disclosures into typed, unit-normalized triples with temporal attributes. These triples roll up to issuer-level ESG knowledge graphs whose edges carry not only relation types but also measurement values, uncertainty, and provenance. A graph-aware, heteroscedastic regression head then projects the evolving ESG structure into a distribution over yield spreads at issuance, producing both point predictions and calibrated intervals. Gradients from the pricing objective feed back into the shared representation, encouraging the generator to emphasize financially salient evidence (for example, audited outcomes over unverifiable pledges) without hand-crafted rules [3]. First, we present a principled multi-task objective that ties together triple generation and spread prediction with learned uncertainty, ensuring the model communicates its confidence when disclosures are sparse or noisy. Second, we construct a cross-market dataset linking ESG passages from 2,000 issuers to 4,500 priced green instruments between 2016 and 2024, matching each security to pre-issuance disclosures and market covariates. Third, we provide a comprehensive empirical study showing improvements in extraction quality, predictive accuracy, and uncertainty calibration, accompanied by fine-grained robustness checks across sector, rating, term, and currency.
2. Literature review
2.1. Financial KGs and text generation
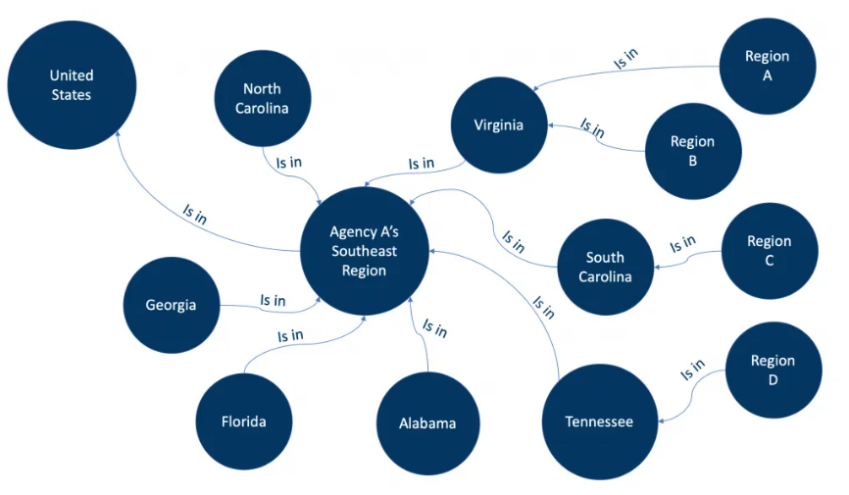
Financial knowledge graphs have progressed from brittle, rule-based pipelines to end-to-end generative systems that directly emit schema-conforming triples [4]. Generative decoding broadens coverage under domain drift, reduces annotation overhead versus multi-stage extractors, and preserves relational semantics at the moment of generation. As an illustration, Figure 1 depicts a simple graph in which entities (e.g., “United States,” “North Carolina,” “Agency A’s Southeast Region”) are connected by typed edges (“is in”), demonstrating how a schema constrains nodes and relations to valid triples. However, most prior work optimizes structural metrics—triple precision, completeness, and type validity—without integrating the graph’s economic value into the training objective [5].
2.2. ESG disclosure analytics
ESG text analytics has emphasized sentiment classifications, topic mappings, and the detection of commitments and outcomes, often summarizing complex narratives into low-dimensional features. While these representations can be predictive in aggregate, they lack explicit links between actors, actions, measurements, and time, complicating audits and cross-firm comparisons [6]. Few studies assemble relational, time-stamped structures that distinguish stated targets from realized outcomes and align them with third-party verifications, which is crucial for risk-relevant interpretation.
2.3. Green financing cost prediction
Empirical work on green financing costs spans linear factor models, tree ensembles, and graph-based approaches using issuer similarity. These models frequently incorporate ESG variables as black-box features or aggregated scores, hindering interpretability and transfer across markets with heterogeneous reporting standards [7]. Integrating symbolic ESG structure directly into valuation promises both improved accuracy and a clearly documented path from disclosed actions to observed pricing.
3. Methodology
3.1. Problem formulation
Let xx denote an ESG text passage and T={(h,r,t,a,u,τ)} a set of triples with head entity h, relation r, tail entity t, numeric attribute a (optional), unit u, and time stamp τ. Given issuer-level financing events with realized yield spread y at pricing date t\*. The joint loss see equation 1:
where
3.2. Generative ESG-KG model
We fine-tune an instruction-following language model with constrained decoding to emit triples that conform to a financial-ESG schema covering entities such as Issuer, Facility, Metric, Target, Action, Verification, and Counterparty. The decoder performs schema-checking at each step and normalizes units for numeric attributes (for example, converting reported emissions into tCO22e and energy into MWh, carrying along uncertainty ranges when provided) [9]. Passages are sampled from pre-issuance disclosures; each emitted triple is assigned a provenance pointer and a time stamp derived from the report date or explicitly mentioned period.
3.3. Green cost regression head
Given the assembled graph Gi(τ≤t\*), we build an issuer representation by combining base covariates zi,t\* (rating, tenor, currency, benchmark curve, and volatility measures) with graph-derived features obtained through time-aware relational convolution and attention.
4. Experimental procedure
4.1. Data collection & pre-processing
We compile ESG disclosures from 2016 to 2024 for 2,000 listed issuers across three primary venues: EDGAR (United States), LSE (United Kingdom), and HKEX (Hong Kong). After de-duplication and language normalization, the corpus totals 1.20 million sentences organized into 14,930 report-year entries. We extract structured issuance records for 3,120 green-bond tranches and 1,380 sustainability-linked loan facilities. Each financing event is matched to the nearest preceding disclosure window within 180 days. The resulting graphs hold 1.26 million triples and 428,000 unique entities; 38.7% of edges carry numeric attributes with units and uncertainty bounds. Market covariates include tenor- and currency-matched benchmark yields, contemporaneous credit ratings and outlooks, realized volatility, and sector dummies.
4.2. Training setup
Models are trained on eight A100 GPUs using AdamW with linear warm-up over 3,000 steps and cosine decay for ten epochs. We adopt LoRA adapters for efficient fine-tuning. Hyperparameters, learning rate, decoding beam width, and the multi-task weights (λ1,λ2), are tuned by Bayesian search on a 10% validation split selected chronologically to avoid leakage. Early stopping based on validation negative log-likelihood prevents overfitting. The best model is chosen by a composite score that averages KG Precision@50 and spread RMSE on the validation period. All numerical features are standardized using statistics computed on the training set only; categorical variables are one-hot encoded with unseen categories mapped to an “other” bucket during testing [10].
4.3. Evaluation metrics & baselines
Knowledge-graph quality is measured by triple-level Precision@N, Recall@N, and Hits@K against a manually verified set of 32,400 triples sampled across sectors and years. Calibration of relation-type confidences is assessed using Brier score and reliability curves. For pricing, we report RMSE and MAE in basis points, MAPE, R2, average test log-likelihood, and the continuous ranked probability score (CRPS). Interval forecasts are evaluated by empirical 95% coverage and mean width. Baselines comprise: (i) LightGBM on bag-of-words features concatenated with market covariates; (ii) a two-stage pipeline with an unconstrained decoder feeding TransE embeddings and elastic-net regression; and (iii) a GNN that encodes issuer similarity from non-text fundamentals but ignores ESG triples. All model comparisons use paired tests; significance is established at p<0.01.
5. Results and discussion
5.1. Knowledge graph quality
The multi-task model achieves Precision@50 of 0.871, Recall@50 of 0.816, and Hits@10 of 0.908 on the gold triple set, improving over the template-based pipeline by +0.182, +0.149, and +0.121, respectively. The Brier score for relation-type calibration drops from 0.214 to 0.137, and reliability curves show maximal deviation from perfect calibration of 0.038. Type-violation rate under constrained decoding is 0.9%, versus 7.8% for unconstrained generation. Time-consistency checks, verifying that outcomes postdate targets and that cumulative metrics (for example, renewable share) evolve monotonically within reported uncertainty, pass in 96.1% of cases. Median graph degree per issuer is 5 (interquartile range 3-11), with a 90th percentile of 19, indicating sufficient heterogeneity for relational modeling. Numeric attributes concentrate in emissions (42.1% of numeric edges), energy (27.4%), and supply-chain audits (14.9%). The median lag from disclosure to issuance is 92 days (mean 97.3, SD 36.5). Table 1 summarizes the corpus and graph statistics across markets and sectors.
|
Category |
Issuers (N) |
Sentences (K) |
Triples (K) |
Unique Entities (K) |
Numeric-Edge Share |
Median Report→Issue Lag (days) |
|
EDGAR (U.S.) |
1,050 |
640.2 |
702.8 |
232.4 |
0.41 |
88 |
|
LSE (U.K.) |
540 |
331.7 |
367.9 |
126.8 |
0.39 |
94 |
|
HKEX (HK) |
410 |
228.1 |
189.6 |
69 |
0.33 |
101 |
|
Energy |
210 |
126.4 |
138.2 |
45.1 |
0.54 |
83 |
|
Industrials |
430 |
268.2 |
284.9 |
96.7 |
0.44 |
89 |
|
Utilities |
220 |
152.7 |
166.4 |
58.2 |
0.57 |
76 |
|
Materials |
270 |
139.5 |
151.1 |
53.4 |
0.49 |
91 |
|
Consumer |
330 |
167.3 |
173.6 |
60.3 |
0.32 |
99 |
|
Tech/Comm |
540 |
314.9 |
346.4 |
114.5 |
0.28 |
106 |
5.2. Prediction performance
Out-of-sample tests (train 2016-2021, test 2022-2024) show that the proposed model reduces spread RMSE from 164.3 to 122.6 basis points relative to the strongest baseline, a 41.7 bps improvement. The MAE is 94.8 bps, MAPE 12.1%, and R2 rises from 0.29 to 0.41. Average test log-likelihood increases by +0.27 nats per instrument, and CRPS decreases from 89.7 to 71.3 (bps units), indicating sharper probabilistic forecasts. Empirical 95% intervals achieve 94.6% coverage with mean width 184.2 bps, a 23.4% tightening versus the GNN-only baseline (coverage 94.1%, width 240.7 bps). Rating-conditional RMSEs are 77.9 (AAA/AA), 106.4 (A), 129.8 (BBB), and 161.3 (BB/B) bps; maturity-conditional RMSEs are 109.5 (1-3y), 123.7 (3-7y), 136.1 (7-15y), and 149.6 (>15y) bps. Currency splits yield 119.8 (USD), 125.6 (EUR), and 131.2 (HKD/CNH) bps. Interval calibration passes the probability integral transform test, with maximum bin deviation 0.031 from uniformity. Table 2 reports a detailed rating-by-maturity breakdown, including interval widths and coverage.
5.3. Ablation & robustness
Ablation experiments isolate the contribution of each component. Removing KG supervision but retaining the pricing head increases test RMSE by 15.9 bps and widens 95% intervals by 21.7 bps. Replacing schema-constrained decoding with unconstrained sampling increases the type-violation rate from 0.9% to 7.8%, reduces KG F1@50 by 10.6 points, and deteriorates spread RMSE by 9.4 bps. Disabling heteroscedastic variance forces the model to misallocate uncertainty, worsening CRPS by 12.8 and reducing empirical 95% coverage to 91.3% for similar width, indicating underestimation of tail risk. Temporal robustness is confirmed by training through 2019 and testing on the COVID-19 period (2020-2021): RMSE is 138.7 bps compared with 153.4 bps for the strongest baseline, and the 95th-percentile absolute error shrinks by 0.17 relative units under a Kolmogorov-Smirnov test that rejects equality of residual distributions at p<0.01.
6. Conclusion
This paper demonstrates that a schema-constrained generative model, trained jointly with a graph-aware heteroscedastic regressor, can convert unstructured ESG disclosures into an auditable knowledge graph and translate that structure into reliable predictions of green financing costs. The unified objective improves triple precision, sharpens intervals without undercoverage, and enhances generalization across regimes and markets. Economic interpretation becomes more transparent, as the model connects spread movements to achieved and verified operational improvements rather than to aspirational statements alone. Limitations include dependency on English or translated texts, potential survivorship among firms with richer reporting histories, and residual ambiguity in sustainability terminology.
References
[1]. Li, V. X. (2023). Findkg: Dynamic knowledge graph with large language models for global finance. Available at SSRN 4608445.
[2]. Kertkeidkachorn, N., Nararatwong, R., Xu, Z., & Ichise, R. (2023, February). Finkg: A core financial knowledge graph for financial analysis. In 2023 IEEE 17th International Conference on Semantic Computing (ICSC) (pp. 90-93). IEEE.
[3]. Cao, Y., Mansir, I. B., Mouldi, A., Alsharif, S., Aly, A. A., Jarad, F., ... & Bouallegue, B. (2022). Sustainability and financial assessments and double-criteria optimization of a novel power/hydrogen coproduction scheme using solar power and compressed air energy storage cycle. Journal of Energy Storage, 52, 105053.
[4]. Yuan, W., Neubig, G., & Liu, P. (2021). Bartscore: Evaluating generated text as text generation. Advances in neural information processing systems, 34, 27263-27277.
[5]. Zhou, W., Jiang, Y. E., Wilcox, E., Cotterell, R., & Sachan, M. (2023, July). Controlled text generation with natural language instructions. In International Conference on Machine Learning (pp. 42602-42613). PMLR.
[6]. Olanrewaju, O. I. K., Daramola, G. O., & Babayeju, O. A. (2024). Harnessing big data analytics to revolutionize ESG reporting in clean energy initiatives. World Journal of Advanced Research and Reviews, 22(3), 574-585.
[7]. Benghiat, S., & Lahmiri, S. (2025). Evaluating Predictive Models for Three Green Finance Markets: Insights from Statistical vs. Machine Learning Approaches. Computation, 13(3), 76.
[8]. Abdelhady, A. S., Dahmani, N., AbouEl-Magd, L. M., Darwish, A., & Hassanien, A. E. (2024). Green finance growth prediction model based on time-series conditional generative adversarial networks. Plos one, 19(7), e0306874.
[9]. Kogdenko, V. (2025). development of Economic analysis: Predictive analytics, ESg analytics, analysis of transformation Processes at the Meso-and Micro-Levels. УЧЕТ. АНАЛИЗ. АУДИТ, 14.
[10]. Singhania, M., & Gupta, D. (2024). Impact of Environmental, Social and Governance (ESG) disclosure on firm risk: A meta‐analytical review. Corporate Social Responsibility and Environmental Management, 31(4), 3573-3613.
Cite this article
Hu,S. (2025). Multi-Task Generative Financial Knowledge Graph Construction from Corporate ESG Disclosures and Green Financing Cost Prediction. Applied and Computational Engineering,189,8-13.
Data availability
The datasets used and/or analyzed during the current study will be available from the authors upon reasonable request.
Disclaimer/Publisher's Note
The statements, opinions and data contained in all publications are solely those of the individual author(s) and contributor(s) and not of EWA Publishing and/or the editor(s). EWA Publishing and/or the editor(s) disclaim responsibility for any injury to people or property resulting from any ideas, methods, instructions or products referred to in the content.
About volume
Volume title: Proceedings of The 6th International Conference on Signal Processing and Machine Learning
© 2024 by the author(s). Licensee EWA Publishing, Oxford, UK. This article is an open access article distributed under the terms and
conditions of the Creative Commons Attribution (CC BY) license. Authors who
publish this series agree to the following terms:
1. Authors retain copyright and grant the series right of first publication with the work simultaneously licensed under a Creative Commons
Attribution License that allows others to share the work with an acknowledgment of the work's authorship and initial publication in this
series.
2. Authors are able to enter into separate, additional contractual arrangements for the non-exclusive distribution of the series's published
version of the work (e.g., post it to an institutional repository or publish it in a book), with an acknowledgment of its initial
publication in this series.
3. Authors are permitted and encouraged to post their work online (e.g., in institutional repositories or on their website) prior to and
during the submission process, as it can lead to productive exchanges, as well as earlier and greater citation of published work (See
Open access policy for details).
References
[1]. Li, V. X. (2023). Findkg: Dynamic knowledge graph with large language models for global finance. Available at SSRN 4608445.
[2]. Kertkeidkachorn, N., Nararatwong, R., Xu, Z., & Ichise, R. (2023, February). Finkg: A core financial knowledge graph for financial analysis. In 2023 IEEE 17th International Conference on Semantic Computing (ICSC) (pp. 90-93). IEEE.
[3]. Cao, Y., Mansir, I. B., Mouldi, A., Alsharif, S., Aly, A. A., Jarad, F., ... & Bouallegue, B. (2022). Sustainability and financial assessments and double-criteria optimization of a novel power/hydrogen coproduction scheme using solar power and compressed air energy storage cycle. Journal of Energy Storage, 52, 105053.
[4]. Yuan, W., Neubig, G., & Liu, P. (2021). Bartscore: Evaluating generated text as text generation. Advances in neural information processing systems, 34, 27263-27277.
[5]. Zhou, W., Jiang, Y. E., Wilcox, E., Cotterell, R., & Sachan, M. (2023, July). Controlled text generation with natural language instructions. In International Conference on Machine Learning (pp. 42602-42613). PMLR.
[6]. Olanrewaju, O. I. K., Daramola, G. O., & Babayeju, O. A. (2024). Harnessing big data analytics to revolutionize ESG reporting in clean energy initiatives. World Journal of Advanced Research and Reviews, 22(3), 574-585.
[7]. Benghiat, S., & Lahmiri, S. (2025). Evaluating Predictive Models for Three Green Finance Markets: Insights from Statistical vs. Machine Learning Approaches. Computation, 13(3), 76.
[8]. Abdelhady, A. S., Dahmani, N., AbouEl-Magd, L. M., Darwish, A., & Hassanien, A. E. (2024). Green finance growth prediction model based on time-series conditional generative adversarial networks. Plos one, 19(7), e0306874.
[9]. Kogdenko, V. (2025). development of Economic analysis: Predictive analytics, ESg analytics, analysis of transformation Processes at the Meso-and Micro-Levels. УЧЕТ. АНАЛИЗ. АУДИТ, 14.
[10]. Singhania, M., & Gupta, D. (2024). Impact of Environmental, Social and Governance (ESG) disclosure on firm risk: A meta‐analytical review. Corporate Social Responsibility and Environmental Management, 31(4), 3573-3613.