


1. Introduction
The manufacturing of the first bismuth doped fiber (BDF) for amplifier and laser applications can be traced back to 2006 [1]. With the rapid development of the Internet and communication, the information demand in hot information fields such as big data, artificial intelligence and cloud computing is still growing at an annual rate of 30% to 40% [2]. In addition, people have increasingly high requirements for network transmission efficiency. Fiber lasers refer to a class of lasers that use fiber as a substrate, doped with some active ions as an active substance, or made using the nonlinear effects of the fiber itself [3]. Erbium-doped fiber amplifiers were once the most popular optical fiber devices. In the 1990s, the two cutting-edge research achievements of erbium-doped fiber amplifiers and wavelength division multiplexing significantly promoted the development of the optical fiber field. The high gain provided by erbium-doped fiber amplifiers can compensate for the loss of optical signals in fiber links, significantly increasing the transmission distance of optical signals. Erbium-doped fiber amplifiers operate at a low loss transmission window of 1528-1563 nm, with advantages such as low noise index, high gain, wide bandwidth, low pump power required, low insertion loss, and insensitivity to polarization. However, the amplification bandwidth of EDFA is typically only 35 nm, covering only a tiny portion of the fiber's low-loss transmission window. Due to its narrow operating frequency band, its principal operating frequency band is 1565-1625 nm, which only covers a small portion of the optical fiber's low-loss window, significantly limiting the development of bandwidth and highlighting its limitations in the field of optical fiber. Therefore, besides erbium, the applications of other rare earth elements, transition metal elements, and leading group elements in optical fibers are gradually becoming known. A chaotic optimization method is suggested and effectively used to the fractional Fourier transform in order to address the shortcomings of conventional step-by-step search technology in two-dimensional fractional Fourier domain extremum search [4]. The chaotic optimization algorithm will be applied in this study. The Chaotic Optimization Approach (COA) is an optimization technique based on chaotic [5]. Its main idea is to use the chaotic characteristics of chaotic systems to incrementally improve the goal function. Rapid convergence, strong global searchability, and good adaptability are all advantages of the COA algorithm, which has been widely used in a variety of fields. It uses a variety of methods, including population initiation, crossover and mutation operations, fitness function, chaos mapping function, and objective function. Due to the increasing need for transmission capacity in optical communication systems, efforts are being undertaken to broaden the spectrum range of rare-earth-doped fiber lasers and amplifiers [6].
2. Method
Bismuth-doped fiber amplifier (BDFA) is a device that uses bismuth-doped fiber to amplify optical signals. Compared with an Erbium-doped fiber amplifier (EDFA), BDFA has a more comprehensive working wavelength range and lower noise figure. It is widely used in optical fiber communication, sensing, and imaging.
The operation of a laser that is used to inject pump light into a bismuth-doped fiber is the core of the amplifier that utilizes this type of fiber. After being put into an excited state by the absorption of the pump light, the bismuth atom subsequently transfers energy to the optical signal by producing stimulated radiation to increase the strength of the optical signal. Bismuth-doped fiber amplifier can provide high gain in a wide wavelength range because bismuth ion has many excited States and emission States. Bismuth-doped fiber amplifier has the advantages of high gain, wide wavelength range, low noise figure, high stability, and reliability. It can be used to enhance optical signals, extend optical fiber transmission distance and improve optical transmission quality. The disadvantage is that the preparation process is complex, the cost is high, and the support of a high-power pump laser is needed. Bismuth-doped fiber amplifier has been widely used in optical communication, optical fiber sensing, medical imaging, biomedicine, and other fields and has attracted more and more researchers' attention.
In this program design, it is particularly important to understand the energy level structure of bismuth ions to obtain the gain spectrum changes under different doping concentrations. The energy levels of bismuth ions are very complex, A bismuth atom's outermost layer of electrons has the configuration \( 4{f^{14}}5{d^{10}}6{s^{2}}6{p^{3}} \) . As a result of the strong electron-phonon coupling and the Stark splitting effects, the energy levels of ions are split into multiple sub-levels. Therefore, in order to represent the energy level as well as the electron transition process, a quasi-three-level coordination arrangement with electron-phonon coupling is utilized. This research, however, takes a more straightforward approach by classifying them into a three-tiered hierarchy based on the spectral properties they exhibit. The transition diagram for the three-level system is depicted here, as can be seen in Figure 1. From this, the corresponding rate and power propagation equations may be derived, and the Fun function can be enhanced by combining it with other data.
Rate equation under steady-state conditions:
\( \frac{∂{N_{1}}(z)}{∂t}=-[{W_{p}}(z)+{W_{12}}(z)]{N_{1}}(z)+{A_{21}}{N_{2}}(z)+{W_{21}}(z){N_{2}}(z) \) (1)
\( \frac{∂{N_{2}}(z)}{∂t}={W_{12}}(z){N_{1}}(z)-{W_{21}}(z){N_{2}}(z)-{A_{21}}{N_{2}}(z)+{A_{32}}{N_{3}}(z) \) (2)
\( \frac{∂{N_{3}}(z)}{∂t}={W_{p}}(z){N_{1}}(z)-{A_{32}}{N_{3}}(z) \) (3)
\( N={N_{1}}(z)+{N_{2}}(z)+{N_{3}}(z) \) (4)
|
Figure 1. The transition diagram of the three-level system [7]. |
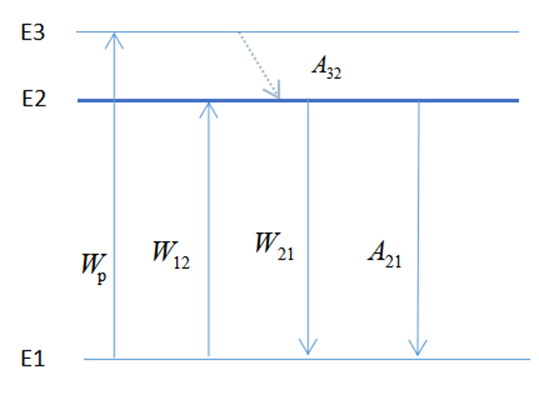
N1, N2 are the particle number density of the ground, metastable, and excited states, respectively, and N is the total particle number density. Wp, W12, W21, A21, A32 are pump light absorption rate, signal light absorption rate, signal light excited emission rate, radiation transition probability, and non-radiation transition probability. Power propagation equation under steady-state conditions:
\( \frac{d{P_{p}}(z)}{dz}={T_{p}}(-{σ_{p}}{N_{1}}(z)-{α_{a}}){P_{p}}(z) \) (5)
\( \frac{d{P_{s}}(z)}{dz}={T_{s}}[{σ_{21}}{N_{2}}(z)-{σ_{12}}{N_{1}}(z)-{α_{s}}]{P_{s}}(z) \) (6)
\( \frac{d{P_{a}}(z)}{dz}={T_{ase}}[{σ_{21}}{N_{2}}(z)-{σ_{12}}{N_{1}}(z)-{α_{s}}]{P_{s}}(z)+{σ_{21}}{N_{2}}(z)hvΔv \) (7)
\( {σ_{p}}、{σ_{12}}、{σ_{21}} \) represents the pump light absorption cross-section, the signal light absorption cross-section, and the radiation cross-section, respectively. The physical significance of the cross-section refers to the capacity of particles \( α,Δv \) to absorb or emit light.
The initial concept is as follows. The emission cross-section and absorption cross-section images of bismuth at 1200 nm to 800 nm can be drawn utilizing data obtained from published sources and Matlab as a tool. After writing the relevant code and utilizing the rate propagation equation to acquire an image of the signal's variation with fiber length and doping concentration, the difference between the maximum and minimum values can be determined. After that, the chaotic optimization technique is used to the system to make it as efficient as possible. The use of a chaotic sequence as a tool to improve search performance is dependent on the linear mapping of chaotic variables to search-optimized variables. The size of the search space has a direct bearing on the results of optimization; if the search area is too wide, it will be impossible to find a solution that meets all of the requirements.
Additionally, because chaotic motion is random, it is possible to jump far when getting close to the best overall solution, which wastes time during optimization. Two stages make up the chaotic dynamics- based search process: first, the ergodic orbit produced by deterministic iteration is used to study the solution space. When specific termination requirements are met, the obtained ideal state is regarded to be close to the optimal solution for the problem, and this state serves as the starting point for the second stage of the search. Pay close attention to the first-stage results, and then, in the second stage, introduce interference with a minute amplitude in the surrounding area. Continue doing this until the algorithm's termination standard is met.
The secondary carrier method of "coarse search" and "fine search" establishes the chaotic search-based fundamental optimization method. Since then, the chaotic search-based optimization method has been extensively studied, refined, and/or combined with other approaches to form a mixed messy optimization method.
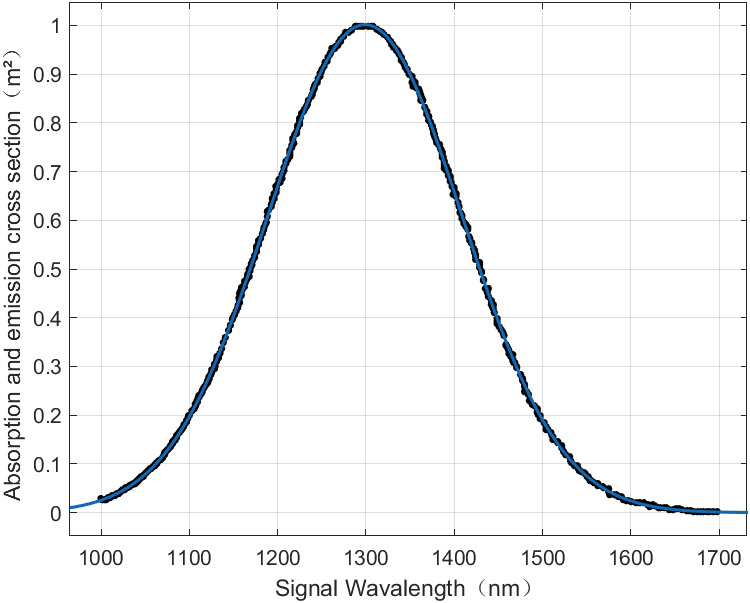
In addition, the data required for the rate and power propagation equations have been obtained according to different literature: the speed of light in vacuum, c is 3×10⁸ m/s. Planck constant h is 6.626×10⁻²⁴ m2∙kg/s. The dielectric loss coefficient is 0.1cm-1. The emission cross section is 0.2×10⁻²⁴ m2 at the wavelength of the pump. The absorption cross-section at wavelength is 1.3×10⁻²⁴m2. The overlap factor \( Γp \) is 0.8 and 0.5. Fiber radius=2.5×10⁻⁶ m2. The pump wavelength measures 0.808×10⁻⁶ mm. The signal's central wavelength is 1.3×10⁻⁶ m [8]. The bismuth emission cross section as a function of emission spectrum wavelength is depicted in Figure 2. Figure 2 demonstrates that the emission cross-section of the signal wavelength increases from 1000 to 1300 nm, reaches a maximum at 1300 nm, and then diminishes gradually from 1300 to 1700 nm [9]. When the wavelengths of the signal are 1700 nm and 1000 nm, the emission cross section is practically nonexistent.
| Figure 2. Cross section of bismuth's emission as a function of the emission spectrum's wavelength [10]. |
3. Result and discussion
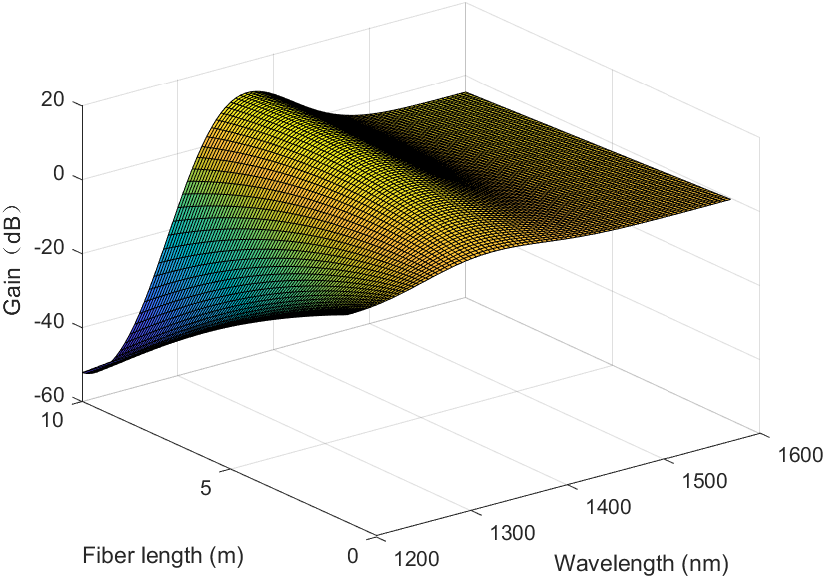
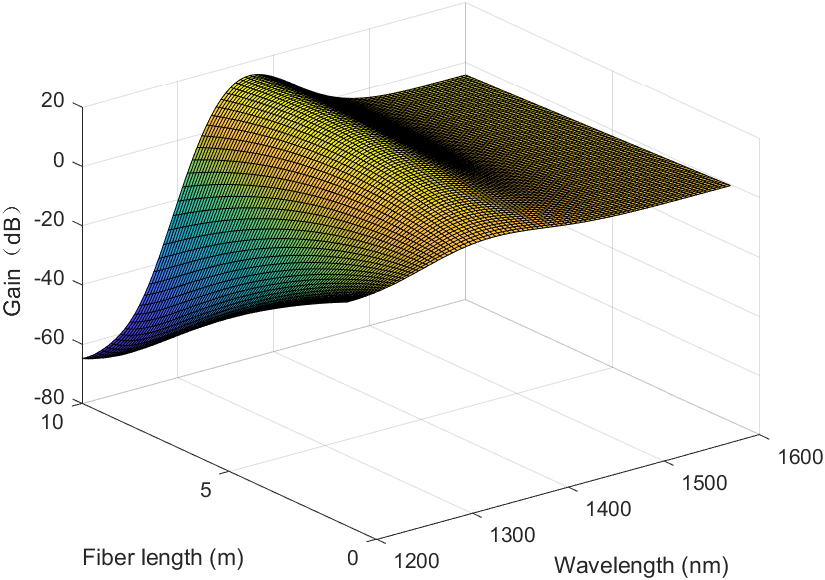
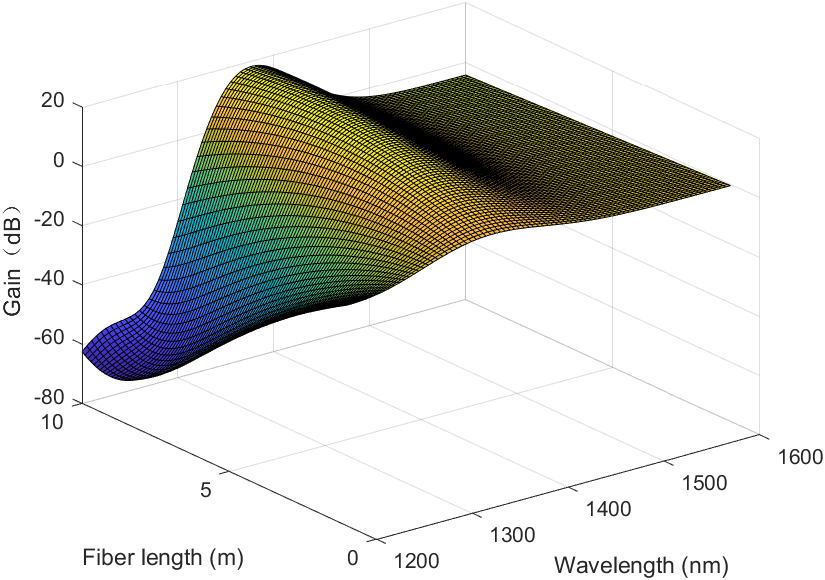
Three distinct doping concentrations were chosen for this experiment's simulation, and conclusions were formed as a result. Figure 3 displays the corresponding gain for various fiber lengths and wavelengths when the doping concentration is 1.5×1024. The equivalent wavelength and fiber length are 1370 nm and 8.0 m, and the maximum gain is 16.1687 dB and the minimum gain is -527.0145 dB. Figure 5 displays the associated gain for various fiber lengths and wavelengths when the doping concentration is 2.0×1024. The maximum gain is 16.1687 dB, the minimum gain is -527.0145 dB, and the corresponding wavelength and fiber length are 1370 nm and 8.0 m. When the doping concentration is 2.5×1024 ions/m3, the related gain for different fiber lengths and wavelengths is shown in Figure 5. Maximum gain is 19.8186 dB, minimum gain is -527.0145 dB, and corresponding wavelength and fiber length are 1370 nm and 7.6 m. In response to the preceding conclusions, this article focuses solely on the case in which the wavelength range is 1200 to 1600 nm. In different wavelength ranges, alternative conclusions are possible. It is expected that different doped ions will have additional gains corresponding to various wavelengths and fiber lengths.
|
Figure 3. Gain corresponding to different fiber lengths and wavelengths when doping concentration is 1.5×1024 ions/m3. |
|
Figure 4. Gain corresponding to different fiber lengths and wavelengths when doping concentration is 2.0×1024 ions/m3. |
|
Figure 5. Gain corresponding to different fiber lengths and wavelengths when doping concentration is 2.5×1024 ions/m3. |
4. Conclusion
Numerous variables influence the gain of a bismuth-doped fiber amplifier, including bismuth-doped concentration, fiber length, and wavelength. Consequently, the gain range of a bismuth-doped fiber amplifier is expansive, typically exceeding 10 to 40 dB. The maximum and minimal gains of a bismuth-doped fiber amplifier depend on its design and parameter settings. This study's conclusion is the difference between these two numbers. From the point of view of doping concentration, with the gradual increase of doping concentration, the minimum gain of the bismuth-doped fiber amplifier has not changed significantly. However, the maximum gain value of the bismuth-producing fiber amplifier will gradually increase with the increase of doping concentration. This will make the noise, that is, the difference between the maximum and minimum gain of the bismuth-producing fiber amplifier, more extensive and larger. After using the optimization algorithm, we can search in a smaller search space and get the extreme value. Multiple scaling optimization can be performed, the search space can be reduced, and the adjustment coefficient can be changed. In this way, this model will become faster and less repetitive.
References
[1]. Wang L and Jiang Z 2022 Limit of Bandwidth, Output Power and Noise Figure of Bismuth Doped Fiber Amplifier for E and S Band IEEE Photon. Conf. p 1-2
[2]. Morioka T 2009 New generation optical infrastructure technologies: EXAT initiative towards 2020 and beyond. IEEE Optoelectron. Commun. Conf.
[3]. Dialov Y 2020 History, Development, and Prospects of Bismuth Doped Fiber Opt. Optoelectron. Tech. 01 p 1-4
[4]. Wang H K, Wang P B, Chen Z M and Fan Y F 2010 Int. Conf. Signal Acquis. Process. pp 94-98, doi: 10.1109/ICSAP.2010.8.
[5]. Melkumov M A, Alyshev S V, Firstov S V and Dianov E M 2016 Bismuth-doped fiber lasers and amplifiers: Review and prospects Int. Conf. Laser Opt. p S1-19
[6]. Sharif K A M 2018 Passive Element Fault Analysis at the Last Mile of the FTTH Network in Malaysia IEEE Int. Conf. Photon. p 1-3
[7]. Hughes M, Suzuki T and Ohishi Y 2008 Advanced bismuth-doped lead-germanate glass for broadband optical gain devices J. Opt. Soc. Am. B. 25 (8)
[8]. Jiang C 2009 Modelling a Broadband Bismuth-Doped Fiber Amplifier IEEE J. Sel. Top. Quantum Electron. 15(1) p 79-84 doi: 10.1109/JSTQE.2008.2010269.
[9]. Evgeny M D 2012 Bismuth-doped optical fibers: a challenging active medium for near-IR lasers and optical amplifiers Light Sci. Appl. 1(2)
[10]. Hughes M, Suzuki T and Ohishi Y 2010 Spectroscopy of bismuth-doped lead aluminum germanate glass and yttrium aluminum silicate glass J. Non-Crystalline Solids p 356
Cite this article
Chen,N.;Zhang,Y. (2023). Modeling and numerical simulation optimization for minimizing the gain spectrum of bismuth-doped broadband fiber amplifiers at 1200-1800 nm. Applied and Computational Engineering,11,46-51.
Data availability
The datasets used and/or analyzed during the current study will be available from the authors upon reasonable request.
Disclaimer/Publisher's Note
The statements, opinions and data contained in all publications are solely those of the individual author(s) and contributor(s) and not of EWA Publishing and/or the editor(s). EWA Publishing and/or the editor(s) disclaim responsibility for any injury to people or property resulting from any ideas, methods, instructions or products referred to in the content.
About volume
Volume title: Proceedings of the 2023 International Conference on Mechatronics and Smart Systems
© 2024 by the author(s). Licensee EWA Publishing, Oxford, UK. This article is an open access article distributed under the terms and
conditions of the Creative Commons Attribution (CC BY) license. Authors who
publish this series agree to the following terms:
1. Authors retain copyright and grant the series right of first publication with the work simultaneously licensed under a Creative Commons
Attribution License that allows others to share the work with an acknowledgment of the work's authorship and initial publication in this
series.
2. Authors are able to enter into separate, additional contractual arrangements for the non-exclusive distribution of the series's published
version of the work (e.g., post it to an institutional repository or publish it in a book), with an acknowledgment of its initial
publication in this series.
3. Authors are permitted and encouraged to post their work online (e.g., in institutional repositories or on their website) prior to and
during the submission process, as it can lead to productive exchanges, as well as earlier and greater citation of published work (See
Open access policy for details).
References
[1]. Wang L and Jiang Z 2022 Limit of Bandwidth, Output Power and Noise Figure of Bismuth Doped Fiber Amplifier for E and S Band IEEE Photon. Conf. p 1-2
[2]. Morioka T 2009 New generation optical infrastructure technologies: EXAT initiative towards 2020 and beyond. IEEE Optoelectron. Commun. Conf.
[3]. Dialov Y 2020 History, Development, and Prospects of Bismuth Doped Fiber Opt. Optoelectron. Tech. 01 p 1-4
[4]. Wang H K, Wang P B, Chen Z M and Fan Y F 2010 Int. Conf. Signal Acquis. Process. pp 94-98, doi: 10.1109/ICSAP.2010.8.
[5]. Melkumov M A, Alyshev S V, Firstov S V and Dianov E M 2016 Bismuth-doped fiber lasers and amplifiers: Review and prospects Int. Conf. Laser Opt. p S1-19
[6]. Sharif K A M 2018 Passive Element Fault Analysis at the Last Mile of the FTTH Network in Malaysia IEEE Int. Conf. Photon. p 1-3
[7]. Hughes M, Suzuki T and Ohishi Y 2008 Advanced bismuth-doped lead-germanate glass for broadband optical gain devices J. Opt. Soc. Am. B. 25 (8)
[8]. Jiang C 2009 Modelling a Broadband Bismuth-Doped Fiber Amplifier IEEE J. Sel. Top. Quantum Electron. 15(1) p 79-84 doi: 10.1109/JSTQE.2008.2010269.
[9]. Evgeny M D 2012 Bismuth-doped optical fibers: a challenging active medium for near-IR lasers and optical amplifiers Light Sci. Appl. 1(2)
[10]. Hughes M, Suzuki T and Ohishi Y 2010 Spectroscopy of bismuth-doped lead aluminum germanate glass and yttrium aluminum silicate glass J. Non-Crystalline Solids p 356