


Predicting Product Sales Based on Sentiment Analysis Using Reviews: The Case of Amazon's Kindle
Xinru Wang1,*, Xinran Jin2, Yongqiang Wu3, Yajing Liao4, Dongchen Lei5
1Software Engineering, Chongqing University, Chongqing, China
2Department of Mathematics, Baylor University, Waco, United States
3School of Management, Xi’an Jiaotong University, Xi’an, China
4Department of Engineering, University College London, London, UK
5Henan Experimental High School, Zhengzhou, China
siren.xrw@gmail.com, jinxinran0406@gmail.com, leon.w.997@foxmail.com, yajingliao1@gmail.com, ldc200562@gmail.com
Abstract—This paper proposed a novel approach to predict sales by analyzing the sentiment of online product reviews. The contributions of this paper are: (1) examine sentiment analysis to extract emotions– such as anger, fear, or participation – from the product reviews; (2) identified the time lag of the interaction between reviews and sale fluctuation; (3) applied three multiclass classification methods to forecast sales and combined them using a majority vote classifier for better performance and accuracy. Online sellers can utilize the proposed models to analyze the potential influence of reviews as an addition to traditional sale forecasting methods.
Keywords-Online consumer reviews, predictive modelling, sentiment analysis, Sentiment Classification
1. Introduction
In recent years, e-commerce purchasing methods have become increasingly popular and replaced many traditional ones. Therefore, many brands and stores are gradually turning to online shopping sales methods. In the aftermath of the epidemic, e-commerce has become even more of a significant consumer choice. According to statistics, e-commerce transactions in the United States reached $877.78 billion in 2021, accounting for 20% of U.S. sales [1]. The reliability of ensuring the quality of goods online and how consumers can access detailed information about the goods has become a top priority for the e-commerce market. While consumers search online, learning about the product and evaluating alternatives, they are likely to encounter and utilize numerous online product reviews left by other users [2]. This includes feedback about the quality and use of the product, which becomes a primary source of information and a significant factor in consumers' decision-making process. Then the reviews left by users on the Internet are critical.
Users post relevant product reviews on the e-commerce platform where they purchased the product. These reviews are users' personal opinions after viewing and using the product, thus allowing for the extraction of remarks judging product quality and users' opinions about the product from the product reviews. However, these reviews are often used by potential purchasers to understand the quality of the product and play a decisive role in whether consumers buy it or not. Manufacturers and sellers can monitor this information in real-time to understand how users feel about their products, which can further improve product quality and sales and directly increase profits. Overall, analyzing and mining information from product reviews can lead to additional benefits for consumers, producers, and buyers. Therefore, research on product reviews is imperative. This paper will further explore the impact of affective polarity and degree of polarity of product review information on product sales and predict product sales through various modeling techniques.
2. Literature Review
Several recent papers have explored how consumer sentiment and behavior can be judged to have an impact on the e-commerce market. In this regard, Dr. Lee developed a model of consumer behavior under e-commerce and through this explored the impact of consumer behavior on the competitiveness of the e-commerce industry [3]. Koyuncu and Lien analyzed that different preference settings of different consumers have a significant impact on online shopping [4]. Zhang et al. explored the impact of emotions in social media on e-commerce consumers' purchasing behavior [5]. Benlian et al. presented the different effects that consumer reviews and recommendations have on other consumer beliefs and trust dimensions and showed that these emotions and behaviors would eventually affect the product [6]. Lu, Lu, and Wang state that negative customer emotions directly lead to decreased e-commerce repurchase power [7]. Guthrie et al. discussed the impact of consumer panic and coping emotions on online purchases during COVID-19 [8]. Yang et al. aimed to investigate the causes that influence consumer emotions and found that negative reviews have a significant impact on online shopping [9].
There are also some research papers done in recent years investigating the factors that influence consumer behavior and hence affect e-commerce turnover. Koufaris et al. examined how consumer experience influenced their intention to make unplanned purchases and concluded that shopping enjoyment has no significant impact on unplanned purchases [10]. Udo and Marquis sampled the opinions of consumers toward commercial websites and their behavior when they were using those websites to find out the factors that influence websites' effectiveness and hence affect e-commerce turnover [11]. Moe and Fader developed a model that forecasts each customer's likelihood of purchase based on their previous visits and purchases [12]. The model performed well statistically and provided proper managerial diagnostics for different online consumer behavior. Ranganathan and Jha suggested an integrated model of online consumer behavior with four factors that may affect purchase intention[13]. They claimed that past online shopping experience seems to have an immense impact on that. Chaudhary showed the change in consumer behaviors for both new and old commercial website users due to COVID-19 in India and the shift from offline retail stores to online shopping [14]. Amsari et al. aimed to find out the causes of consumer behavior and how that would affect the decisions made by consumers during the COVID-19 pandemic [15].
Zhang et al. examined the influence of emotions on consumer purchase intention in the context of e-commerce through personal emotion injection [16]. Mostafa used sentiment analysis (S.A.) for online opinion mining and comment extraction and obtained sentiment scores on different sentiments [17]. Kim et al. collected information about iPhone6 and GalaxyS5 review tweets to analyze the purchasing power and competitiveness of the market through natural language processing [18]. Chang et al. analyzed the impact of customer comments on Twitter online [19]. Ibrahim and Wang focused on the performance of the online retail business by examining comments on social media and suggested guidelines for company business improvement [20]. Chen et al. used mining text and combined it with natural language processing to classify the masses' thought cues and sentiments in a wide range of domains [21].
A significant number of previously conducted studies have investigated the factors that influence the behavior of customers and the volume of business conducted online. However, research in the field of how the attitude gleaned from social media will affect the behavior of customers when they are shopping online is still insufficient. As a result, the primary objective of this study is to investigate how the purchasing power of e-commerce platforms can be deduced from user reviews, and we decided to focus on Amazon's Kindle.
3. Data
The data used in this article is a subset of Amazon Kindle Store classified product reviews provided by Kaggle. This dataset contains 982,618 observations of data from May 1996 to July 2014. As it claims, each reviewer has at least five reviews, and each product has at least five reviews in this dataset. As it claims, each review includes the following information: 1) asin; 2) helpfulness; 3) rating; 4) review text; 5) time of the review; 6) reviewer ID; 7) reviewer name; 8) summary; 9) unixReviewTime.
The raw data structure is as follows (table 1):
Table 1. Fields
Field | Description |
asin | I.D. of the product, like B000FA64PK |
helpful | helpfulness rating of the review |
rating | rating of the product |
reviewText | text of the review (heading). |
reviewTime | time of the review (raw). |
reviewerID | I.D. of the reviewer |
reviewerName | name of the reviewer. |
summary | summary of the review (description). |
unixReviewTime | unix timestamp |
Note: This table shows all fields and their descriptions from the XYZ dataset which contained 982618 between May 1996 and June 2014
According to the dataset, the ratings within reviews are mostly five stars (out of 5), with 0 stars being the least, which accounted for 58.54% and 2.34 of the total number of reviews, respectively (Figure 1). The average rating score is 4.52, with the ideal rating range customers are more likely to purchase [22].
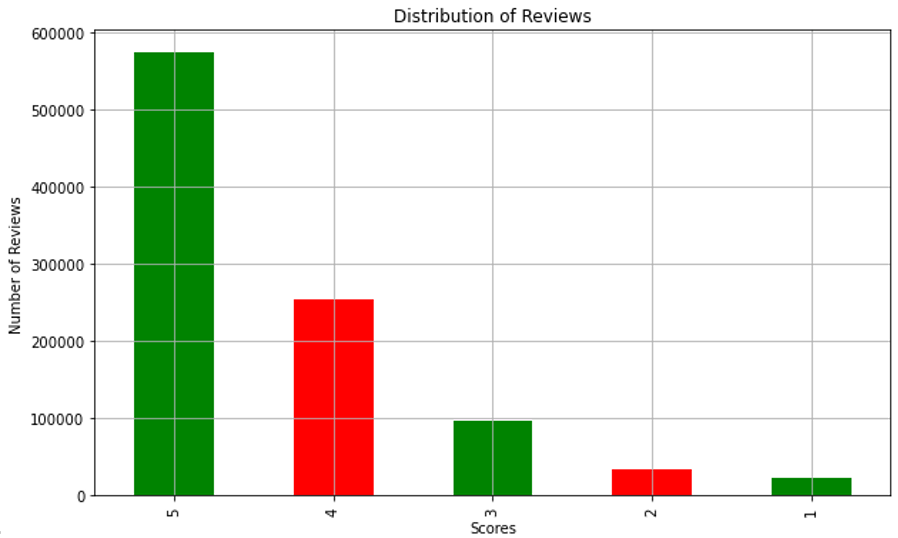
Figure 1. Review rating distribution in the dataset
Assume that the overall number of product reviews can estimate the average sales of products of the same category, like books.
Products with reviews of less than 100 constitute 98.9% of the sample. Product samples with more than 300 reviews were screened out from the dataset to select the best-selling products. So, the dataset contains 26 product samples. The dataset is then split per book into smaller sets to analyze each book separately. The distribution of total product reviews is shown in figure 2 below.
After products with a total number of reviews greater than 300 were screened, the filtered dataset is as follows:
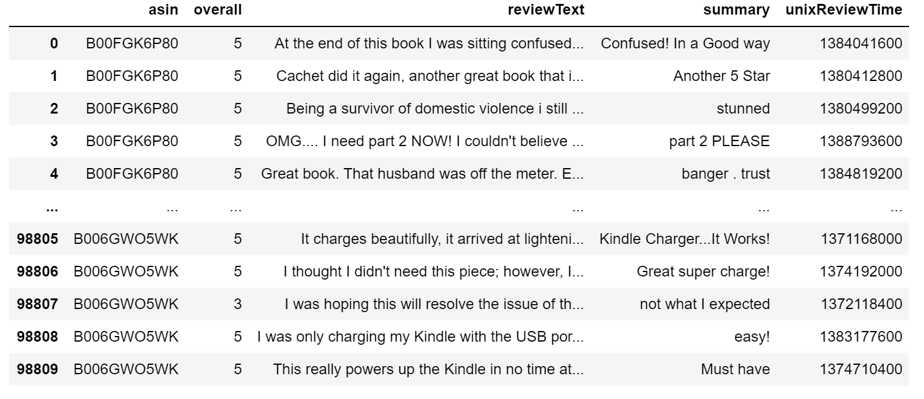
Figure 2. Filtered dataset
4. Methodology
This paper processed the reviews dataset in a unique way to let the reviews represent sales. A model was then presented for sentiment analysis and sales prediction. Overall, it includes three stages of data processing (data labeling, text processing, feature extraction), sentiment analysis (choosing a dictionary, word matching, and sentiment scoring), and machine learning (multiclass classification and model evaluation), as illustrated in Figure 3.
1. Data processing module: This step includes data labeling, text processing phrase, and feature extraction using TF-IDF. The sale influence factor was calculated by the relative change of reviews. The output of the processing module will be a feature matrix and target vector.
2. Sentiment analysis: This step performs sentiment score computation for sentiment token, using NRC Emotion Lexicon.
3. Machine learning: This step employs machine learning algorithms for sales prediction tasks.
A detailed description of these levels is provided in the following sections.
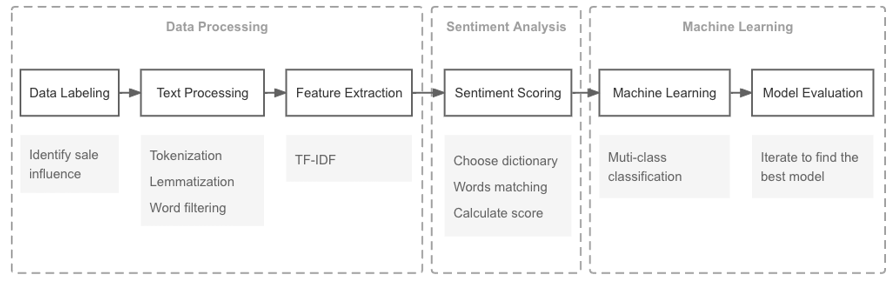
Figure 3. Proposed Research Framework
4.1. Data Processing
This section describes the steps required to generate the feature matrix and target vector from the Amazon Kindle book review dataset.
4.1.1. Data Labelling. As discussed in the previous section, the sale influence of reviews was measured by comparing the volume of reviews. We count the total number of product reviews in the following period for each review of different products and calculate the relative change compared to the previous week. Relative change higher than 20% with a quantity increase by more than 4 was considered as a ‘soar’, relative change greater than zero but not more than 15% than 3% as a 'small increase’, relative change less than -15% with a quantity decline by more than four as 'plummet', relative change less than zero but more than 15% than 3% as 'decline', and the rest as flat. These rates were then tagged from -2 to 2, as shown in Table 2.
Table 2. Levels of sale change
Field | Description | Tag |
Rate > 15% | soar | 2 |
3 < Rate ≤ 15% | small increase | 1 |
-3% < Rate < 3% | flat | 0 |
-15% ≤ Rate < 3% | small decline | -1 |
Rate < -15% | plummet | -2 |
4.1.2. Text Processing. All the sentences of the reviews were first tokenized into separate English words. NLTK tokenizer was used to tokenize the reviews. Tokenization is the process of breaking down lengthy input sentences into a sequence of smaller linguistic units known as tokens, which can be things like words, numbers, punctuation, or other meaningful elements. This process is the foundation of natural language processing as its accuracy of it directly determines the quality of lexical annotation, syntactic analysis, word vectors, and text analysis [23]. Tokenization is a process that is relatively straightforward and accurate for the English language because the words have already been separated by blank spaces. However, for other languages, such as Chinese, the process would be more complicated because dictionaries or statistics would need to be incorporated to obtain good results. Because the combination of letters in these non-segmented languages might alter the meaning of words, the text needs to be compared against a significant amount of data to differentiate between words consisting of one character and words consisting of many characters [24].
In English, many words have multiple meanings; therefore, the root form of words is not necessarily a word by itself. To resolve this ambiguity of words, POS tagging was then performed to categorize words in a text in correspondence with a particular part of speech. In natural language processing, part-of-speech (POS) taggers have been developed to classify words based on their parts of speech [25]. This process is determined according to the different parts of speech of each word. For sentiment analysis, the POS tagger is very useful. Because words such as nouns and pronouns usually contain no emotion, they can be ignored in the process. In addition, POS taggers can be used to distinguish between words that can be used in different parts of speech. For example, as a verb, "enhanced" as an adjective can express different levels of emotion. The POS tag used in this study is the maximum entropy POS tag developed for the Penn Treebank project. This tagger can provide a vast number of tags and can identify syntactic roles in more detail.
After POS tagging, lemmatization is utilized to make the words reduce to their roots. Lemmatization groups different inflected forms of a word so they can be analyzed as a single item like "are" is reduced to "be". This technique is essential since it ensures that the subsequent analyses will be more precise [26].
To extract sentiment words more effectively and avoid unnecessary effects of irrelevant characters, word filtering is needed. Stopwords are the type of words that are unlikely to be useful for text mining. Stopwords are often words that have no practical meaning when used alone. They are primarily conjunctions, prepositions, and coronals, e.g., "a", "an", and "is" [23]. In this experiment, a stopwords table (Table 3) containing 851 deactivated words is used. The stopwords table is loaded into the experiment to remove the stopwords. The following table shows some of the data from the stopwords table [27].
Table 3. Stopwords table
Index | Stopword |
1 | a |
2 | able |
3 | about |
4 | above |
5 | abroad |
6 | abst |
Note: This table is an example of the words in the nltk.stopwords list
4.1.3. Vectorization. The term frequency-inverse document frequency (also known as TF-IDF) is a statistical measure that determines how relevant a word is to a document within a collection of documents. The TF-IDF algorithm is handy for word rating in machine learning. Therefore, it is also beneficial for information retrieval. T.F. (word frequency) refers to the number of times a word (Formula 1) is used in each document. The original number of words needs to be divided by the total number of words, as the length of the paper can vary greatly. IDF (inverse document frequency) indicates how common a term is within a corpus, where the corpus simulates a language-using environment [28]. IDF can be calculated (Formula 2) by taking the logarithm of the total number of documents in the corpus divided by the number of documents containing a specific word plus one. To prevent the total number of papers containing this word from being equal to zero, a one is added to the denominator.
\( TF= \frac{{n_{i}}}{\sum {n_{i}}} \) (1)
\( {n_{i}} \) : The number of times a word appears in an article
\( \sum {n_{i}}: \) The total number of words in this article
\( IDF=log\frac{|D|}{|j: {t_{j}}∈ {d_{j}}|+1} \) - (2)
\( |D| \) : The total number of files in the corpus
\( |j: {t_{j}}∈{d_{j}}| \) : The total number of articles containing this word
\( TF-IDF=TF*IDF \) (3)
TF stands for word frequency and IDF stands for inverse document frequency, which refers to the logarithm of the quotient of the total number of texts and the number of texts containing the word. So, the product of these two is the weight of the feature number. As a result, a lower value for the IDF indicates that the term appears more frequently in the corpus, indicating that it may not be as significant to the document. The value of TF-IDF is using the value of T.F. times the value of IDF; hence, the higher the value of TF-IDF, the more influential the word is to the document.
4.2. Sentiment analysis
After the text has been processed and its features extracted, the next important step is to extract sentiments from the polarity and subjectivity of the words. Our research employs a lexicon-based technique to score the words and phrases. Within this methodology, dictionaries are used by providing seed words that are used to grow the list of terms [29].
4.2.1. NRCLex. The dictionary used in our experiment is called NRCLex (or NRCLexicon), and it was developed by Mark M. Bailey as an MIT-approved PyPI (python package index) project. About 27,000 words make up this emotional lexicon, and each one is arranged according to one of eight emotion categories (anger, fear, anticipation, trust, surprise, sadness, joy, and disgust), as well as two sentiment categories: negative and positive [30].
4.2.2. Words matching. In computer science, fuzzy string matching is a technique for finding strings that approximate (but not exact) matching patterns. In other words, texts can be recognized even if there are misspelled words or only partly entered words. It is also called approximate string matching. For example, even if the text contains misspellings such as "lov", it will find a match. In other words, the text after such preprocessing can be better recognized by the machine.
4.2.3. Calculate score. This module computes emotion scores. In most cases, the retrieval of slang definitions from the web requires preprocessing, that is, retrieving the semantic score of the preprocessed text. The sentiment score was calculated in the following way. First, three values are associated with each syntactic set of the text, namely pos (w), neg (w), and obj (w), and the sum of the three values equals one [31]. The average emotion scores of pos (w), neg (w), and obj (w) calculated according to the pos can be used for sentiment analysis. To make the rating more flexible, some positive, negative, or neutral comments containing the target text will also be considered. If (w) is less than the threshold (0.5), the word is considered positive or negative. The positive difference between pos (w) and neg (w) indicates a positive word and vice versa. The overall mood scoring formula and its composition are as follows.
\( pscore(w)= \sum _{i=1}^{n}pos({s_{i}})/n \) (4)
\( nscore(w)= \sum _{i=1}^{n}neg({s_{i}})/n \) (5)
\( oscore(w)= \sum _{i=1}^{n}obj({s_{i}})/n \) (6)
Where wi represents the ith word and m is the number of specific words. The term pf represents the percentage of positive comments in the selected text, and nf represents the percentage of negative comments. The scoring algorithm is shown in Frmula3 below.
\( Score(text)=(\sum _{i=1}^{m}pscore({w_{i}})+pf)-(\sum _{i=1}^{n}nscore({w_{i}})+nf) \) (7)
4.3. Machine Learning
4.3.1. Use of time lag. The dataset is split up by productID for further analysis. We included time lag while building the prediction formula to test if the influence of the product reviews is either immediate or delayed by a certain period.
4.3.2. Classification algorithm. The naive Bayes algorithm is a simple probability computing machine based on Bayes' theorem. Calculate the conditional probability of time A given that event B has occurred.
The Bayes formula for this probability is
\( P(Ai|B) = P(Ai)P(B|Ai)p(B) \) (8)
According to the above formula, we can further simplify the formula to obtain
\( P(Ai|B) = j=1nP(Bj|Ai) \) (9)
With this algorithm, we extend it to our experiments to calculate the corresponding error values.
5. Result
5.1. Reviews Distribution
In this section, cross-correlation function was applied to check that time lags between variables are the strongest concept linking the impact of reviews to underlying sales fluctuations. In addition, to reduce the impact of the buying frenzy, we further selected the top 10 hottest products with the most sales records. As shown in Table 4, each product model and time delay were found to have the strongest correlation.
Table 4. Optimal time lags and correlations per product model
Productid | Variable | Time lag | Corr |
B00FGFYIS4 | PNrate, Sale | 6 | 0.53 |
Rating, Sale | 3 | 0.32 | |
B006GWO5WK | PNrate, Sale | 6 | 0.83 |
Rating, Sale | 5 | 0.43 |
The time lag varies for each product. It is clear that six days would be the fittest time lag for our research. We might be able to say that in our case, the reviews left around six days ago would generate a sales fluctuation.
5.2. Sentiment scoring
The NRC Lexicon (DRCLex) to measure the emotional effect of a body of text [32]. This dictionary measures every word from ten emotion categories (anger, fear, anticipation, trust, surprise, positive, negative, sadness, joy, and disgust). For the given data, we directly found that positive emotion accounts for 26.86% of the words as the primary emotion, as shown in figure 4.
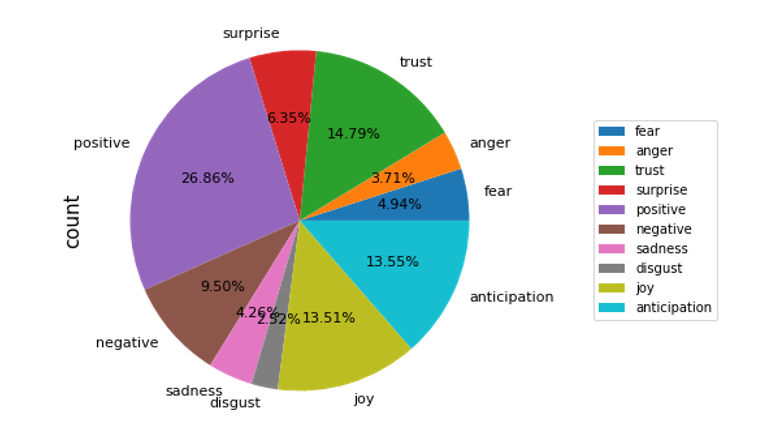
Figure 4. Emotion proportion chart
We plot a correlation heat map to find the correlation among those ten emotion categories. In figure 5, each square shows the correlation between the variables on each axis. Values closer to zero mean there is no linear trend between the two variables. Anger and disgust are the most related emotions, with a value of 0.4.
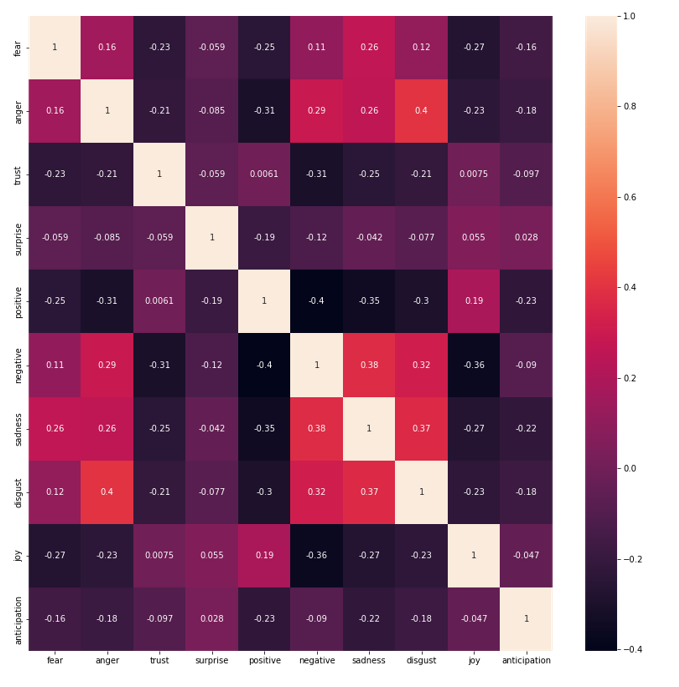
Figure 5 - Emotion correlation heatmap
5.3. Sales prediction by multiclass classification
This section present our experiments and results for two separate classification tasks: 1) Sale up versus Sale down and 2) Sale-soar, Small-sale-increase, flat, and small sale decline, or Sale plummet. For each of the classification tasks, we present three models, as well as results for combinations of these models:
1. Decision tree model
2. SVM model
3. Naive Bayes model
We apply the Decision tree model, Naive Bayes, and SVM algorithms to predict sales. First, we defined the proportion of the training set and test set and selected 80% of the data as the training set and 20% of the data as the test set. After the model finishes learning through the training set, according to the emotional analysis results of each comment in the test set, the change in sales volume after each comment in the test set is predicted, and the prediction results are obtained. Then the prediction results are compared with the information to obtain the accuracy of the model prediction. The best prediction accuracy can be obtained after continuously adjusting parameters.
Finally, we get the best accuracy of those prediction models as follows: the prediction accuracy of the Decision Tree is 0.72, and the prediction accuracy of SVM and Naive Bayes is 0.68 and 0.69, respectively. There is little difference in the prediction effect between the two, with the prediction accuracy around 0.7. The effect is not very ideal. The prediction accuracy of the Decision Tree is slightly better.
Table 4. Model accuracy table
Algorithm | Accuracy |
Decision Tree | 0.72 |
Support Vector Machine | 0.68 |
Naive Bayes | 0.69 |
6. Conclusion
We analyzed the relationship between the sentiment in product reviews and the future sales of products and established three prediction models to analyze the future sales of products. Finally, we evaluated the three models and selected the best model.
First, we obtained relevant data, including nearly one million comments, covering the period from 1996 to 2014.
After data processing steps such as text processing and feature extraction, we conduct sentiment Analysis on text data. After analyzing the text with the NRCLex dictionary, we used Decision Tree, SVM, and naive Bayes to build prediction models. Finally, we choose accuracy as our model evaluation index, and the Decision Tree model achieves 72% accuracy, which is the best model.
Although the performance of our model is not very ideal, we can still think that there is a correlation between the sentiment in product reviews and the future sales of products. We will further adjust our model structure and parameters to improve the accuracy of our model.
References
[1]. SSSD, A. M. R. (2012, May 24). U.S. Census Bureau monthly & annual retail trade. United States Census Bureau. Retrieved Oct. 21, 2022, from https://www.census.gov/retail/index.html
[2]. Mudambi, Susan M. and David Schuff (2010), “What Makes a Helpful Online Review? A Study of Customer Reviews on Amazon.Com,” MIS Quarterly, 34 (March), 185–200.
[3]. Lee, Pui-Mun. "Behavioral model of online purchasers in e-commerce environment." Electronic Commerce Research 2.1 (2002): 75-85.
[4]. Koyuncu, Cuneyt, and Donald Lien. "E-commerce and consumer's purchasing behaviour." Applied Economics 35.6 (2003): 721-726.
[5]. Zhang, Yanrong, et al. "Sentiment analysis of e-commerce text reviews based on sentiment dictionary." 2020 IEEE International Conference on Artificial Intelligence and Computer Applications (ICAICA). IEEE, 2020.
[6]. Benlian, Alexander, Ryad Titah, and Thomas Hess. "Differential effects of provider recommendations and consumer reviews in e-commerce transactions: An experimental study." Journal of Management Information Systems 29.1 (2012): 237-272.
[7]. Lu, Yunfan, Yaobin Lu, and Bin Wang. "Effects of dissatisfaction on customer repurchase decisions in e-commerce-an emotion-based perspective." Journal of electronic commerce research 13.3 (2012): 224.
[8]. Guthrie, Cameron, Samuel Fosso-Wamba, and Jean Brice Arnaud. "Online consumer resilience during a pandemic: An exploratory study of e-commerce behavior before, during and after a COVID-19 lockdown." Journal of Retailing and Consumer Services 61 (2021): 102570.
[9]. Yang, Luming, Min Xu, and Lin Xing. "Exploring the core factors of online purchase decisions by building an E-Commerce network evolution model." Journal of Retailing and Consumer Services 64 (2022): 102784.
[10]. M. Koufaris, A. Kambil, and P. A. Labarbera, “Consumer Behavior in Web-Based Commerce: An Empirical Study,” null, vol. 6, no. 2, pp. 115–138, Dec. 2001, doi: 10.1080/10864415.2001.11044233.
[11]. G. J. Udo and G. P. Marquis, “Factors Affecting E-Commerce Web Site Effectiveness,” null, vol. 42, no. 2, pp. 10–16, Jan. 2002, doi: 10.1080/08874417.2002.11647481.
[12]. W. W. Moe and P. S. Fader, “Dynamic Conversion Behavior at E-Commerce Sites,” Management Science, vol. 50, no. 3, pp. 326–335, Mar. 2004, doi: 10.1287/mnsc.1040.0153.
[13]. C. Ranganathan and E. Grandon, “An Exploratory Examination of Factors Affecting Online Sales,” null, vol. 42, no. 3, pp. 87–93, Mar. 2002, doi: 10.1080/08874417.2002.11647507.
[14]. H. Chaudhary, “Analyzing the Paradigm Shift of Consumer Behavior Towards E-Commerce During Pandemic Lockdown,” SSRN Journal, 2020, doi: 10.2139/ssrn.3664668.
[15]. S. Amsari and D. P. Sari, “CONSUMER FACTORS IN DECIDING TO PURCHASE ONLINE AT SHOPEE E-COMMERCE DURING THE COVID-19 PANDEMIC,” Proceeding International Seminar of Islamic Studies, vol. 3, no. 1, Art. no. 1, Mar. 2022.
[16]. Zhang, Hanpeng, et al. "Mood and social presence on consumer purchase behaviour in C2C E-commerce in Chinese culture." Electronic Markets 22.3 (2012): 143-154.
[17]. Mostafa, Mohamed M. "More than words: Social networks’ text mining for consumer brand sentiments." Expert systems with applications 40.10 (2013): 4241-4251.
[18]. Kim, Yoosin, et al. "Competitive intelligence in social media Twitter: iPhone 6 vs. Galaxy S5." Online Information Review (2016).
[19]. Chang, Yung-Chun, Chih-Hao Ku, and Chun-Hung Chen. "Social media analytics: Extracting and visualizing Hilton hotel ratings and reviews from TripAdvisor." International Journal of Information Management 48 (2019): 263-279.
[20]. Ibrahim, Noor Farizah, and Xiaojun Wang. "Decoding the sentiment dynamics of online retailing customers: Time series analysis of social media." Computers in Human Behavior 96 (2019): 32-45.
[21]. Chen, Liang-Chu, Chia-Meng Lee, and Mu-Yen Chen. "Exploration of social media for sentiment analysis using deep learning." Soft Computing 24.11 (2020): 8187-8197.
[22]. Team, P. R. (2019, Feb. 15). Northwestern study vol. 1: How reviews impact sales. PowerReviews. Retrieved Oct. 22, 2022, from https://www.powerreviews.com/insights/from-reviews-to-revenue-nwu/
[23]. T. Verma, R. Renu, and D. Gaur, “Tokenization and Filtering Process in RapidMiner,” IJAIS, vol. 7, no. 2, pp. 16–18, Apr. 2014, doi: 10.5120/ijais14-451139.
[24]. N. Madnani, “Getting started on natural language processing with Python,” XRDS, vol. 13, no. 4, pp. 5–5, Jun. 2007, doi: 10.1145/1315325.1315330.
[25]. D. Roth and D. Zelenko, “Part of Speech Tagging Using a Network of Linear Separators,” presented at the COLING 1998, 1998. Accessed: Aug. 01, 2022. [Online]. Available: https://aclanthology.org/C98-2181
[26]. A. G. Jivani, “A Comparative Study of Stemming Algorithms,” vol. 2, p. 9, 2011.
[27]. NLTK stop words. pythonspot. (2021, Jul. 22). Retrieved Oct. 22, 2022, from https://pythonspot.com/nltk-stop-words/
[28]. A. Aizawa, “An information-theoretic perspective of tf–idf measures,” Information Processing & Management, vol. 39, no. 1, pp. 45–65, Jan. 2003, doi: 10.1016/S0306-4573(02)00021-3.
[29]. Ahmed, Khaled, Neamat El Tazi, and Ahmad Hany Hossny. "Sentiment analysis over social networks: an overview." 2015 IEEE international conference on systems, man, and cybernetics. IEEE, 2015.
[30]. Khoo, Christopher SG, and Sathik Basha Johnkhan. "Lexicon-based sentiment analysis: Comparative evaluation of six sentiment lexicons." Journal of Information Science 44.4 (2018): 491-511.
[31]. Miller, George A., et al. "Introduction to WordNet: An online lexical database." International journal of lexicography 3.4 (1990): 235-244.
[32]. Mark M. Bailey. 2019. NRCLex. https://github.com/metalcorebear/NRCLex(2022)
Cite this article
Wang,X.;Jin,X.;Wu,Y.;Liao,Y.;Lei,D. (2023). Predicting product sales based on sentiment analysis using reviews: The case of Amazon's kindle. Applied and Computational Engineering,6,1641-1651.
Data availability
The datasets used and/or analyzed during the current study will be available from the authors upon reasonable request.
Disclaimer/Publisher's Note
The statements, opinions and data contained in all publications are solely those of the individual author(s) and contributor(s) and not of EWA Publishing and/or the editor(s). EWA Publishing and/or the editor(s) disclaim responsibility for any injury to people or property resulting from any ideas, methods, instructions or products referred to in the content.
About volume
Volume title: Proceedings of the 3rd International Conference on Signal Processing and Machine Learning
© 2024 by the author(s). Licensee EWA Publishing, Oxford, UK. This article is an open access article distributed under the terms and
conditions of the Creative Commons Attribution (CC BY) license. Authors who
publish this series agree to the following terms:
1. Authors retain copyright and grant the series right of first publication with the work simultaneously licensed under a Creative Commons
Attribution License that allows others to share the work with an acknowledgment of the work's authorship and initial publication in this
series.
2. Authors are able to enter into separate, additional contractual arrangements for the non-exclusive distribution of the series's published
version of the work (e.g., post it to an institutional repository or publish it in a book), with an acknowledgment of its initial
publication in this series.
3. Authors are permitted and encouraged to post their work online (e.g., in institutional repositories or on their website) prior to and
during the submission process, as it can lead to productive exchanges, as well as earlier and greater citation of published work (See
Open access policy for details).
References
[1]. SSSD, A. M. R. (2012, May 24). U.S. Census Bureau monthly & annual retail trade. United States Census Bureau. Retrieved Oct. 21, 2022, from https://www.census.gov/retail/index.html
[2]. Mudambi, Susan M. and David Schuff (2010), “What Makes a Helpful Online Review? A Study of Customer Reviews on Amazon.Com,” MIS Quarterly, 34 (March), 185–200.
[3]. Lee, Pui-Mun. "Behavioral model of online purchasers in e-commerce environment." Electronic Commerce Research 2.1 (2002): 75-85.
[4]. Koyuncu, Cuneyt, and Donald Lien. "E-commerce and consumer's purchasing behaviour." Applied Economics 35.6 (2003): 721-726.
[5]. Zhang, Yanrong, et al. "Sentiment analysis of e-commerce text reviews based on sentiment dictionary." 2020 IEEE International Conference on Artificial Intelligence and Computer Applications (ICAICA). IEEE, 2020.
[6]. Benlian, Alexander, Ryad Titah, and Thomas Hess. "Differential effects of provider recommendations and consumer reviews in e-commerce transactions: An experimental study." Journal of Management Information Systems 29.1 (2012): 237-272.
[7]. Lu, Yunfan, Yaobin Lu, and Bin Wang. "Effects of dissatisfaction on customer repurchase decisions in e-commerce-an emotion-based perspective." Journal of electronic commerce research 13.3 (2012): 224.
[8]. Guthrie, Cameron, Samuel Fosso-Wamba, and Jean Brice Arnaud. "Online consumer resilience during a pandemic: An exploratory study of e-commerce behavior before, during and after a COVID-19 lockdown." Journal of Retailing and Consumer Services 61 (2021): 102570.
[9]. Yang, Luming, Min Xu, and Lin Xing. "Exploring the core factors of online purchase decisions by building an E-Commerce network evolution model." Journal of Retailing and Consumer Services 64 (2022): 102784.
[10]. M. Koufaris, A. Kambil, and P. A. Labarbera, “Consumer Behavior in Web-Based Commerce: An Empirical Study,” null, vol. 6, no. 2, pp. 115–138, Dec. 2001, doi: 10.1080/10864415.2001.11044233.
[11]. G. J. Udo and G. P. Marquis, “Factors Affecting E-Commerce Web Site Effectiveness,” null, vol. 42, no. 2, pp. 10–16, Jan. 2002, doi: 10.1080/08874417.2002.11647481.
[12]. W. W. Moe and P. S. Fader, “Dynamic Conversion Behavior at E-Commerce Sites,” Management Science, vol. 50, no. 3, pp. 326–335, Mar. 2004, doi: 10.1287/mnsc.1040.0153.
[13]. C. Ranganathan and E. Grandon, “An Exploratory Examination of Factors Affecting Online Sales,” null, vol. 42, no. 3, pp. 87–93, Mar. 2002, doi: 10.1080/08874417.2002.11647507.
[14]. H. Chaudhary, “Analyzing the Paradigm Shift of Consumer Behavior Towards E-Commerce During Pandemic Lockdown,” SSRN Journal, 2020, doi: 10.2139/ssrn.3664668.
[15]. S. Amsari and D. P. Sari, “CONSUMER FACTORS IN DECIDING TO PURCHASE ONLINE AT SHOPEE E-COMMERCE DURING THE COVID-19 PANDEMIC,” Proceeding International Seminar of Islamic Studies, vol. 3, no. 1, Art. no. 1, Mar. 2022.
[16]. Zhang, Hanpeng, et al. "Mood and social presence on consumer purchase behaviour in C2C E-commerce in Chinese culture." Electronic Markets 22.3 (2012): 143-154.
[17]. Mostafa, Mohamed M. "More than words: Social networks’ text mining for consumer brand sentiments." Expert systems with applications 40.10 (2013): 4241-4251.
[18]. Kim, Yoosin, et al. "Competitive intelligence in social media Twitter: iPhone 6 vs. Galaxy S5." Online Information Review (2016).
[19]. Chang, Yung-Chun, Chih-Hao Ku, and Chun-Hung Chen. "Social media analytics: Extracting and visualizing Hilton hotel ratings and reviews from TripAdvisor." International Journal of Information Management 48 (2019): 263-279.
[20]. Ibrahim, Noor Farizah, and Xiaojun Wang. "Decoding the sentiment dynamics of online retailing customers: Time series analysis of social media." Computers in Human Behavior 96 (2019): 32-45.
[21]. Chen, Liang-Chu, Chia-Meng Lee, and Mu-Yen Chen. "Exploration of social media for sentiment analysis using deep learning." Soft Computing 24.11 (2020): 8187-8197.
[22]. Team, P. R. (2019, Feb. 15). Northwestern study vol. 1: How reviews impact sales. PowerReviews. Retrieved Oct. 22, 2022, from https://www.powerreviews.com/insights/from-reviews-to-revenue-nwu/
[23]. T. Verma, R. Renu, and D. Gaur, “Tokenization and Filtering Process in RapidMiner,” IJAIS, vol. 7, no. 2, pp. 16–18, Apr. 2014, doi: 10.5120/ijais14-451139.
[24]. N. Madnani, “Getting started on natural language processing with Python,” XRDS, vol. 13, no. 4, pp. 5–5, Jun. 2007, doi: 10.1145/1315325.1315330.
[25]. D. Roth and D. Zelenko, “Part of Speech Tagging Using a Network of Linear Separators,” presented at the COLING 1998, 1998. Accessed: Aug. 01, 2022. [Online]. Available: https://aclanthology.org/C98-2181
[26]. A. G. Jivani, “A Comparative Study of Stemming Algorithms,” vol. 2, p. 9, 2011.
[27]. NLTK stop words. pythonspot. (2021, Jul. 22). Retrieved Oct. 22, 2022, from https://pythonspot.com/nltk-stop-words/
[28]. A. Aizawa, “An information-theoretic perspective of tf–idf measures,” Information Processing & Management, vol. 39, no. 1, pp. 45–65, Jan. 2003, doi: 10.1016/S0306-4573(02)00021-3.
[29]. Ahmed, Khaled, Neamat El Tazi, and Ahmad Hany Hossny. "Sentiment analysis over social networks: an overview." 2015 IEEE international conference on systems, man, and cybernetics. IEEE, 2015.
[30]. Khoo, Christopher SG, and Sathik Basha Johnkhan. "Lexicon-based sentiment analysis: Comparative evaluation of six sentiment lexicons." Journal of Information Science 44.4 (2018): 491-511.
[31]. Miller, George A., et al. "Introduction to WordNet: An online lexical database." International journal of lexicography 3.4 (1990): 235-244.
[32]. Mark M. Bailey. 2019. NRCLex. https://github.com/metalcorebear/NRCLex(2022)