


1. Introduction
As the cost of disk gets lower and lower, and as large enterprises generate more and more data, companies are starting to put data. The evolution of Big Data technology has become increasingly sophisticated. The evolution of big data technology is now becoming more mature. First, in terms of technical architecture, a whole series of technical frameworks for big data have been formed in terms of data storage, data collection, data analysis, data visualization, data management and data application [1], and the related technical ecology is also being improved. In general, the current technology has formed the basis for the rapid development and application innovation in the big data industry. Second, the industry chain within the big data ecosystem is constantly improving and evolving, and there are also companies focusing on niche areas, e.g., some focus on data security storage, some focus on data analytic, and some focus on data applications. This flourishing of the entire industry chain provides a solid foundation for the continued adoption of big data technology in life and industry.
Essentially, this platform consists of three modules: data collection, data warehouse, and data visualization. Global Internet users browse a large number of websites. It is necessary to store this log data in a distributed big data file system. Using Hadoop's HDFS file system, we store the data here. Building a data warehouse based on Hive requires mapping these logs into one table in order to facilitate data analysis. The purpose is to improve the performance of data processing. MR computing framework or Spark engine will be used for data processing. MR computing framework or Spark cluster will be used for all applications to ensure high-performance data processing. To visualize the data quickly, we will use superset. We will integrate spring boot + mybatis frameworks for the business logic portion of the project, as well as separate the front-end and back-end.
2. Literature Review
2.1. Research Process Direction
The massive use of the Internet by over four billion Internet users worldwide has created a growing demand for behavioral data analysis. We investigate and design a Hive-based big data platform that processes and analyzes entire processes as part of an in-depth analysis of Hadoop's big data ecology, accompanied by a dramatic demonstration of how big data is used in real-world production environments. For peak shaving and decoupling, Flume and Sqoop are used to collect log data and business data unified, while Kafka serves as a buffer for Flume [2]. A custom interceptor on the first Flume layer is used for simple data cleansing, intercepting unformatted Json strings to prevent Hive post-order parsing. The second Flume layer also has a custom interceptor to prevent the "zero drift" problem when collecting data. The Hadoop framework uses the HDFS distributed file system as the storage medium to increase the reliability of the data. Hive is used as a framework for data warehouse modeling with judicious design of hierarchy and table structure as well as selection of appropriate fields and construction of corresponding tables to facilitate subsequent analysis and retrieval of data; Hive uses Spark as execution engine to speed up the execution of queries. Use EasyV ,superset as a visualization tool to facilitate viewing and analysis of various metrics.
2.2. Theoretical Framework
2.2.1. 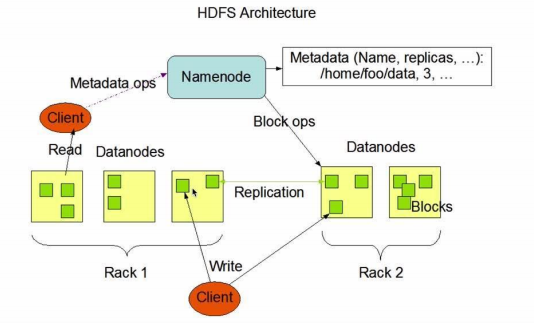 Hadoop Framework. Hadoop is a distributed systems infrastructure developed by the Apache Foundation. Users can develop distributed applications without understanding the underlying details of the distribution. Hadoop implements a distributed file system, one component of which is HDFS (Hadoop Distributed File System). HDFS is highly fault-tolerant and designed to be deployed on low-cost hardware, and it provides high-speed access to application data, which is suitable for applications with large data sets. The core design of the Hadoop framework is HDFS and Map Reduce, which allows for the storage of large data sets, and Map Reduce allows for the computation of large data sets. The details are shown in Figure 1:
Figure 1. HDFS architecture.
2.2.2. Hive Framework. Hive is a data warehouse tool that Facebook has made open source for processing large volumes of structured log files. Hive is based on Hadoop and provides easy access to data via HQL for data warehousing tasks such as extract/transform/load (ETL) and data analysis. It can be used to map structured data files into a table by accessing files stored directly in HDFS or other data storage systems such as HBase [3]. By default, it uses MapReduce. Hive is not suitable for online transaction processing and does not allow real-time search, and is best suited for offline batch computing with large amounts of immutable data. It is best suited for offline batch computing scenarios with large amounts of immutable data [4]. The details are shown in Figure 2:
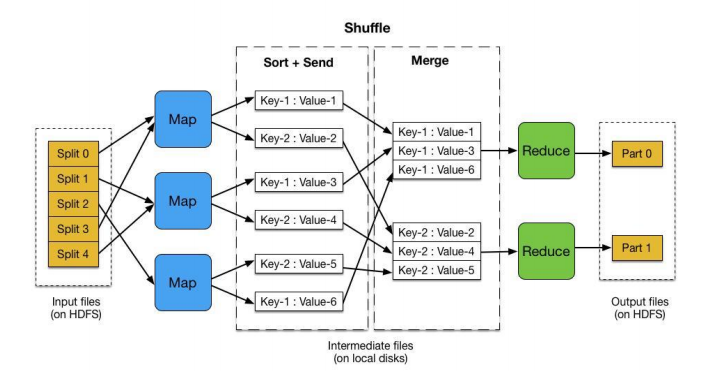 Figure 2. Map reduce data processing flow.
2.2.3. Spark. Spark is a big data framework designed to handle large amounts of data quickly, easily, and with complex analysis. A Scala-based project, Spark was born at UC Berkeley's AMPLab in 2009. In comparison to MapReduce, it is better suited to low-latency scenarios [5]. Spark has several features: (1) Fast. It is over 100 times faster to calculate in memory with Spark than with Hadoop. By storing intermediate computation results in memory, Spark implements an efficient DAG execution mechanism, which allows it to process data streams faster [6]. (2) Ease of use: Spark supports not only Scala but also Java and Python APIs, allowing developers of different languages to easily create a wide variety of applications. (3) Compatibility: Spark can be used with many other frameworks, including Yarn or Mesos for Hadoop's resource manager and scheduler, as well as for Hadoop's data sources, including HDFS and HBase. Both yarn-client and yarn-cluster modes are available in Yarn mode, with the main difference being the node on which the Driver program runs. In yarn-cluster mode, the Driver runs on an APPMaster running ResourceManager, which is appropriate for production environments. Let's use yarn-cluster mode to illustrate Spark's execution flow. First, you submit a job using the spark-submit footer. This starts the Spark Submit process, which registers the job to the Resource Manager, which assigns the Application Master to the Node Manager for the job, which starts the driver Application Master starts the driver, Application Master completes job initialization, the driver generates a DAG graph, the DAG scheduler breaks the DAG into stages and sends them to the task scheduler, Application Master requests resources from RM, and Resource Manager returns the exec. Resource Manager returns executor information, Application Master launches the appropriate executor via rpc, Excutor requests the task from Driver, Task Scheduler sends the task to Excutor, Executor executes the task, and the result is written externally or returned to Driver. The result is written externally or returned to the Driver side [7].
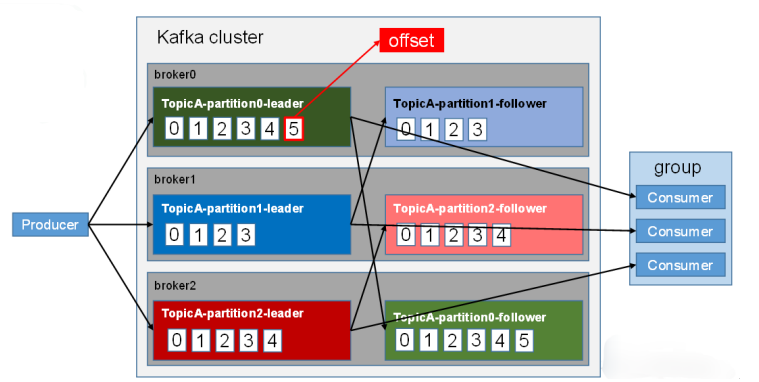 Figure 3. Kafka architecture.
2.2.4. Kafka. Kafka is an open-source stream processing platform developed by the Apache Software Foundation and written in Scala and Java. Kafka is a high-performance, distributed publish-and-subscribe messaging system that handles all the action stream data taken by consumers on a website. Such actions (web browsing, searching, and other user actions) are a key element of many social functions on today's web. This data is often handled by log processing and log aggregation because of bandwidth requirements. It is a viable solution for log data and Off-line analysis system such as Hadoop, but with the limitations associated with the need for real-time processing. Kafka is designed to combine online and offline message processing through the Hadoop parallel loading mechanism, and to provide real-time messaging across clusters. The details are shown in Figure 3.
2.2.5. Data Warehouse. Data Warehouse was introduced by the father of data warehousing, Bill Ember, in his 1991 book "Building the Data Warehouse".Data Warehouse is a strategic collection that provides all types of data to support all decision making processes in an enterprise [8]. By analyzing the data in the data warehouse The analysis of data in the data warehouse can provide guidance for business process improvement, monitoring time, and controlling cost and quality for enterprises that need business intelligence. The data warehouse is not the final destination of the data, but rather it is the final destination of the data by cleansing, paraphrasing, reorganizing, merging, splitting, and reusing the data. Reorganization, merging, splitting, statistics to prepare the data for its final destination such as data visualization, user profiling, data mining, etc.
2.3. Feasibility Analysis
2.3.1. Technical Feasibility. The Big Data space already has a number of well-established technical frameworks that are stable, bug-free, environmentally friendly, and used on a large scale in enterprises, such as Hadoop, Spark, and Hive, which are used in this platform. Of course, if you need to replace them with other frameworks in the future, there are very versatile and similar frameworks on the market.
2.3.2. Benefit Feasibility. The current traditional database carries a small amount of data, the data is often updated in real time cannot query the historical data, the lack of necessary links between various data, the efficiency of data analysis is too low and cannot achieve large-scale data analysis. After building a data warehouse, we trade space for time, simplify complex problems by building a multi-layer model, and each layer handles different simple tasks, so that users can easily query data, and can also easily locate problems and query the relationship of data.
2.3.3. Economic Feasibility. At the development level, the frameworks used in this platform are open source and free of charge, reducing purchase funds, and only simple operation and maintenance are required, but the benefits brought are great, reducing labor costs through a one-stop platform. By analyzing various indicators and developing suitable strategies to meet the individual needs of different users, it helps to increase user stickiness, improve repurchase rates, and tap potential users and markets from the data.
2.3.4. Technical Advantages. (1) Reliability: As a result of the distributed architecture, server downtime can affect each component abnormally. A certain level of reliability is required for the platform. When some services or environment problems occur, it is essential to be able to throw exceptions in time, save the error log to a text file, and allow users to query, locate, and resolve errors in order to ensure the integrity of information flow and smooth operation of the platform. (2) Scalability: Platforms aren't set in stone after they are built, they need to be improved and optimized over time. It would be necessary to consider the scalability of the platform when designing it at the beginning, for example when replacing old servers with new ones, replacing the framework, etc. (3) Ease of use: Platforms should be designed using the frameworks commonly used on the market and the operation steps should be optimized to reduce staff learning costs and improve user experience.
3. Methodology
3.1. Platform Design
The data collection module implements two main requirements: importing business data from MySQL into HDFS and importing log data generated by external sites into HDFS.To import business data from MySQL into HDFS, we use the Sqoop framework, which is a framework for transferring data between relational databases and HDFS and is part of the Hadoop ecosystem. It translates import and export commands into MapReduce programs, communicating with the database via JDBC, and the entire process is fully automated for efficient data transfer. To import business data into HDFS, we chose the Flume and Kafka frameworks and designed a two-tiered Flume middle with a Kafka cluster. The first tier uses multiple Flumes to collect log files from multiple log servers, which requires the ability to monitor multiple log folders and shut them down in case of failure. The first layer uses multiple Flumes to collect log files from multiple log servers, which requires the ability to monitor multiple log folders and be able to periodically migrate them after a failure. The second layer collects data from the first layer of Flumes and transfers it to HDFS without creating a large number of small files, which would affect HDFS performance, and compresses the data to reduce disk and network I/O usage. This could lead to denial of service and network congestion due to too many messages. So we added a Kafka cluster as a buffer between the two Flume layers.
3.2. Platform Implementation
3.2.1. Data Acquisition Implementation. After the whole platform is built, we can start the Hadoop cluster, Zookeeper cluster, Kafka cluster, collection layer Flume and consumption layer Flume by executing each script in turn, then write and run the log data generation program to generate simulated log data. Then we can go to the web-side page of the HDFS file system to see if the log data is captured to disk. We also run the business data generation program to generate the simulated business data. Then we start the Sqoop import business data script to import the simulated data from Mysql to HDFS.A large amount of log data is generated when Internet users browse websites, such as the model, system, brand of the device used, the name of the browser used, the city where they are located, etc. These data are obtained through burial and then stored in JSON format. These data are obtained through burial and then stored in JSON format in the log server. One row of data is one visitor view, and one row of data is separated by commas. You need to understand the meaning of each field to analyze the results. Data modeling is carried out after data parsing. The details are shown in Figure 4.
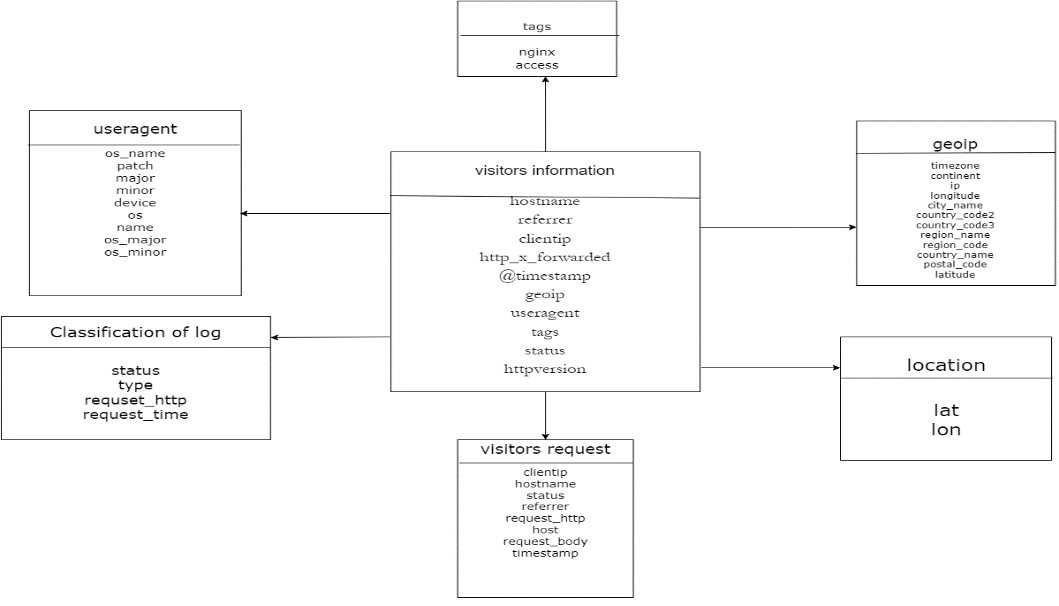
Figure 4. Data modeling.
3.2.2. Data Warehouse Implementation. The data warehouse is primarily used to collect logs and business data from the collection module in HDFS through cleanup, modeling, analysis, and other steps to produce the results needed for business needs, providing reference information for business leaders or related personnel. The data warehouse uses Hive as the analysis tool and Spark as the underlying engine to accelerate execution. The platform's data warehouse is divided into 5 layers, compared to the usual 4-tiered data warehouse structure on the market, there is an additional DWT layer here that is more convenient for querying accumulated data. These 5 layers are (1) ODS (Operation Data Store) layer: the original data layer, which basically stores the collected original data without changing the content, with the data being compressed using LZO to reduce the disk footprint. Partitioned tables are created to prevent later full table scans and increase efficiency. (2) DWD (Data Warehouse Detail) layer: data detail layer, basically cleaning up the data in the ODS layer (removing null values, dirty data, out-of-range data, etc.), dimension degradation and dimension simulation to reduce inefficiency caused by subsequent multi-table Join, using columnar storage to speed up queries, while continuing to use LZO compression. (3) DWS (Data Warehouse Service) layer: data service layer, based on DWD layer, statistics of each subject's behavior for the day, divided into several wide subject tables, each subject is aggregated by day. each row of the wide table in DWS layer usually corresponds to data of one subject day. (4) DWT (Data Warehouse Topic) layer: the Data Warehouse Topic layer, based on the DWS layer, counts the aggregate behavior of each subject subject, paying attention to the metric value from the beginning to the current time, as well as the metric value for the last period. (5) ADS (Application Data Store) layer: the data application layer, mainly for providing data for various statistical reports. If a request is made for a specific N days, it is obtained from the DWS layer, and if aggregate data for today is taken, it is requested from the DWT layer.
3.2.3. Visualization Design. Once you have the framework and tables, run the script to import the data for data analysis. After the analysis is complete, the ADS layer of the data warehouse needs to export the data to the local database. Create the corresponding tables in MySQL based on the result data of ADS layer, then export the result data to MySQL using Sqoop tool, and use data visualization tools Superset and easyV to quickly visualize the data.
4. Results
4.1. ADS layer data display Platform design
After the data is successfully collected in HDFS, it must be imported into the tables corresponding to each of the five data warehouse layers in turn. Write a Data Warehouse Analysis Channel data import script in which you import ODS layer data, import DWD layer data, import DWS layer data, import DWT layer data, and import ADS layer data one at a time. Import DWD layer data, import DWS layer data, import DWT layer data, import ADS layer data, give the script permission, run the script, and then navigate to the appropriate HDFS file directory of each layer to test the data generation. Once we have the results of the ADS layer business requirements analysis, we can use the data visualization module to present them. First, we need to create the corresponding tables in MySQL from the ADS layer, and then write a script to import the table data from HDFS into the corresponding MySQL tables using Sqoop.
4.2. Visualization of Results
When there is data in MySQL, we can use Superset, easyV to connect to MySQL, input the correct configuration information, after successful connection in Superset, easyV to create the corresponding database, create the corresponding table. We can then create a visual chart based on the data in each table. This paper takes Internet users' browsing web data as an example, and analyzes the demand for Internet users' city, total number of daily visitors, cell phone model preference, peak access time, browser usage preference, popular website ranking, web access success rate, etc.
5. Discussion
The platform is mainly based on offline processing for analyzing large amounts of data, i.e. processing the previous day's data for the next day.
Compared to the traditional data warehouse, there is a significant improvement in terms of data scale, data structure type and processing efficiency, but there are some areas for improvement. (1) If there are some requirements outside the ADS level to query and analyze, instant query function should be added to improve the ability to query quickly, that is, the deployment of instant query structure such as Kylin in this platform should continue. (2) When a company grows faster and faster and the business gets bigger and bigger, a certain business will pay a lot of attention to data
timeliness, such as real-time alerts, etc. Therefore, the demand for real-time data storage will become stronger and stronger, and this platform can also be used as a basis for building a real-time data warehouse with real-time data processing frameworks such as Flink and HBase [9]. (3) Over time, more and more data will be stored in the platform, so metadata management-related frameworks can be implemented to facilitate data management, such as pedigree analysis between tables and fields, and to implement data quality monitoring techniques to ensure data quality and reliability.
6. Conclusions
In today's digital age, more and more companies are focusing on the value of data and trying to tap into the
The amount of data generated is increasing. The amount of data generated is getting bigger and bigger, and the competition among industries is becoming more and more fierce. Using this data to analyze users and business to determine operational and marketing decisions is a problem that many companies must consider. However, traditional data analysis tools such as MySQL, Excel, etc. have various drawbacks, such as troublesome data acquisition, no suitable solution for the diversity of data formats, limited amount of data stored in a single machine, troublesome to use, inefficient, unable to handle large amounts of data, etc., and cannot go to deep data mining using data [10]. This platform aims to solve the following problems: the amount of users browsing the website is very large, and hundreds of millions of users will have a huge amount of data to be stored. How to store this data? In order to facilitate the processing and analysis of these large-scale data, how can we build data models to facilitate business analysis? How to ensure the efficiency of the billions of data, efficiency analysis? How to present the results of data analysis, which should appear in a more understandable way, and how to display this data?
Under these problems, a set of data analysis platform is born, which is a one-stop solution for data collection, data storage, data analysis and data visualization, and is convenient for company personnel to use. This platform is unique in that: (1) To meet the demand for real-time log data collection, a two-layer Flume plus Kafka structure is used. The advantage of this design is that when the amount of log data is large at a particular time, Kafka is used as a buffer to play a role of peak protector and prevent denial of service and network congestion caused by too much instantaneous data using Flume alone. (2) For the data transfer process various optimizations are made for cluster crash, data loss, data duplication and other problems during data transfer. (3) Hive uses Hadoop's MapReduce computation engine by default, and all HQL statements are translated to MRJob execution, which is inefficient. This platform replaces the underlying engine of Hive with Spark because Spark is an in-memory based computation which is faster, and Spark uses Yarn mode which makes it easier to schedule resources uniformly across the big data cluster [11]. (4) The business logic part of the project we will use “springboot + mybatis” framework integration, front- and back-end separation technology to achieve. Companies can also build a platform similar to this data analytics platform architecture according to their needs to facilitate data management, explore data value, analyze user behavior, strengthen business intelligence, and improve competitiveness.
Acknowledgement
First of all, I would like to thank the developers of the frameworks and open source software for giving me the opportunity to develop a successful data analysis platform with the help of these frameworks and software. I would also like to thank the data sharers for allowing me to think deeply from the data and use the data to verify the feasibility of the platform.
Also, I would like to thank my teachers and colleagues for helping me when I encountered problems and giving me pointers when I ran out of ideas. My teachers taught me the knowledge that is the foundation of my development platform. Colleagues can give me the best ideas.
I also want to thank my family and friends who have been behind me. When I have an error reported in my code and can't find the reason, it is my friends who help me to find the cause of the error together. When I encountered unclear knowledge, it was also my friends who accompanied me to check the information. When I was tired and lonely, it was my family who gave me warmth and companionship, cared about my physical and mental health, and relieved my stress.
Lastly, I would like to thank all the experts and professors who reviewed and evaluated the paper for their hard work.
References
[1]. Waller M A , Fawcett S E . Data Science, Predictive Analytics, and Big Data: A Revolution That Will Transform Supply Chain Design and Management[J]. Journal of Business Logistics, 2013, 34(2):77-84.
[2]. Aung T, Min H Y, Maw A H. Coordinate Checkpoint Mechanism on Real Time Messaging System in Kafka Pipeline Architecture[C]. 2019 International Conference on Advanced Information Technologies (ICAIT). IEEE, 2019: 37-42.
[3]. Suman A K, Gyanchandani M. Improved Performance of Hive Using Index Based Operation on Big Data[C]. 2018 Second International Conference on Intelligent Computing and Control Systems (ICICCS). IEEE, 2018: 1974-1978.
[4]. Thusoo A , Sarma J S , Jain N , et al. Hive - a petabyte scale data warehouse using Hadoop[J]. IEEE, 2010.
[5]. Zaharia M , Xin R S , Wendell P , et al. Apache Spark: a unified engine for big data processing[J]. Communications of the Acm, 2016, 59(11):56-65.
[6]. Zaharia M , Chowdhury M , Das T , et al. Resilient distributed datasets: A fault-tolerant abstraction for in-memory cluster computing[C]. Proceedings of the 9th USENIX conference on Networked Systems Design and Implementation. USENIX Association, 2012.
[7]. D Cheng, Zhou X , Lama P , et al. Cross-Platform Resource Scheduling for Spark and MapReduce on YARN[J]. IEEE Transactions on Computers, 2017, PP(8):1-1.
[8]. Mallach E G . Decision Support and Data Warehouse Systems[M]. Tsinghua University Pr, 2000.
[9]. Ahn H Y, Kim H, You W. Performance study of Spark on YARN cluster using HiBench [C]. 2018 IEEE International Conference on Consumer Electronics-Asia (ICCEAsia). IEEE, 2018: 206-212.
[10]. Tukey J W. The future of data analysis[J]. The annals of mathematical statistics, 1962, 33(1): 1-67.
[11]. Li X , Mao Y . Real-Time data ETL framework for big real-time data analysis[C]. IEEE International Conference on Information & Automation. IEEE, 2015.
Cite this article
Zhao,Z. (2023). The realization and application of the data analysis platform of netizen behavior based on Hive. Applied and Computational Engineering,13,103-111.
Data availability
The datasets used and/or analyzed during the current study will be available from the authors upon reasonable request.
Disclaimer/Publisher's Note
The statements, opinions and data contained in all publications are solely those of the individual author(s) and contributor(s) and not of EWA Publishing and/or the editor(s). EWA Publishing and/or the editor(s) disclaim responsibility for any injury to people or property resulting from any ideas, methods, instructions or products referred to in the content.
About volume
Volume title: Proceedings of the 5th International Conference on Computing and Data Science
© 2024 by the author(s). Licensee EWA Publishing, Oxford, UK. This article is an open access article distributed under the terms and
conditions of the Creative Commons Attribution (CC BY) license. Authors who
publish this series agree to the following terms:
1. Authors retain copyright and grant the series right of first publication with the work simultaneously licensed under a Creative Commons
Attribution License that allows others to share the work with an acknowledgment of the work's authorship and initial publication in this
series.
2. Authors are able to enter into separate, additional contractual arrangements for the non-exclusive distribution of the series's published
version of the work (e.g., post it to an institutional repository or publish it in a book), with an acknowledgment of its initial
publication in this series.
3. Authors are permitted and encouraged to post their work online (e.g., in institutional repositories or on their website) prior to and
during the submission process, as it can lead to productive exchanges, as well as earlier and greater citation of published work (See
Open access policy for details).
References
[1]. Waller M A , Fawcett S E . Data Science, Predictive Analytics, and Big Data: A Revolution That Will Transform Supply Chain Design and Management[J]. Journal of Business Logistics, 2013, 34(2):77-84.
[2]. Aung T, Min H Y, Maw A H. Coordinate Checkpoint Mechanism on Real Time Messaging System in Kafka Pipeline Architecture[C]. 2019 International Conference on Advanced Information Technologies (ICAIT). IEEE, 2019: 37-42.
[3]. Suman A K, Gyanchandani M. Improved Performance of Hive Using Index Based Operation on Big Data[C]. 2018 Second International Conference on Intelligent Computing and Control Systems (ICICCS). IEEE, 2018: 1974-1978.
[4]. Thusoo A , Sarma J S , Jain N , et al. Hive - a petabyte scale data warehouse using Hadoop[J]. IEEE, 2010.
[5]. Zaharia M , Xin R S , Wendell P , et al. Apache Spark: a unified engine for big data processing[J]. Communications of the Acm, 2016, 59(11):56-65.
[6]. Zaharia M , Chowdhury M , Das T , et al. Resilient distributed datasets: A fault-tolerant abstraction for in-memory cluster computing[C]. Proceedings of the 9th USENIX conference on Networked Systems Design and Implementation. USENIX Association, 2012.
[7]. D Cheng, Zhou X , Lama P , et al. Cross-Platform Resource Scheduling for Spark and MapReduce on YARN[J]. IEEE Transactions on Computers, 2017, PP(8):1-1.
[8]. Mallach E G . Decision Support and Data Warehouse Systems[M]. Tsinghua University Pr, 2000.
[9]. Ahn H Y, Kim H, You W. Performance study of Spark on YARN cluster using HiBench [C]. 2018 IEEE International Conference on Consumer Electronics-Asia (ICCEAsia). IEEE, 2018: 206-212.
[10]. Tukey J W. The future of data analysis[J]. The annals of mathematical statistics, 1962, 33(1): 1-67.
[11]. Li X , Mao Y . Real-Time data ETL framework for big real-time data analysis[C]. IEEE International Conference on Information & Automation. IEEE, 2015.