


1. Introduction
Customer churn is the phenomenon that customers stop using or accepting the products or services provided by a company, it can largely reflect the business’s performance. When the churn rate is low, the business will have a stable and large regular customer group, if not, the business may face problems with its customer base. Obviously, a company should aim for the lowest possible churn rate to ensure its long-term and stable competitiveness in the market. This is why how to predict customer churn is important for a business.
Previous articles have made some achievements around customer churn. Cuiyan et al. model and study customers’ behaviors and features using the long-short term memory network (LSTM) and other methods, which can be used to predict customer churn [1]. In addition to this, the study carried out by Jie et al. also uses LSTM as the basis and eventually gets a dataset which can be performed logistic regression on for customer churn prediction [2]. In the field of customer churn in e-commerce, Wanting et al. distinguish between active and inactive customers and find that for the former, the total amount of customer purchase is important, while for the latter, the amount of time a customer spends in the store should be emphasized [3]. In the same area, Li uses Map/Reduce to improve the modeling efficiency of customer churn prediction [4]. Yanjun introduces and establishes an e-commerce customer loss estimation model based on improved neural network to enhance the prediction effect [5]. Besides, Ning and Gao use support vector machine which is based on particle optimization algorithm in order to enhance the prediction accuracy [6]. Focusing on customers’ emotional tendencies, Xin et al. use the emotional analysis and BP neural network based on customers’ comments to predict customer churn and find that the emotional part of reviews can be a main factor related to this issue [7]. Guoen et al. study customers’ value and emotion features, conduct and compare various machine learning algorithms [8]. From the perspective of accounting, Zhen analyses the issue of customer churn caused by the merger of accounting firms and provides several suggestions for them [9]. Shu and Zhen explore the negative impact of the loss of a large client and find that the firm may lose other clients in the large client's industry [10].
It can be concluded that past researches have studied the customer churn in different fields from various dimensions and made several achievements, mainly focusing on model building. The innovation of this paper is to compare the performance of two machine learning classification methods in predicting customer churn and to select the better one for further discussion, thus providing some advice for banking professionals to analyze customers and improve the bank’s competitiveness.
2. Method
2.1. Dataset
This paper aims to predict bank customer churn and it uses whether a customer leaves or not as the predicted term (expressed by 0 and 1, where 1 means “existed” and 0 means “retained”). After removing irrelevant variables such as customer ID, surname, etc. that have little effect on the study results, ten independent variables are obtained, which are: the client’s geographical location, gender, age, tenure (number of years of business of the client), estimated salary, balance, credit score, the number of products his or her hold as well as whether the client is an active member and whether the clients have credit card. The data is acquired through Kaggle.
The study is conducted with close to one thousand customers as respondents. Of the data selected, slightly more than one-fifth of the customers were lost, while the rest stayed.
2.2. Models
This article uses two methods, logistic regression and decision tree classification, to predict bank customer churn separately and will compare the results obtained from these two methods.
For logistic regression, though named as a regression, it is actually a classification method and it can project the values of linear regression into an interval from 0 to 1. Around the classification problems, logistic regression uses
\( y=\frac{1}{1+{e^{{-(W^{T}}x+b)}}}\ \ \ (1) \)
as the basic function. After obtaining the mathematical model, it uses maximum likelihood estimation method to obtain optimal parameters. Regarding the use of logistic regression, there are several advantages and disadvantages. It is simpler to understand than many other machine learning algorithms. It has a wide range of applications, is computationally easy and therefore its results can be obtained quickly. However, the use of logistic regression in the cases with high data complexity can cause underfitting problems and it can only handle classification problems with two categories.
Decision tree classification is a basic machine learning method. This method starts with the root node and it uses the "branch" which represents a judgment in order to link to decision nodes, which contains the properties that the sample may have. This pattern will continue until the model reaches the end nodes which eventually represent the classification results of the dataset. In decision trees, the most important part lies in selecting the most appropriate decision basis at each decision node, in which the more common practices are information gain method and Gini index method. For information gain method, it first calculates one information entropy H(D) and the information gain after adding a new attribute on this basis, which can be expressed by Gain (D, A) =H(D)-H(D|A), then selects the attribute that causes the greatest information gain to be included in the decision node. For Gini index method,
\( Gini(D)= \sum _{k=1}^{K}\frac{|{C_{k}}|}{|D|}(1-\frac{|{C_{k}}|}{|D|}) \) (2)
is the Gini index for dataset D and it represents the impurity, the method aims to choose the attribute with the smallest Gini index as the optimal partition attribute, which is
\( Gini(D|A)=\sum _{i=1}^{n}\frac{|{D_{i}}|}{|D|}Gini({D_{i}}) \) (3)
The advantages of decision trees are that they are good at handling complex samples, insensitive to missing values and easy for people to interpret the results. However, it can lead to overfitting problems, high training costs and difficulty in handling associations between features.
3. Result
In this article, both the logistic regression and the decision tree classification use 70% of the dataset for training and the remaining 30% for testing.
When testing the effectiveness of the model classification, three metrics are introduced, namely recall rate, accuracy rate and F1 metrics, where recall rate refers to the probability of being successfully judged as positive among the positive cases in the sample and accuracy rate refers to the probability of being successfully predicted among the samples that are predicted to be positive. The F1 metric combines these two rates and it is the summed average of the recall rate and the accuracy rate, which can, to a certain extent, represent the model performance at both the original sample and the prediction result levels, thus better reflecting the overall effectiveness.
For the logistic regression, Table 1 shows that the F1 metrics for training set and test set are both around 0.72, showing a good classification effect.
Table 1. Model evaluation results of logistic regression.
Recall rate | Accuracy rate | F1 | |
Training set | 0.785 | 0.723 | 0.726 |
Test set | 0.787 | 0.701 | 0.723 |
According to the confusion matrix heat map in Figure 1, the model has a better ability to classify customers who retained, with more than 95% of customers who made this choice correctly classified, while when it comes to customers who were lost by the bank, the model tends to make wrong judgments, i.e., most customers who chose to leave are classified as retained.
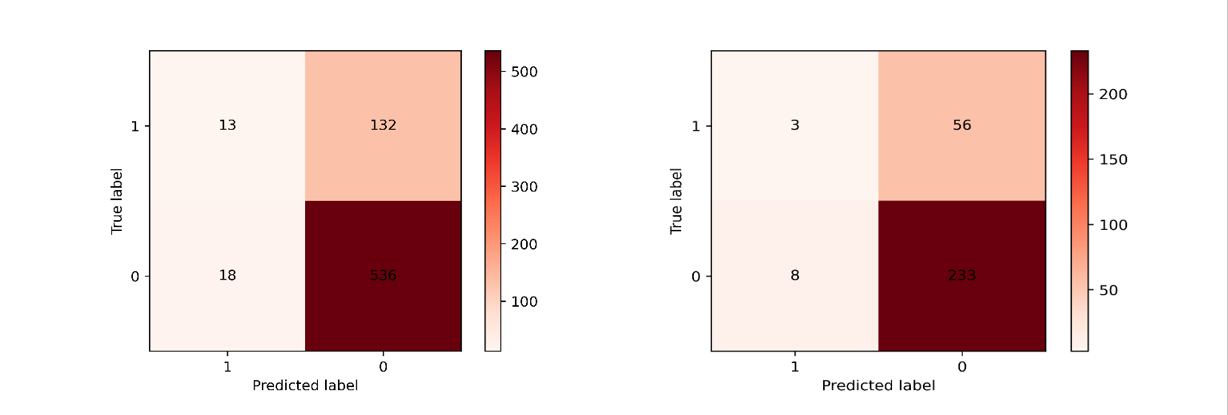
Figure 1. Confusion matrix of training and testing sets of logistic regression.
For the decision tree classification, it can be clearly found that the model performs well in training, as shown in Table 2, with an F1 metric close to 0.95, and for the test set the F1 metric is close to 0.75, which is better than logistic regression in classifying from both the sample itself and the predicted outcome dimensions.
Table 2. Model evaluation results of decision tree.
Recall rate | Accuracy rate | F1 | |
Training set | 0.937 | 0.939 | 0.933 |
Test set | 0.743 | 0.751 | 0.747 |
When analyzing the confusion matrix heat map for this method, as displayed in Figure 2, a noteworthy point is that though this model also makes some mistakes, it shows some improvement against the problem that arises in logistic regression, where the model often fails to predict the condition for customers who have already left. This improvement is more evident in the training set.
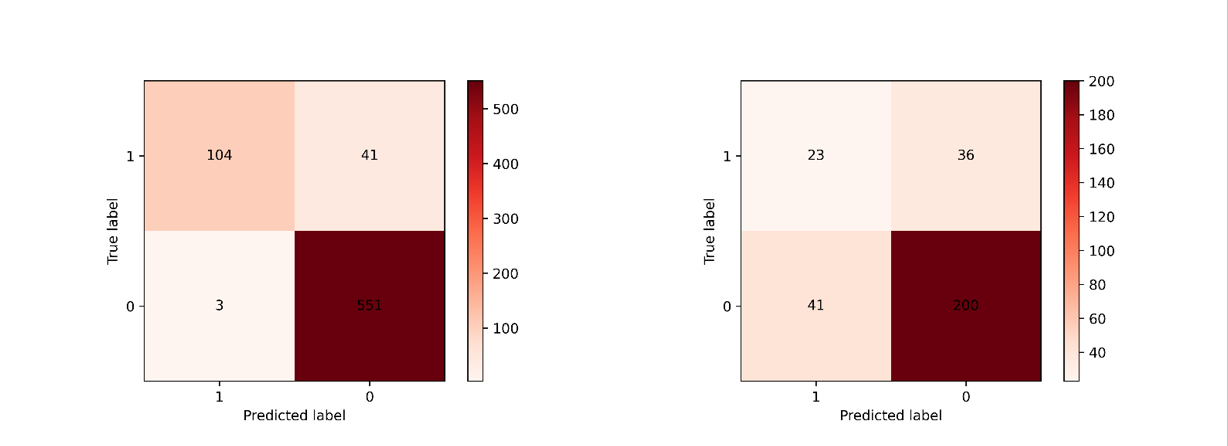
Figure 2. Confusion matrix of training and testing sets of decision tree.
After building the decision tree, a feature importance graph consisting of independent variables can be derived, which reflects the involvement of each feature in the classification. According to Figure 3, age is the most important determinant, with an importance rate of 23.3%, in addition to other factors that show their importance ratios larger than 15%, which include estimated salary and number of products. In contrast, the least important factor is the user's credit card holding condition.
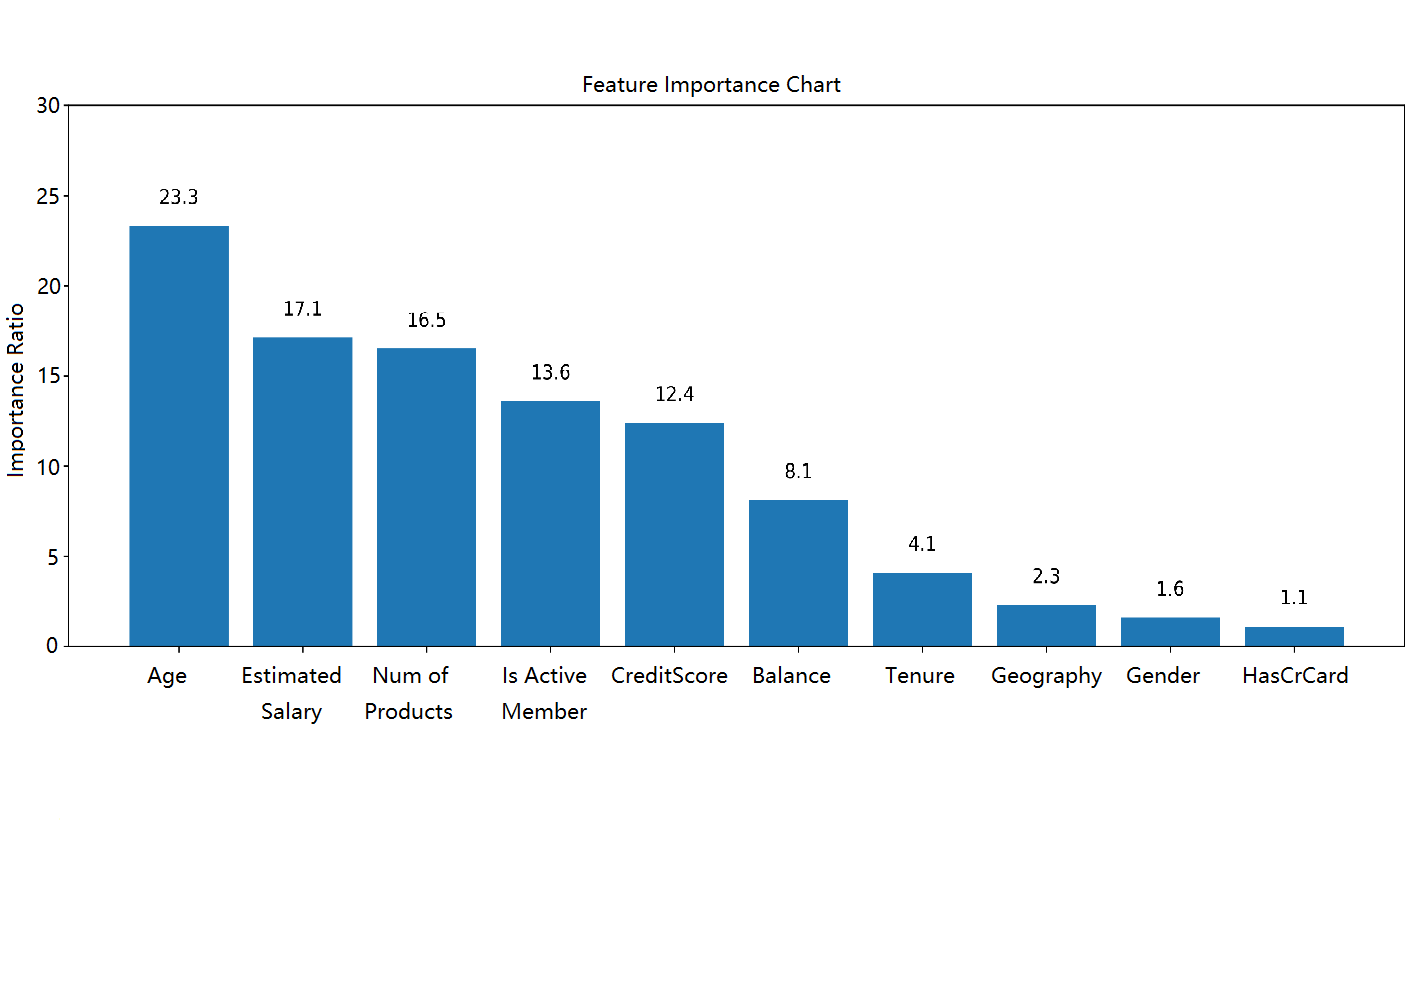
Figure 3. Feature importance chart for decision tree classifier.
To further explore the result obtained from the feature importance chart, three variables with their importance greater than 15% are selected for separate discussion of their relationships with customer churn. This article uses the prediction results of the decision tree in the test set as a criterion, selects three variables, namely age, estimated salary and number of products, which are respectively displayed in Figure 4, Figure 5, and Figure 6.
For age, it can be seen from the chart that there is a relationship between age and customers’ departure ratio, i.e., the older the customer is, the higher the probability of leaving. In contrast, customers between the ages of about 30 and 45 are more likely to choose to stay.
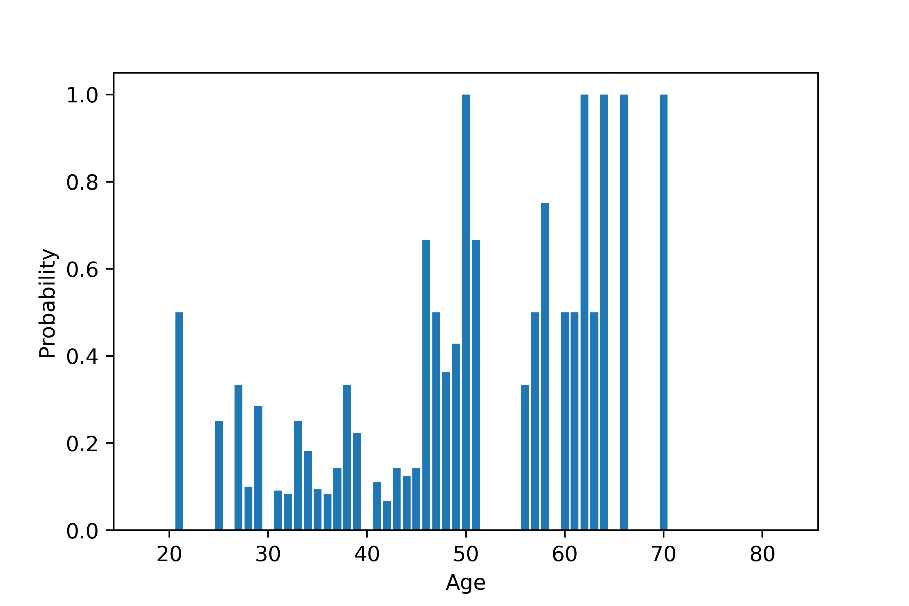
Figure 4. Customer churn under different ages.
For estimated salary, the line chart shows a trend of "low in the middle and high at the ends", i.e., clients with very low and very high salary levels are more likely to leave, while those who stay tend to earn a middle level salary.
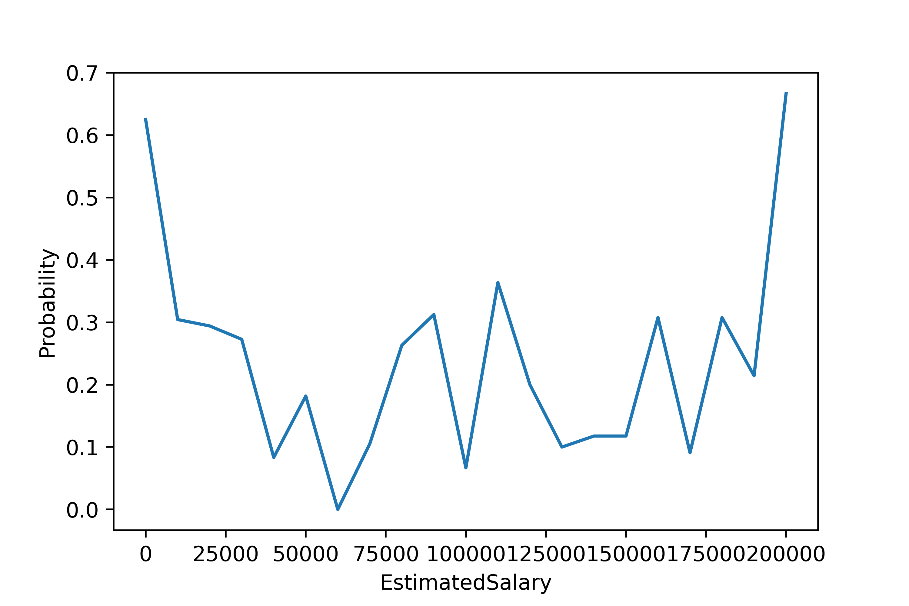
Figure 5. Customer churn under different estimated salaries.
For the product number, the pie charts show that for those who own one or two products, the departure ratio is less than 25%, while it is not the case for those who own three products since the churn rate is higher than 75%, which is quite counter-intuitive and should be paid attention to.
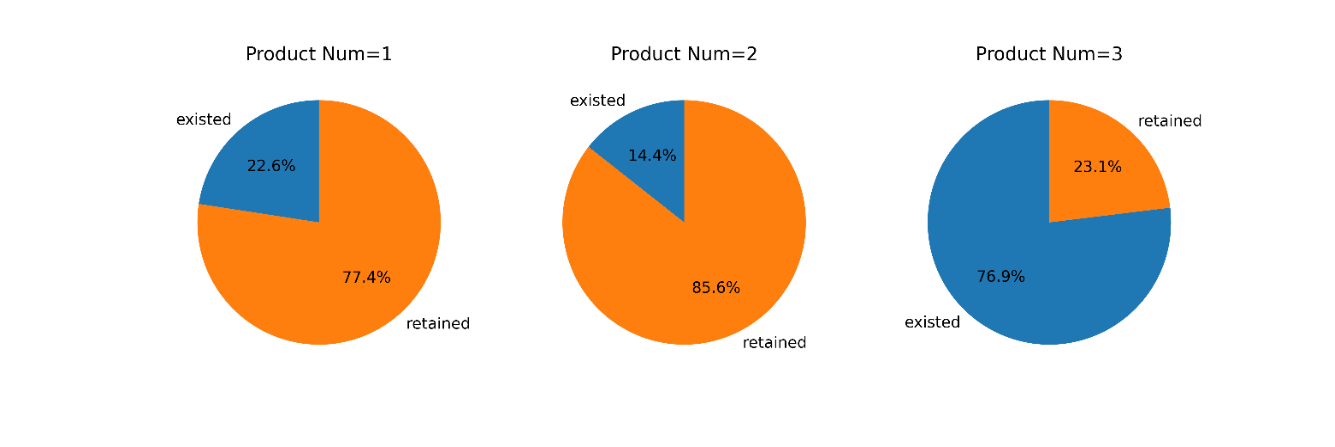
Figure 6. Customer churn under different product numbers.
4. Discussion
By examining the results of the decision tree, the researchers should mainly focus on the user's age, income, number of products held in the bank when investigating bank customer churn. In addition, further research reveals that older customers are more likely to exit. Based on this phenomenon, banks should consider providing more targeted services to senior customers to enhance their attractiveness to this group, such as simplifying the business procedures for them, etc. When it comes to the fact that customer churn rates are high both in low and high salary earner groups, this paper speculates that this is because low salary earners may spend most of their salary on daily expenses and not much can be kept in the bank, while high salary earners may consider to take more profitable and risky investment activities. Given this speculation, banks may consider introducing more types of financial products to meet the investing needs of different groups of people. Moreover, in response to the problem that people who hold more products are more likely to leave, banks should not only focus on selling more products to customers, but also on how important and useful the products are to them and pay attention to people who own many products. By improving the business system, focusing on special customer groups and providing better and more personalized services, banks can build a better reputation among their customers and use this to improve their competitiveness in the market.
5. Conclusion
In this paper, two methods, logistic regression and decision tree classification, are used to train the model and try to predict the probability of customer churn in banks. The above study shows that decision tree performs better in predicting customer churn problems as it shows better F1 metric and mitigates the issue of misjudging the choices of customers who should have exited made by the logistic regression. In addition, this paper also studies the three most important factors in the decision tree, i.e., age, estimated salary and number of products respectively. The results show that older people, low and high wage earners and users with more product holdings are more likely to churn, which can be used to provide some advice for the bankers. Overall, this paper exemplifies the advantages of decision trees in predicting customer churn and, based on the results, provides three user characteristics that can be used for more in-depth research. In future study, researchers can focus on analyzing questions like why some specific features are of high importance in prediction and why the mechanism of operation of decision trees makes it more effective in predicting churn.
References
[1]. Cuiyan, Z, Manman, Z, Xiaoling, X, et al.: Customer Churn Prediction Model Based on User Behavior Sequences. Journal of Donghua University (English Edition), 39(06), 597-602 (2022).
[2]. Jie, Z, Jianfeng, Y, Lu, Y, Peng, X, and Meng, W.: Application of LSTM Ensemble Method in Customer Churn Prediction. Computer applications and software, 36(11), 45 (2019).
[3]. Wanting, Z, Zhijie, Z, Yang, L, et, al.: Research on DBN Prediction Model of E-Commerce Customer Churn, Computer Engineering and Application, 58(11):84-92, (2022).
[4]. Li, Y.: Predictions model of customer churn in E-commerce based on online sequential optimization extreme learning machine, Journal of Nanjing University of Science And Technology, 43(01), 108-114 (2019).
[5]. Yanjun, C.: E⁃commerce customer churn estimation based on neural network, Modern Electronic Technology, 43(13), 103-105 (2020).
[6]. Ning, X, Fei, G.: Prediction Simulation of Customer Churn in E-Business of Wireless Network, Computer Simulation, 35(09), 475-479 (2018).
[7]. Xin, F, Chen, W, Yuan, L, et, al.: The Customer Churn Prediction Based on Emotional Polarity and BPNN, Journal of China Academy of Electronic Science, 13(03), 340-345 (2018).
[8]. Guoen, X, Wenbin, M, Chanjuan, T, et, al.: Study on the Value Feature and the Emotion Feature to Predict the Web Customer Churn, Chinese Journal of Management, 15(03), 442-449 (2018).
[9]. Zhen, Z.: Analysis of customer churn in the merger of accounting firms, Caikuai Tongxun, 861(01), 120-124 (2021).
[10]. Shu, L, Zhen, J.: A Study on the Economic Consequences of Big Customer Turnover in Accounting Firms, Kuaiji Yanjiu, 422(12), 174-184 (2022).
Cite this article
Wen,Z. (2023). Feature analysis and model comparison of logistic regression and decision tree for customer churn prediction. Applied and Computational Engineering,20,55-61.
Data availability
The datasets used and/or analyzed during the current study will be available from the authors upon reasonable request.
Disclaimer/Publisher's Note
The statements, opinions and data contained in all publications are solely those of the individual author(s) and contributor(s) and not of EWA Publishing and/or the editor(s). EWA Publishing and/or the editor(s) disclaim responsibility for any injury to people or property resulting from any ideas, methods, instructions or products referred to in the content.
About volume
Volume title: Proceedings of the 5th International Conference on Computing and Data Science
© 2024 by the author(s). Licensee EWA Publishing, Oxford, UK. This article is an open access article distributed under the terms and
conditions of the Creative Commons Attribution (CC BY) license. Authors who
publish this series agree to the following terms:
1. Authors retain copyright and grant the series right of first publication with the work simultaneously licensed under a Creative Commons
Attribution License that allows others to share the work with an acknowledgment of the work's authorship and initial publication in this
series.
2. Authors are able to enter into separate, additional contractual arrangements for the non-exclusive distribution of the series's published
version of the work (e.g., post it to an institutional repository or publish it in a book), with an acknowledgment of its initial
publication in this series.
3. Authors are permitted and encouraged to post their work online (e.g., in institutional repositories or on their website) prior to and
during the submission process, as it can lead to productive exchanges, as well as earlier and greater citation of published work (See
Open access policy for details).
References
[1]. Cuiyan, Z, Manman, Z, Xiaoling, X, et al.: Customer Churn Prediction Model Based on User Behavior Sequences. Journal of Donghua University (English Edition), 39(06), 597-602 (2022).
[2]. Jie, Z, Jianfeng, Y, Lu, Y, Peng, X, and Meng, W.: Application of LSTM Ensemble Method in Customer Churn Prediction. Computer applications and software, 36(11), 45 (2019).
[3]. Wanting, Z, Zhijie, Z, Yang, L, et, al.: Research on DBN Prediction Model of E-Commerce Customer Churn, Computer Engineering and Application, 58(11):84-92, (2022).
[4]. Li, Y.: Predictions model of customer churn in E-commerce based on online sequential optimization extreme learning machine, Journal of Nanjing University of Science And Technology, 43(01), 108-114 (2019).
[5]. Yanjun, C.: E⁃commerce customer churn estimation based on neural network, Modern Electronic Technology, 43(13), 103-105 (2020).
[6]. Ning, X, Fei, G.: Prediction Simulation of Customer Churn in E-Business of Wireless Network, Computer Simulation, 35(09), 475-479 (2018).
[7]. Xin, F, Chen, W, Yuan, L, et, al.: The Customer Churn Prediction Based on Emotional Polarity and BPNN, Journal of China Academy of Electronic Science, 13(03), 340-345 (2018).
[8]. Guoen, X, Wenbin, M, Chanjuan, T, et, al.: Study on the Value Feature and the Emotion Feature to Predict the Web Customer Churn, Chinese Journal of Management, 15(03), 442-449 (2018).
[9]. Zhen, Z.: Analysis of customer churn in the merger of accounting firms, Caikuai Tongxun, 861(01), 120-124 (2021).
[10]. Shu, L, Zhen, J.: A Study on the Economic Consequences of Big Customer Turnover in Accounting Firms, Kuaiji Yanjiu, 422(12), 174-184 (2022).