


1. Introduction
Developments of society, culture and economy requires efficient and safe transportation systems. In Chinese geographical circumstances, mountains and rivers make up the most of the area. Bridges play an important role in combining traffic between separated regions. Therefore, it becomes a prior alternative to construct suitable and reliable bridges to satisfy the strong mobility of both people and goods in modern societies [1]. However, considering the increase of bridge span, modern bridges become more flexible, slender, less damping, and therefore more sensitive to the seismic effects. Simultaneously, China is an earthquake-prone country. According to records of Chinese Earthquake Information Centre (CEIC), there are 8557 earthquakes in China from 2012.04.26 to 2023.03.26. In 2008 Wenchuan earthquake (M8.0), over 6410 bridges were considered difficult to repair [1]. As one of the main transportation junctions, the damage of bridge will lead to traffic interruption, economic loss and casualty. Based on information above, it is significant to investigate the seismic behaviour of the bridge construction.
The methodologies of earthquake analysis for bridges have been widely discussed. In 2002, Vamvatsikoset et al. [3] established Incremental Dynamic Analysis (IDA), which is still one of the most popular methods for earthquake analysis. For the procedure of IDA, a group of earthquake records will be selected and suitable records will be scaled to a predefined Response Spectrum (RS). Afterward, using variation of the calculated scale factor, different excitation levels will be applied to structural models [4]. Adequate researches have been presented a lot. Faroz et al. [5], considering corrosion effect, evaluated the seismic vulnerability of a bridge. Kita et al. [6] presented a methodology to address the rapid post-earthquake damage localization and quantification tasks, based on non-linear Incremental Dynamic Analysis (IDA). In theirs later article, by combining Operational Modal Analysis (OMA), previous method was updated, which allows the detection of small structural damages due to earthquakes and far-field seismic identification [7]. However, many researchers (i.e., Guo, 2017 [8]) have reported the impractically expensive computational effort of IDA. Based on above disadvantage, in 2011, Estekanchi et al. [8] innovated Endurance Time Method (ETM) as an alternative technique for calculating the seismic response of structures.
With the advancement of technology, the construction of new bridge types is gradually emerging. Generally, due to the great performance variability between different bridges, bridges which share same type (i.e., arch bridge) could have huge gap of seismic vulnerability. The experiences of previous research could offer advices, however, cannot determine the seismic design of newly constructed bridge. In this paper, selected bridge is an extra-large arch bridge located at \( 29.59 N, 106.58 E \) with steel frame and highway (railway) transportation. The overall design age is 100 years. By doing the literature research, there are 68 earthquake events occurred in the bridge’s province ( \( 28°{09^{ \prime }}{54^{ \prime \prime }} N, 105°{16^{ \prime }}{48^{ \prime \prime }} E-32°{12^{ \prime }}{00^{ \prime \prime }} N, 110°{11^{ \prime }}{24^{ \prime \prime }} N \) ) according to CEIC. Based on Peak Ground Acceleration (PGA) data and probability distribution fitting, the mean acceleration is \( 0.4805 g \) . based on Frechet type. On this basis, the selected bridge is in an earthquake-prone areas. Therefore, it is necessary to make earthquake analysis for the maintain of the bridge and traffic safety.
The overall research process of this paper can be divided into three parts: (1) Firstly, relevant information of the target bridge is generated, including geometric model, material bearing capacity and load (live load, dead load and seismic load). (2) Secondly, LS-DYNA is used to simulate the seismic vulnerability of the target bridge based on spectral analysis method. (3) Finally, the calculation results and prospects are discussed, including the risk components and vulnerability of arch bridges as well as the prospects of arch bridge design and management.
2. Engineering background
2.1. Introduction of bridge
2.1.1. Geometry information. This paper’s target bridge is Chongqing Chaotianmen Yangtze River Bridge, which located in Chaotianmen, Chongqing, 1.7 km downstream of the junction of the Yangtze and Jialing River. As shown in Figure 1, the bridge ( \( 1741 m \) total length) consists of a main span ( \( 932 m \) length) and two approach spans, with a double layer arrangement. The main span is primarily affected by seismic process, and the approach spans are considerably affected by earthquake. The main span is ( \( 190+552+190 m \) length) half-through continuous steel truss tied arch structure. The upper layer (36.5 m width) is two-way sis lane with two sidewalks outside girder ( \( 29 m \) width). The lower layer is two-lane urban light rail in the middle and two-lane driveway beside. The longitudinal supporting system of the structure is arranged in the middle pivot of the north side river with fixed hinged supports, and the other piers with movable hinged supports. The transverse support system is arranged for the middle fulcrum is provided with a fixed support, the side fulcrum is provided with a transverse movable support, and the centre of the lower layer of the side fulcrum is provided with two transverse limit supports. Compared with other bridge, the seismic response of extra-large dual used arch bridge is more complex, which mainly shows by the failure of the supports at the junction of pier and beam [10]. In order to ensure the bridge’s seismic safety in operation, it is necessary to conduct a comprehensive analysis of the structural dynamic characteristics and structural seismic response of the bridge, so as to ensure that the bridge has sufficient seismic resistance performance.
|
Figure 1. The overall image of target bridge (m) [11]. |
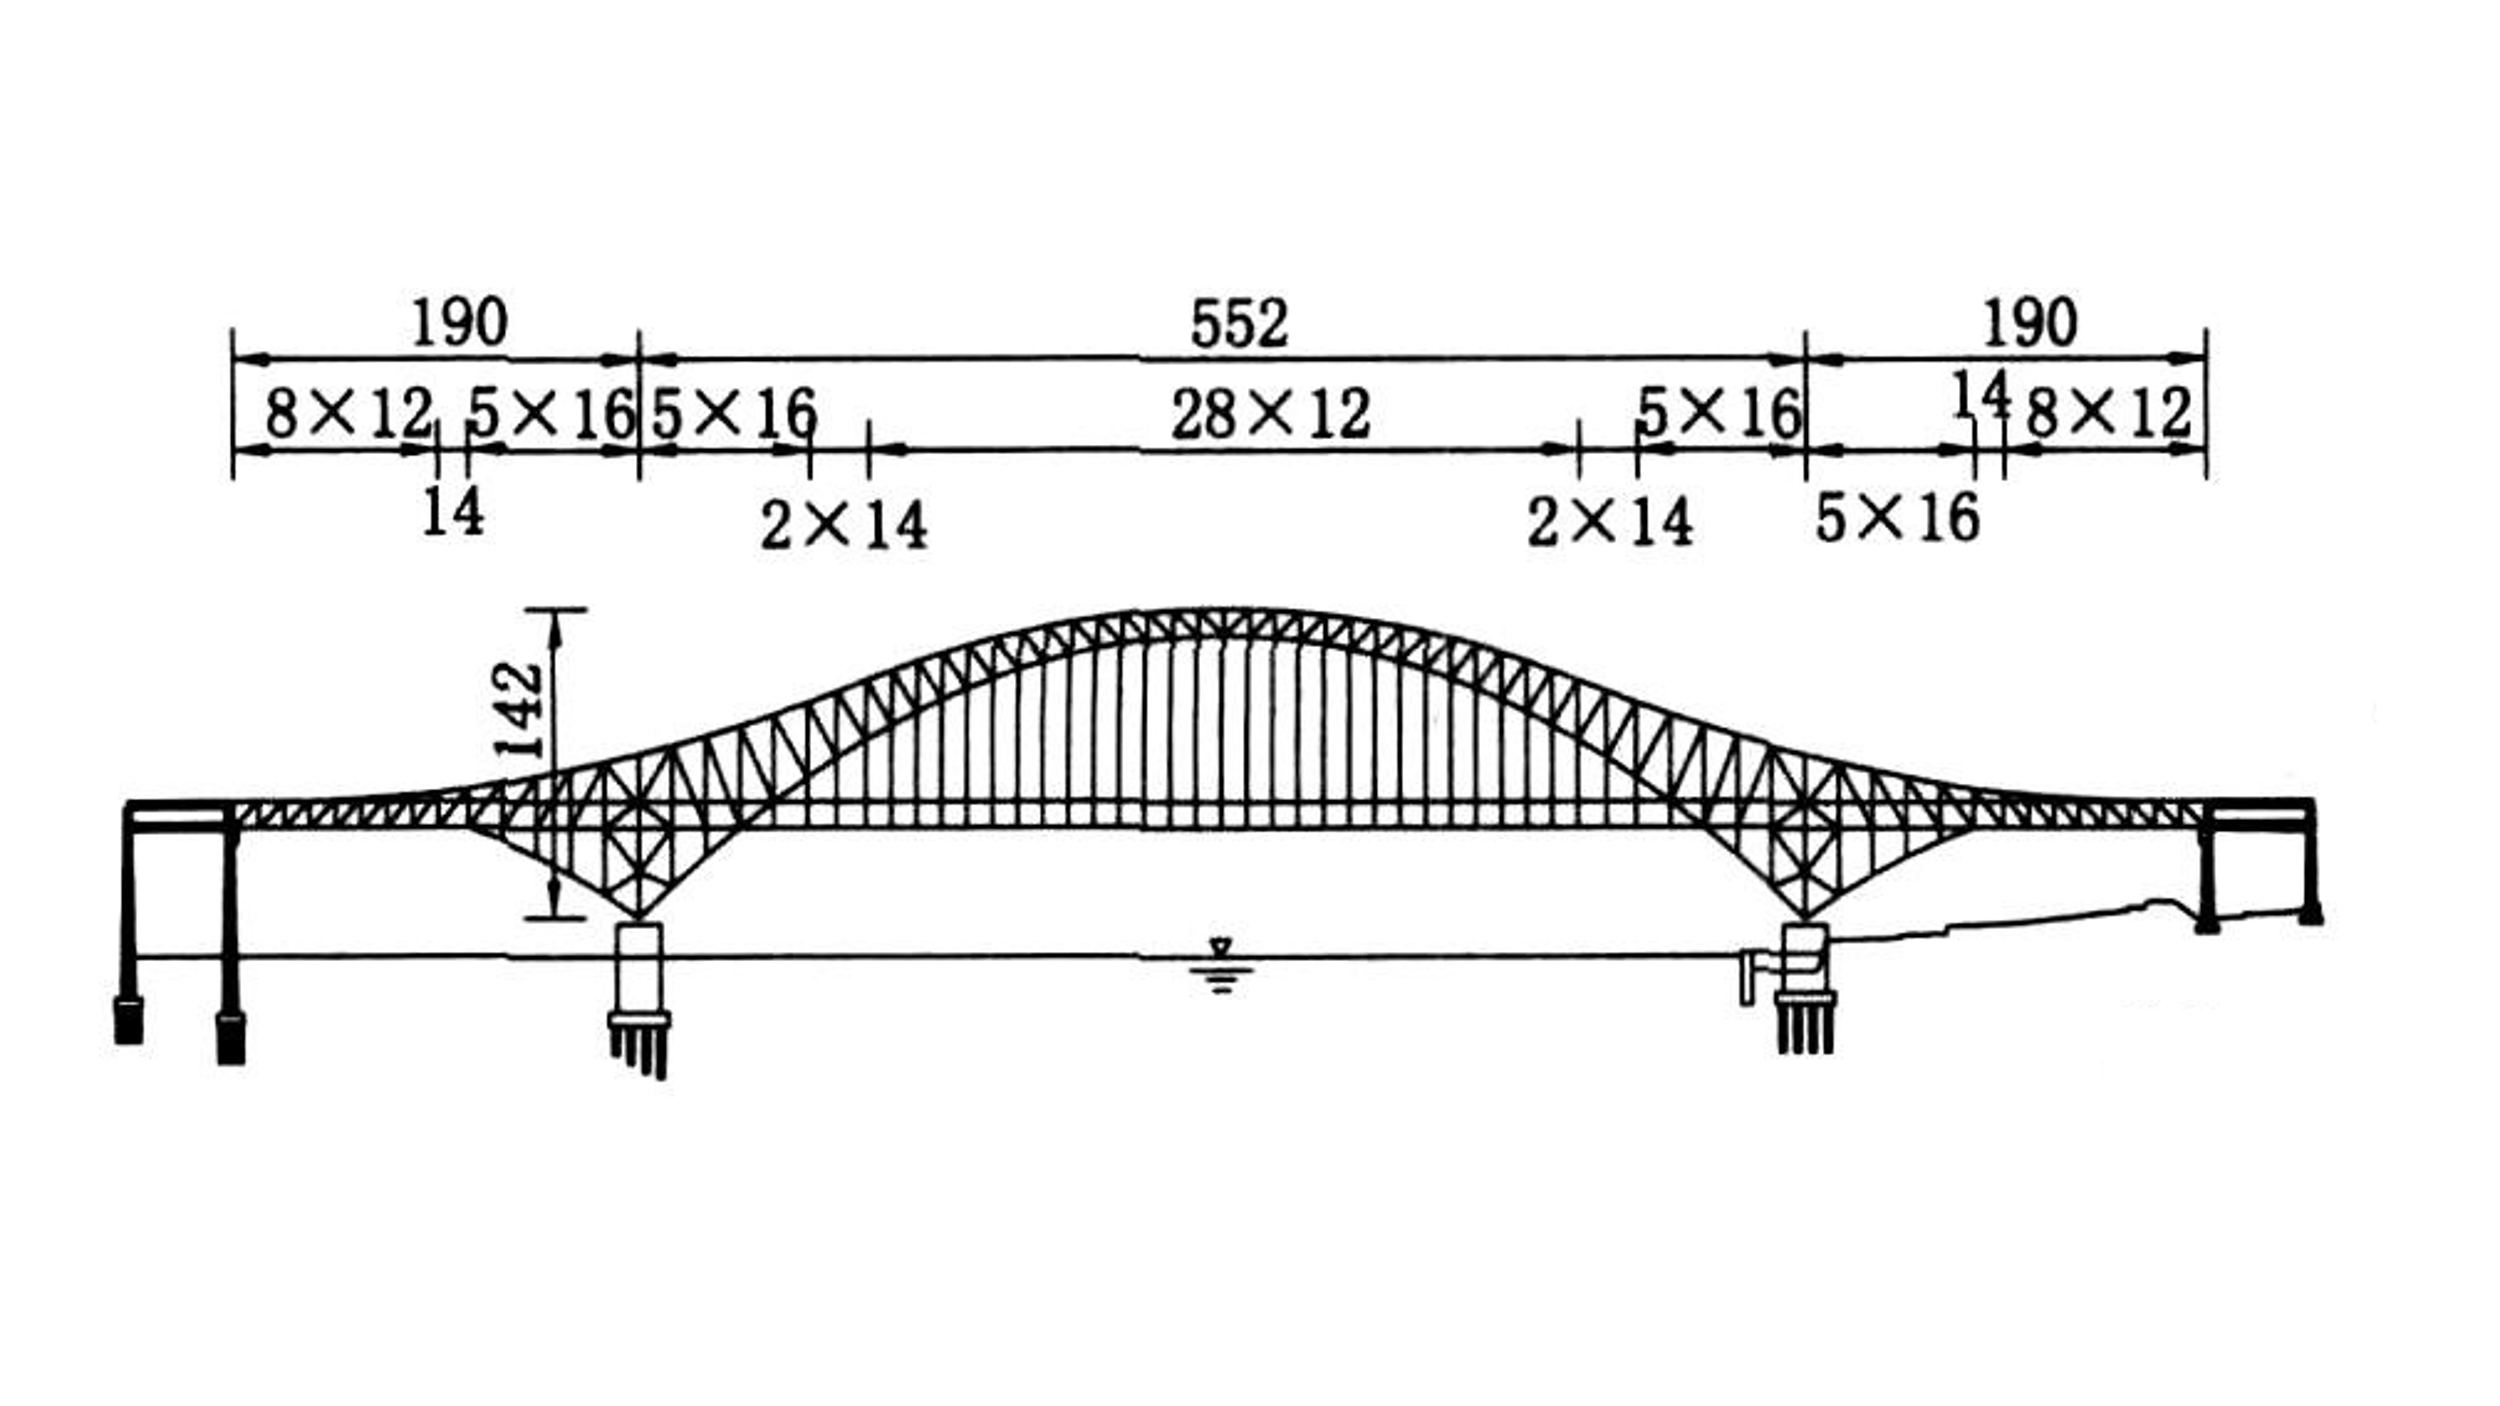
2.1.2. Structural capacity. The arch of the main span is constructed by two trusses which has \( 29 m \) width. Both the downline and upline of the arch ribs is quadratic parabola (sagittal height of \( 14 m \) ). The trusses are the N-shape trusses with variable height. The distance of the ribs in middle span is 14m, where the height of the middle truss is \( 73.13 m \) . The cable of the main span is designed with variable distance between each cable (i.e., \( 12,14,16 m \) ). The distance between two floor is \( 11.83 m \) .
For material design, the beam of the main span is constructed by three different steels (i.e., Q345qD, Q370qD and Q420qD) with maximum thickness 50mm and variable cross-section height based on loads of the bridge. The cable is made by 3 types of high tensile parallel ropes with number PES127, PES139, PES151. The support beam of the main deck is constructed by orthogonal anisotropic steel plates with 6 axial U-shape plates and transversal plates in each node of the truss.
2.2. Model process
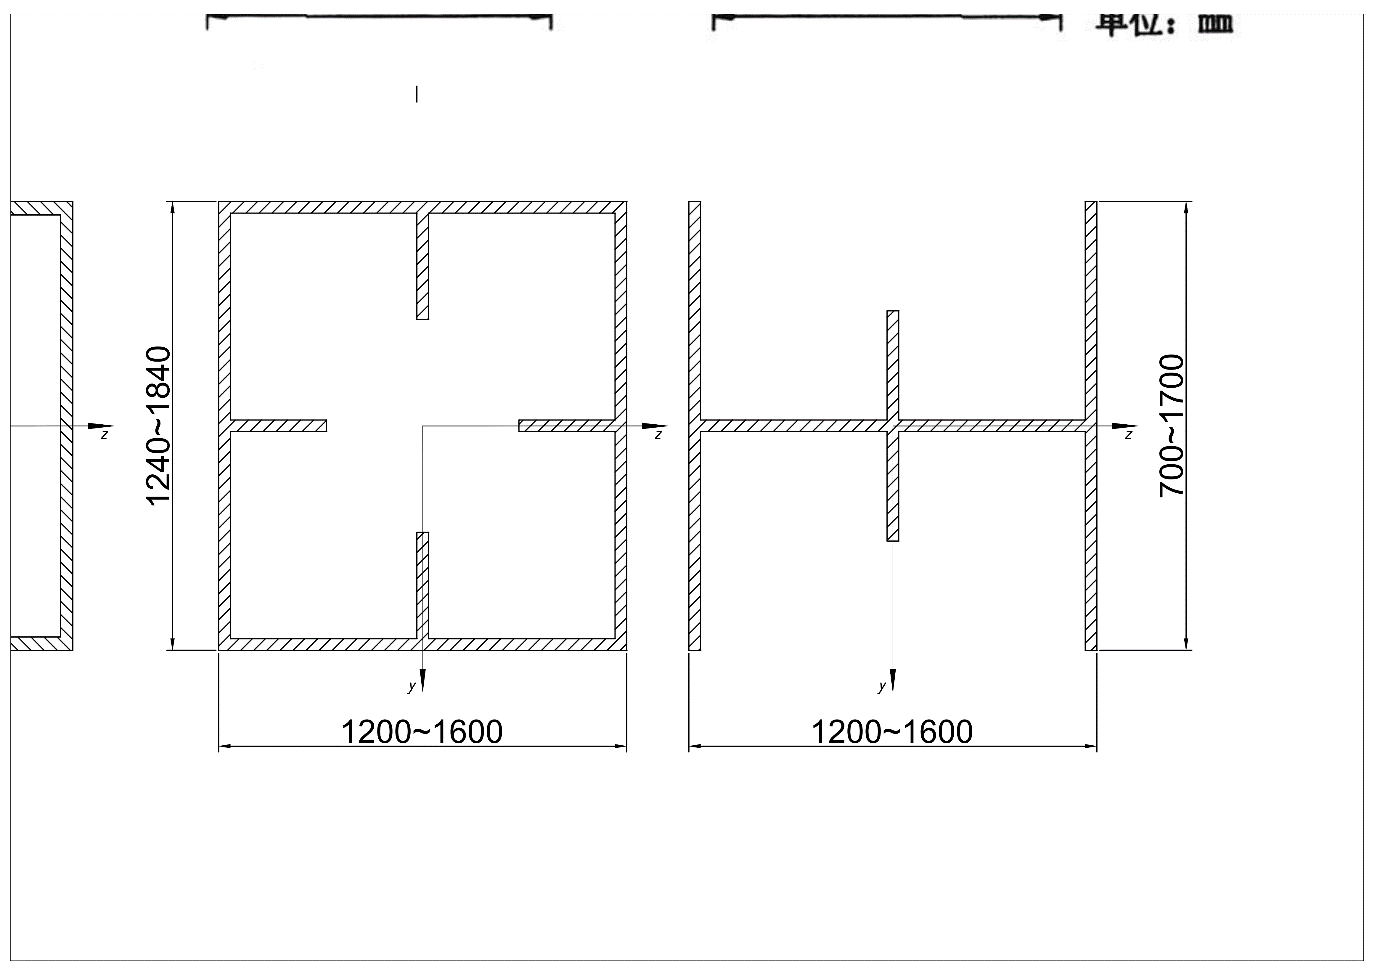
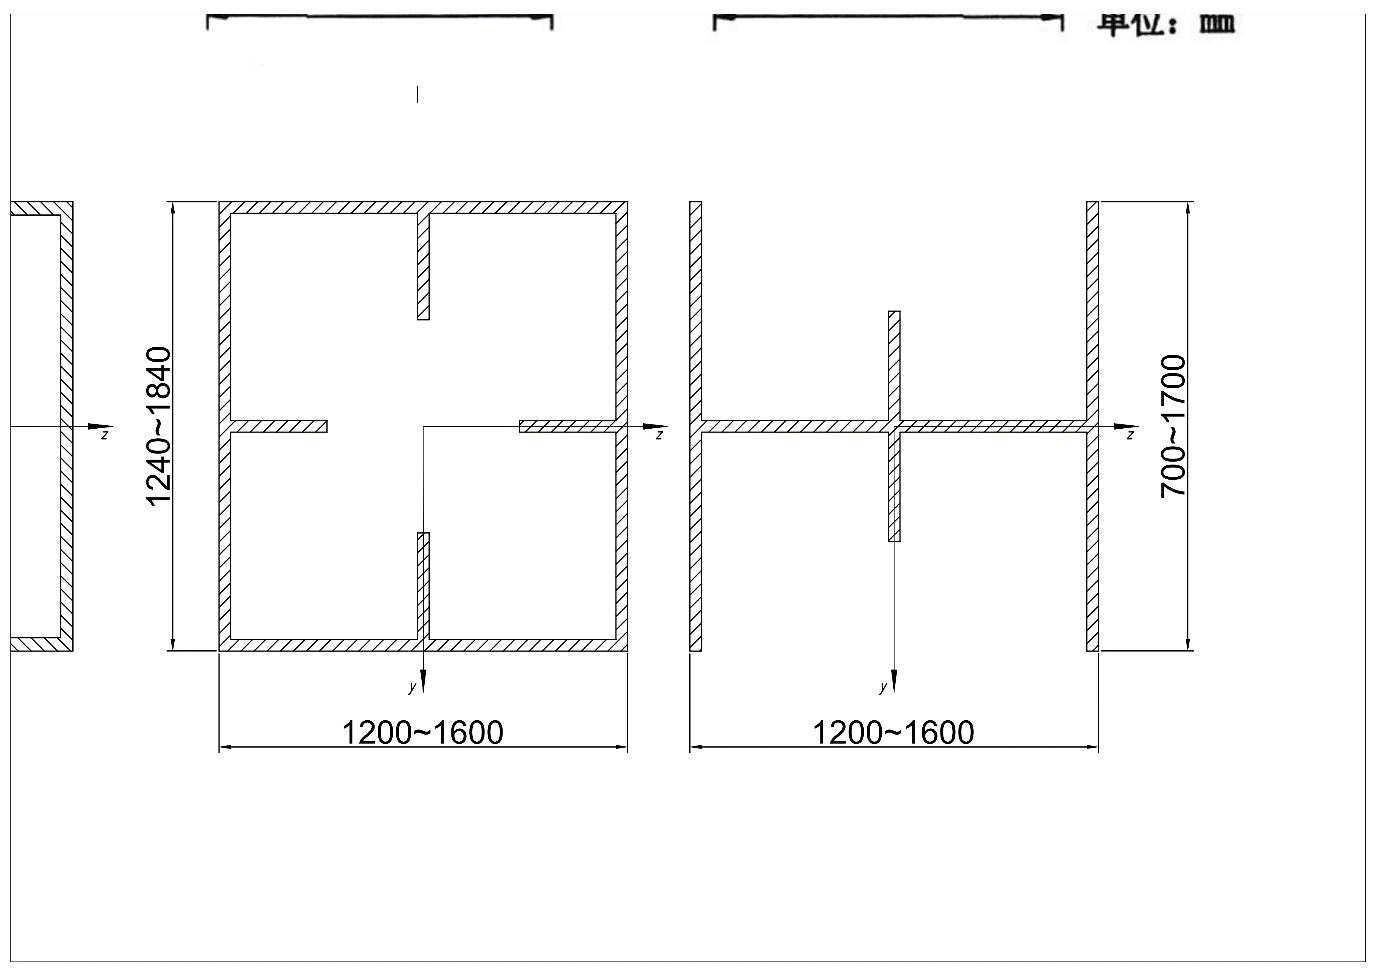
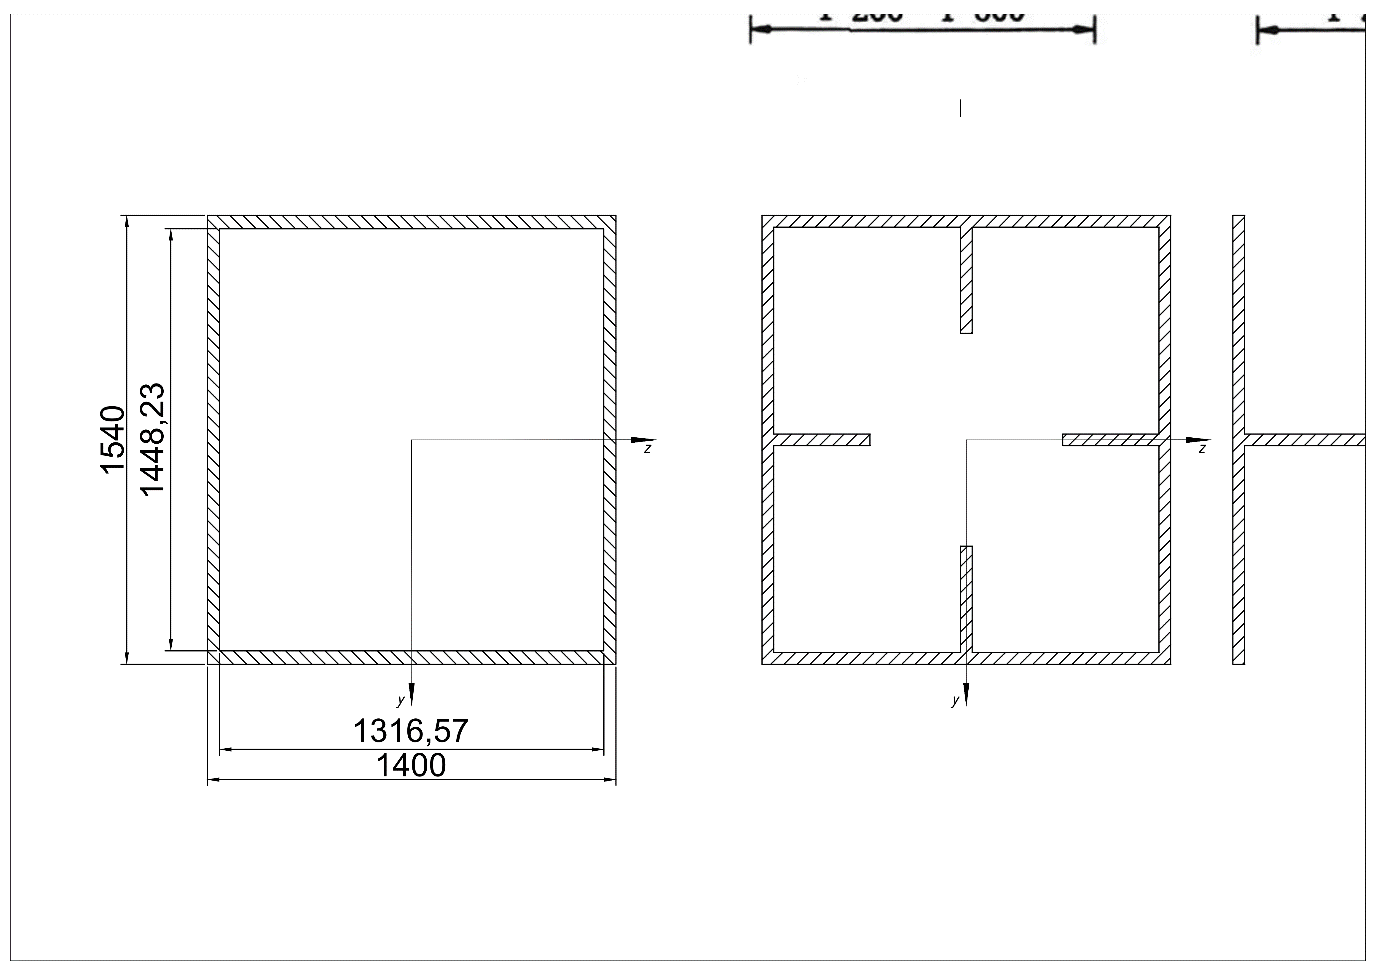
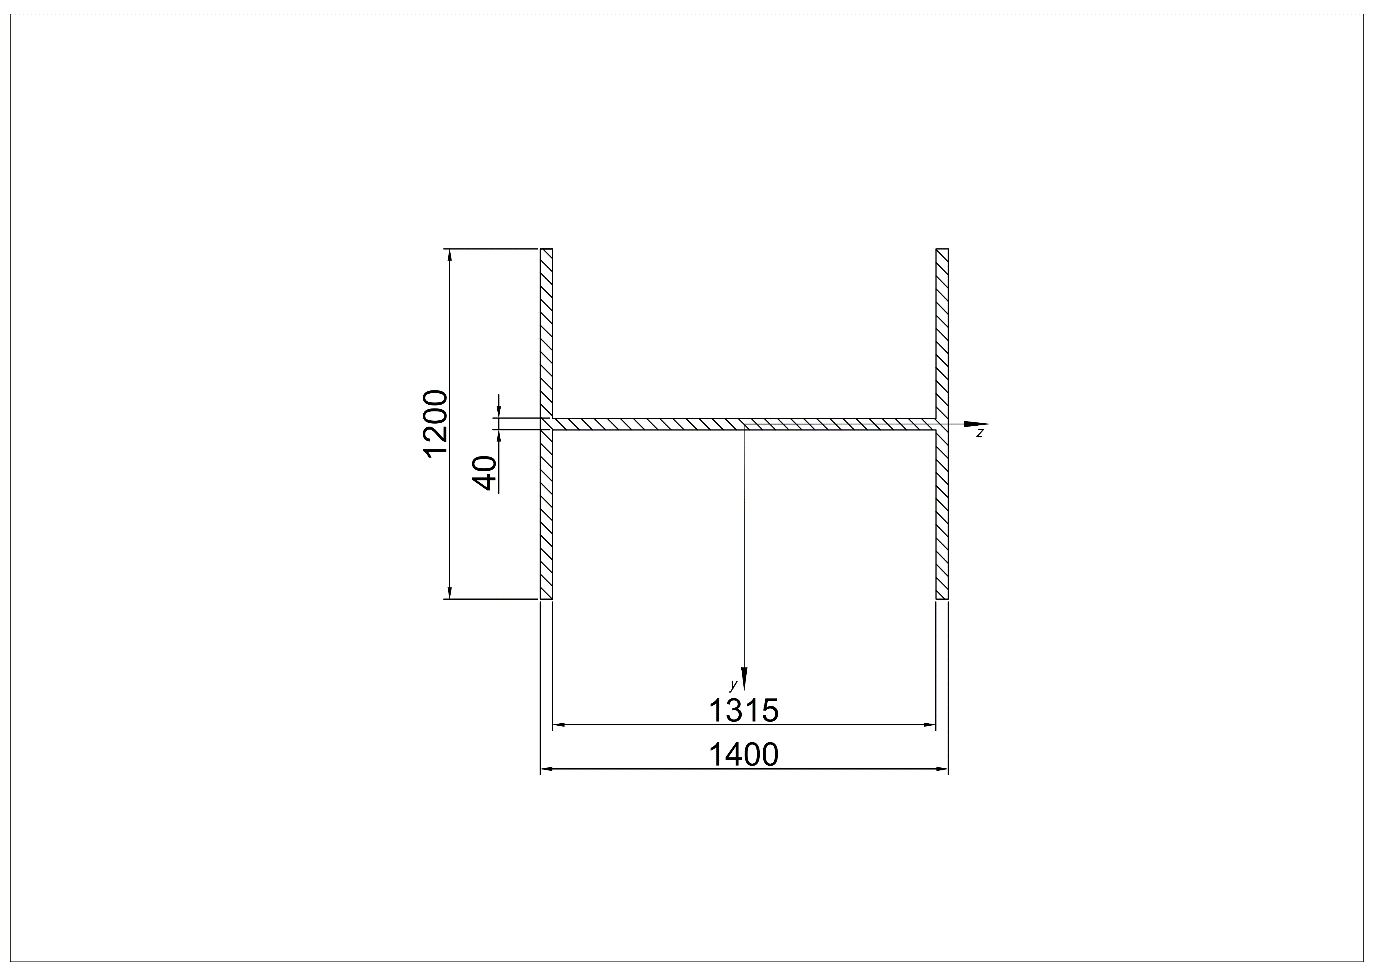
2.2.1. Model simplicity. In this section, two parts of model simplicity will be explained including the structural part and capacity part. For target bridge, the cross-section of chord beam and web beam are different from standard section (i.e., I-section, T-section). Hence, the geometry of those beams is variety according to the design load requirements. Both chord and web beams are shown in Figure 2. To simplify the cross-sections of those beams, three steps were required. (a) the mean width and depth of the beam are calculated. (b) The inertia moment of axis \( Z, Y \) are calculated based on equation (1). (c) The original cross-sections are transformed to Rectangular-section and I-section based on original inertia moment. The equivalented beams and their inertia moment are shown in Figure 3 and Table 1.
\( \begin{matrix}{I_{y}}=\int _{A}{z^{2}}dA & {I_{z}}=\int _{A}{y^{2}}dA \\ \end{matrix}\ \ \ (1) \)
According to the Capacity, the bridge’s beam, cable and concrete deck of the main span is formed by different material. In numerical simulation, all beam’s material of chord is equivalent to Q420qD and web beam is equivalent to Q345qD. And all concrete part is substituted to uniform distribution. In addition, all cable is equivalent to PES139. Detailed information shall be seen in Table 2.
2.2.2. Live load and dead load. The bridge’s live load consists three main portions: High-Speed Train (HST), vehicle load and pedestrian load. Each portion are considered into uniform distribution acted on relevant place. In this case, the maximum axial load of HST is \( 280kN/{m^{2}} \) , which are mainly subjected into the midst axial integral points of the FE model in the second floor. The pedestrian load is \( 3.5kN/{m^{2}} \) , which are mainly subjected into the side points in the first floor. The vehicle load is \( 269.5kN/{m^{2}} \) subjected into both points in each floor.
The bridge’s dead load includes two parts: the self-quality of steel frame and the simplified concrete deck. In this case, the concrete deck is transformed into quasi force ( \( 23.814kN/{m^{2}} \) ) on each floor’s points.
|
| ||||||||
Figure 2. Original cross-section: (left) chord beam; (right) web beam \( (mm) \) (Photo credit: Original). | |||||||||
|
| ||||||||
Figure 3. Modified cross-section: (left) chord beam; (right) web beam (mm) \( . \) (Photo credit: Original) | |||||||||
Table 1. inertia moment of equivalented beams \( (m{m^{4}}) \) . | |||||||||
\( {I_{z}} \) | \( {I_{y}} \) | ||||||||
Rectangular-section | 9.284300E10 | 7.902936E10 | |||||||
I-section | 1.224682E10 | 5.207275E10 | |||||||
Table 2. Detailed information of material. | |||||||||
Material number | Material | Density \( ρ(\frac{kg}{{m^{3}}}) \) | Young modulus E (Pa ) | Poisson's ratio \( ν \) | Yield strength \( {σ_{y}} \) (MPa ) | Sectional area (cable) A (m3) | |||
Q420qD | Steel | 7850 | 2.06E11 | 0.25 | 410 | - | |||
Q345qD | 7850 | 2.10E11 | 0.3 | 345 | - | ||||
PES139 | 7850 | 2.10E11 | 0.3 | 345 | 5.36E-3 | ||||
2.3. Earthquake
To simulate the earthquake load, plenty of methods have been presented (i.e., elastostatic method, equivalent static force method, response spectrum method and time history method). Considering the less stiffness and damping compared to other structure, the elastostatic and equivalent method is no longer fitted. Due to the nonlinear characteristic of arch bridge, the response spectrum method is also no longer fitted. Therefore, the time history analysis is applied in this case.
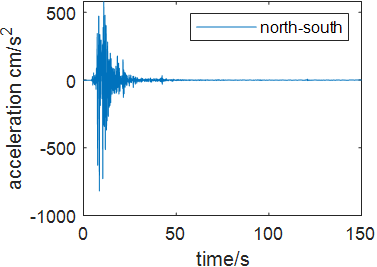
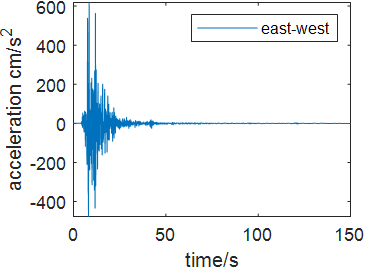
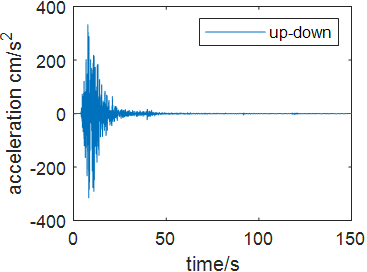
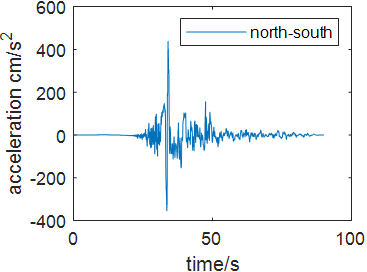
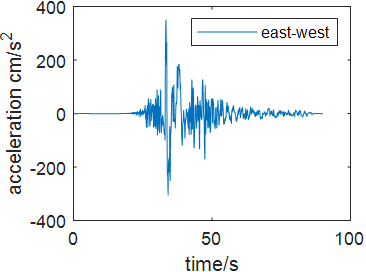
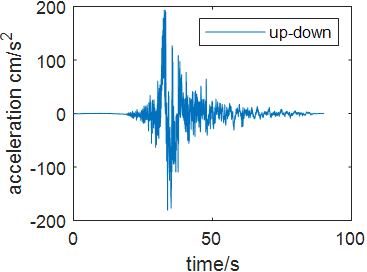
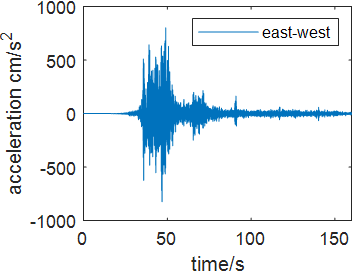
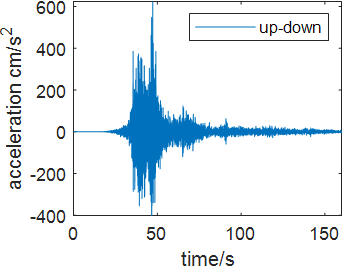
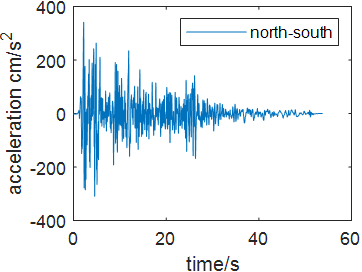
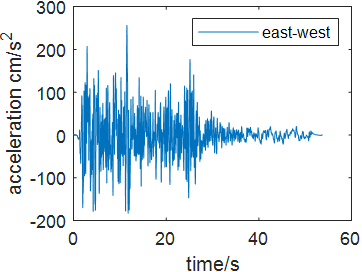
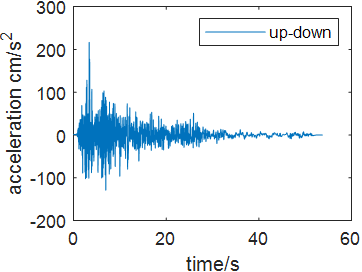
Time history analysis is a nonlinear method enhanced in 1970s which integrates structural motion equation directly under the earthquake wave to generate the time history response. Commonly used time history analysis is Central differential method, Newmark method and Wilson-theta method. Time history integration can be used in both linear seismic resistance analysis and nonlinear seismic resistance analysis. The structural seismic response can be expressed as acceleration, velocity and displacement. In this case, to compare the bridge’s response under different earthquake excitation, four seismic acceleration waves are selected including Wenchuan Earthquake Acceleration (WEA), Chichi Earthquake Acceleration (CEA), Kobe Earthquake Acceleration (KEA) and El-Centro Acceleration (ECA) wave. The damping ratio of the structure is 2%. Figure 4 shows each seismic waves in north-south, east west and up-down direction.
|
|
|
(a) KEA wave | ||
|
|
|
(b) CEA wave | ||
|
|
|
(c) WEA wave | ||
|
|
|
(d) ECA wave | ||
Figure 4. Seismic waves in north-south, east west and up-down direction (Photo credit: Original). | ||

3. Methodology
In this section, a numerical simulation case is presented. The Square Root of Sum of Squares (SRSS) method is applied to compute the response spectrum of earthquake. For the bridge’s Finite Element (FE) model construction, all steel trusses are simulated by 1D elements with Rectangular- and I- section beam. Hence, the Circle-section beam are applied to simulate the cable part with same section area. The integral formulation of beam section is Hughes-Liu beam with cross-section integration. The connection among trusses elements is defined as rigid fixed, whereas, the connection between cable and truss are defined as hinged.
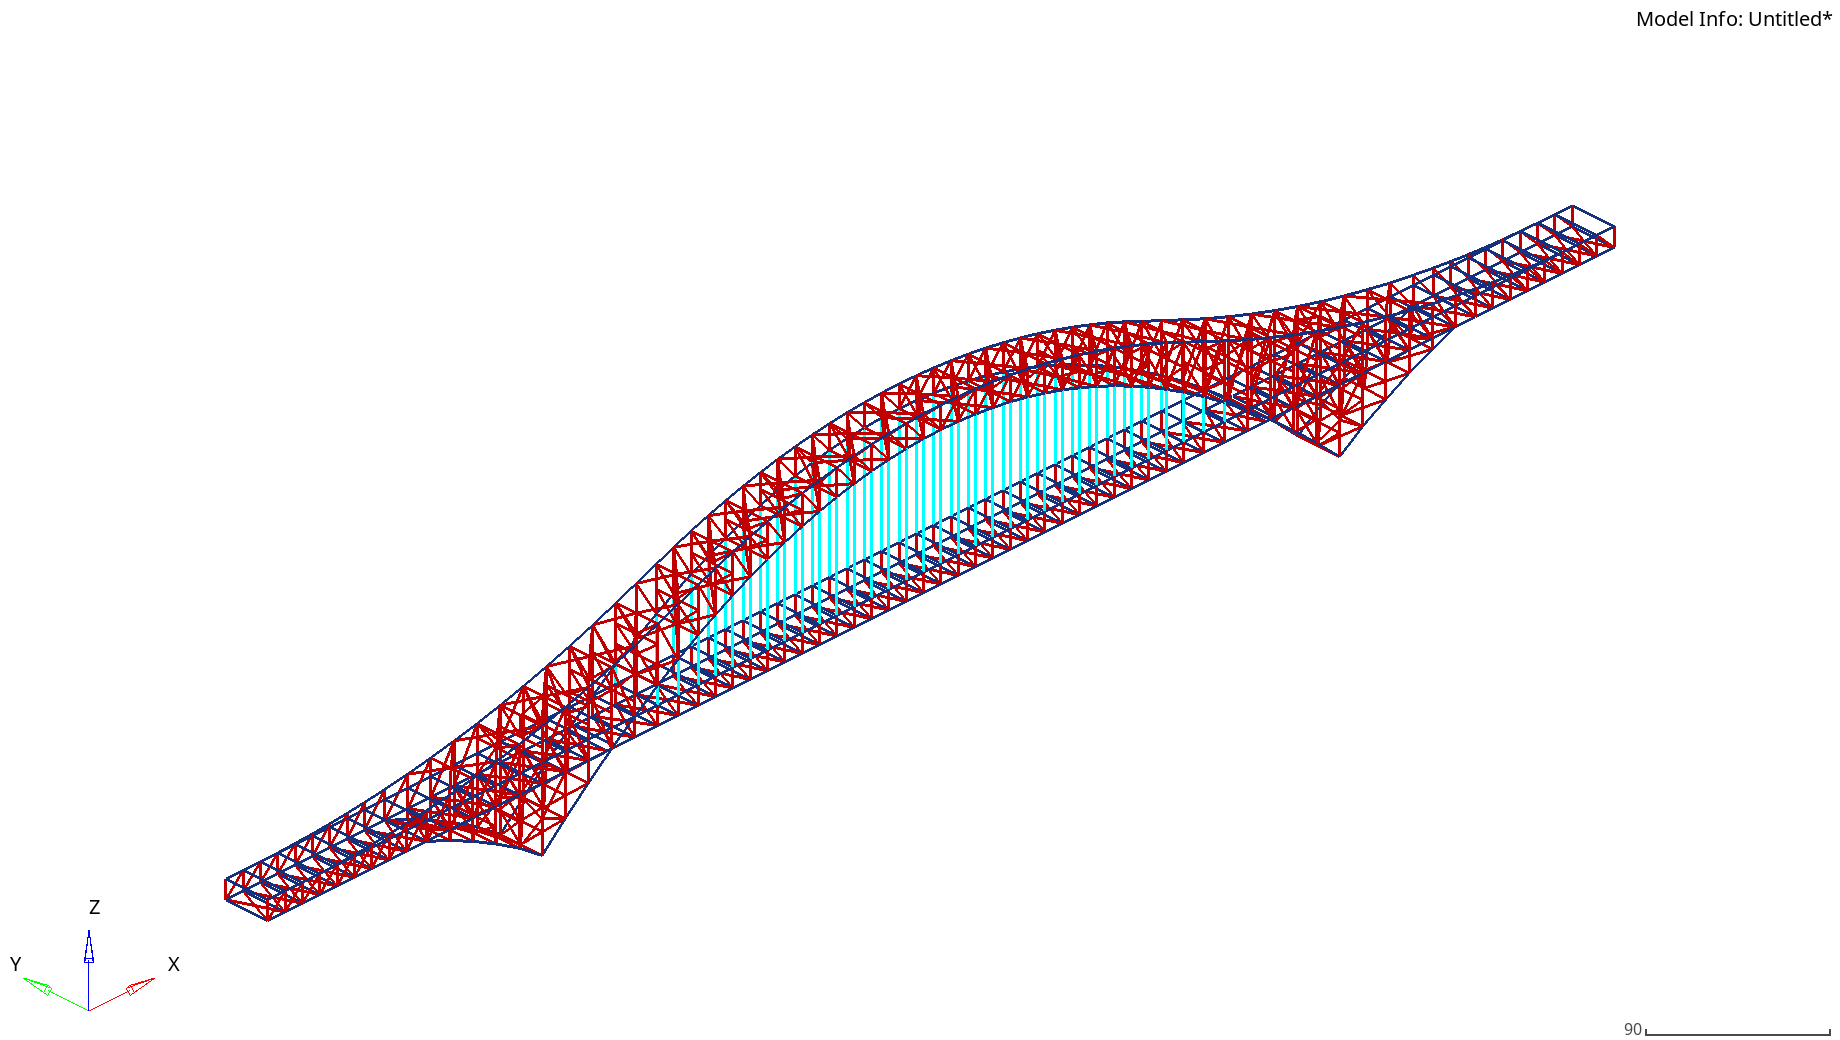
For the live load and dead load subjection, all static loads are subjected on relevant beam parts as mentioned in Section 2.2.2. The earthquake load is subjected on six nodes for two supports based on seismic wave in each axial direction. The 3D FE model is shown in Figure 5. The pretreatment of whole FE model is defined by HYPERMESH software. The posttreatment is visualized by LS-PREPOST software.
|
Figure 5. The FE model from HYPERMESH (Photo credit: Original). |
4. Results and discussion
For analysis result, three time-moments are selected based on maximum acceleration for each earthquake wave direction to analysis relevant axial and shear stress of structure.
4.1. Dynamic analysis of main deck
Based on previous calculation methodology, the stiffness matrix \( K \) and mass matrix \( M \) of the bridge are constructed. The undamped free vibration equations for bridges can be written as equation (2). And the characteristic equation of the bridge can be written as equation (3).
\( M\ddot{δ}+Kδ=0\ \ \ (2) \)
\( ({K-ω^{2}}M)A=0\ \ \ (3) \)
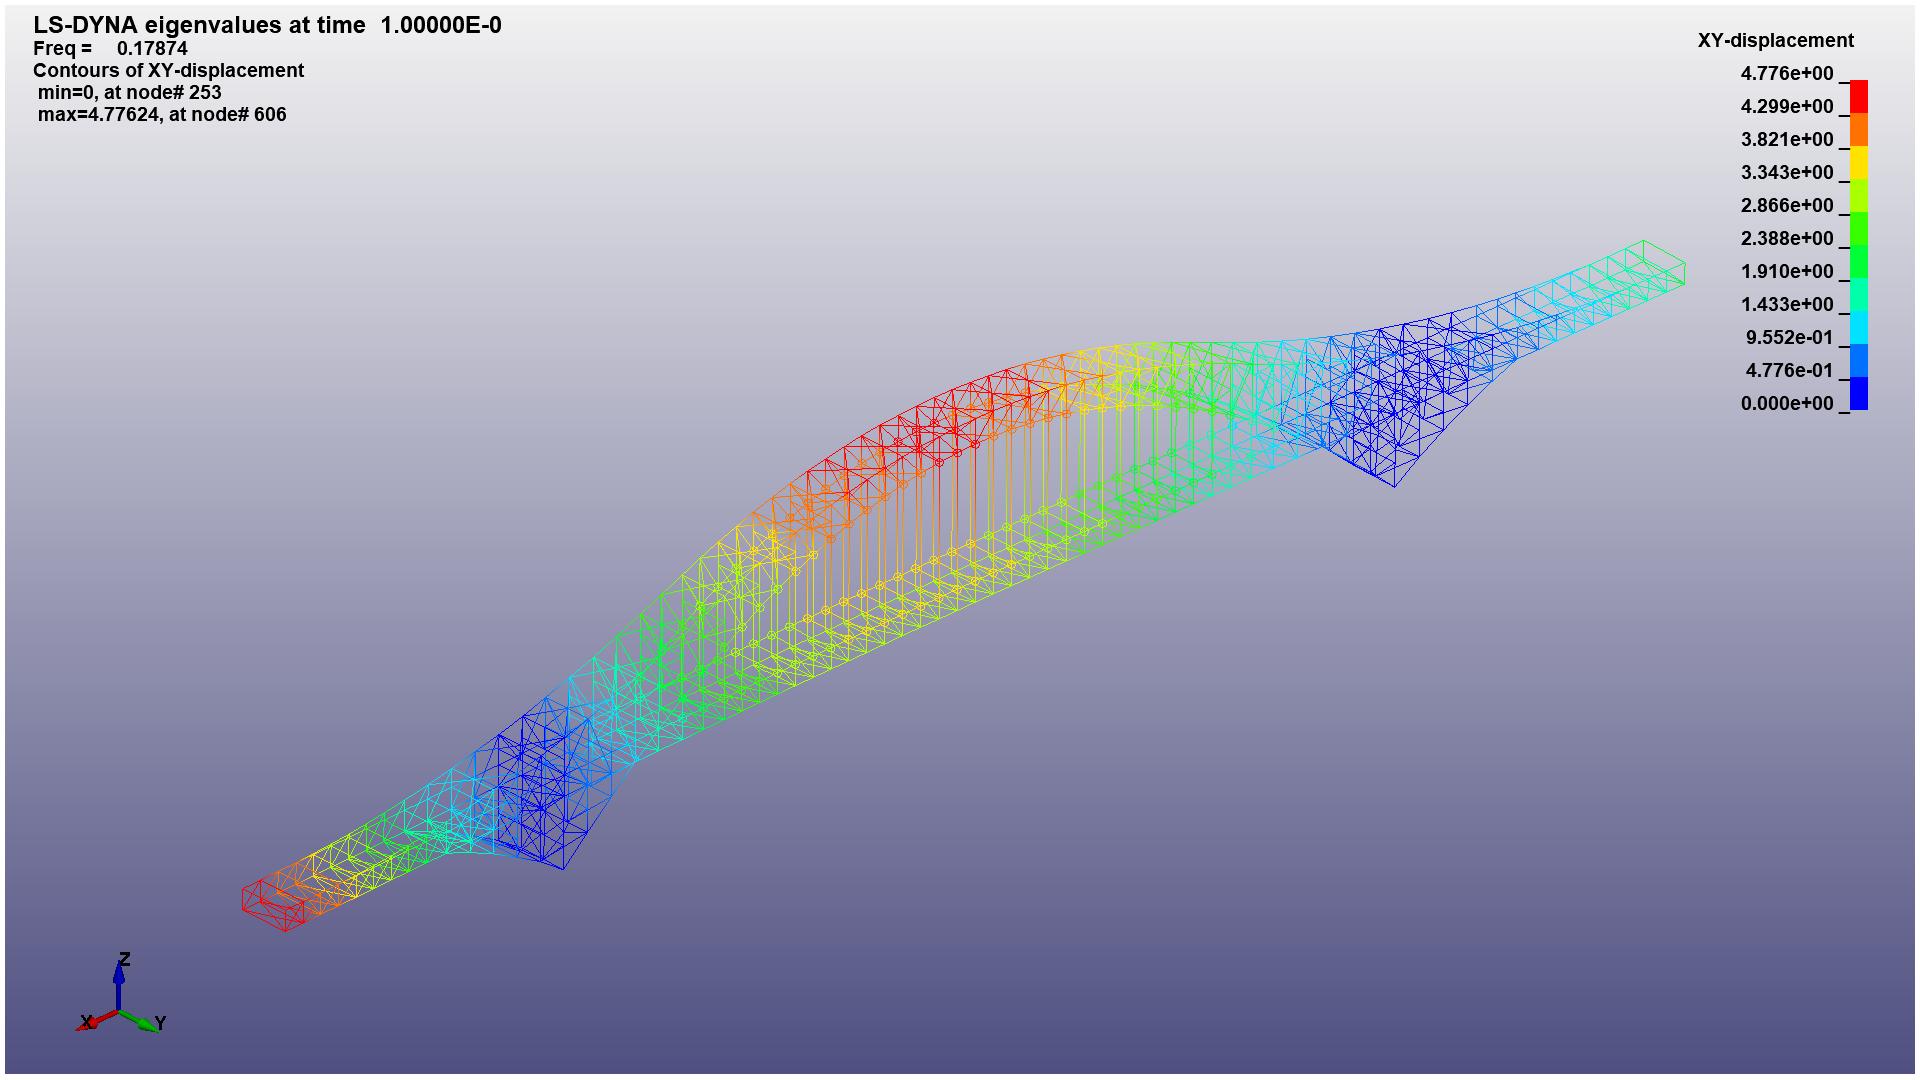
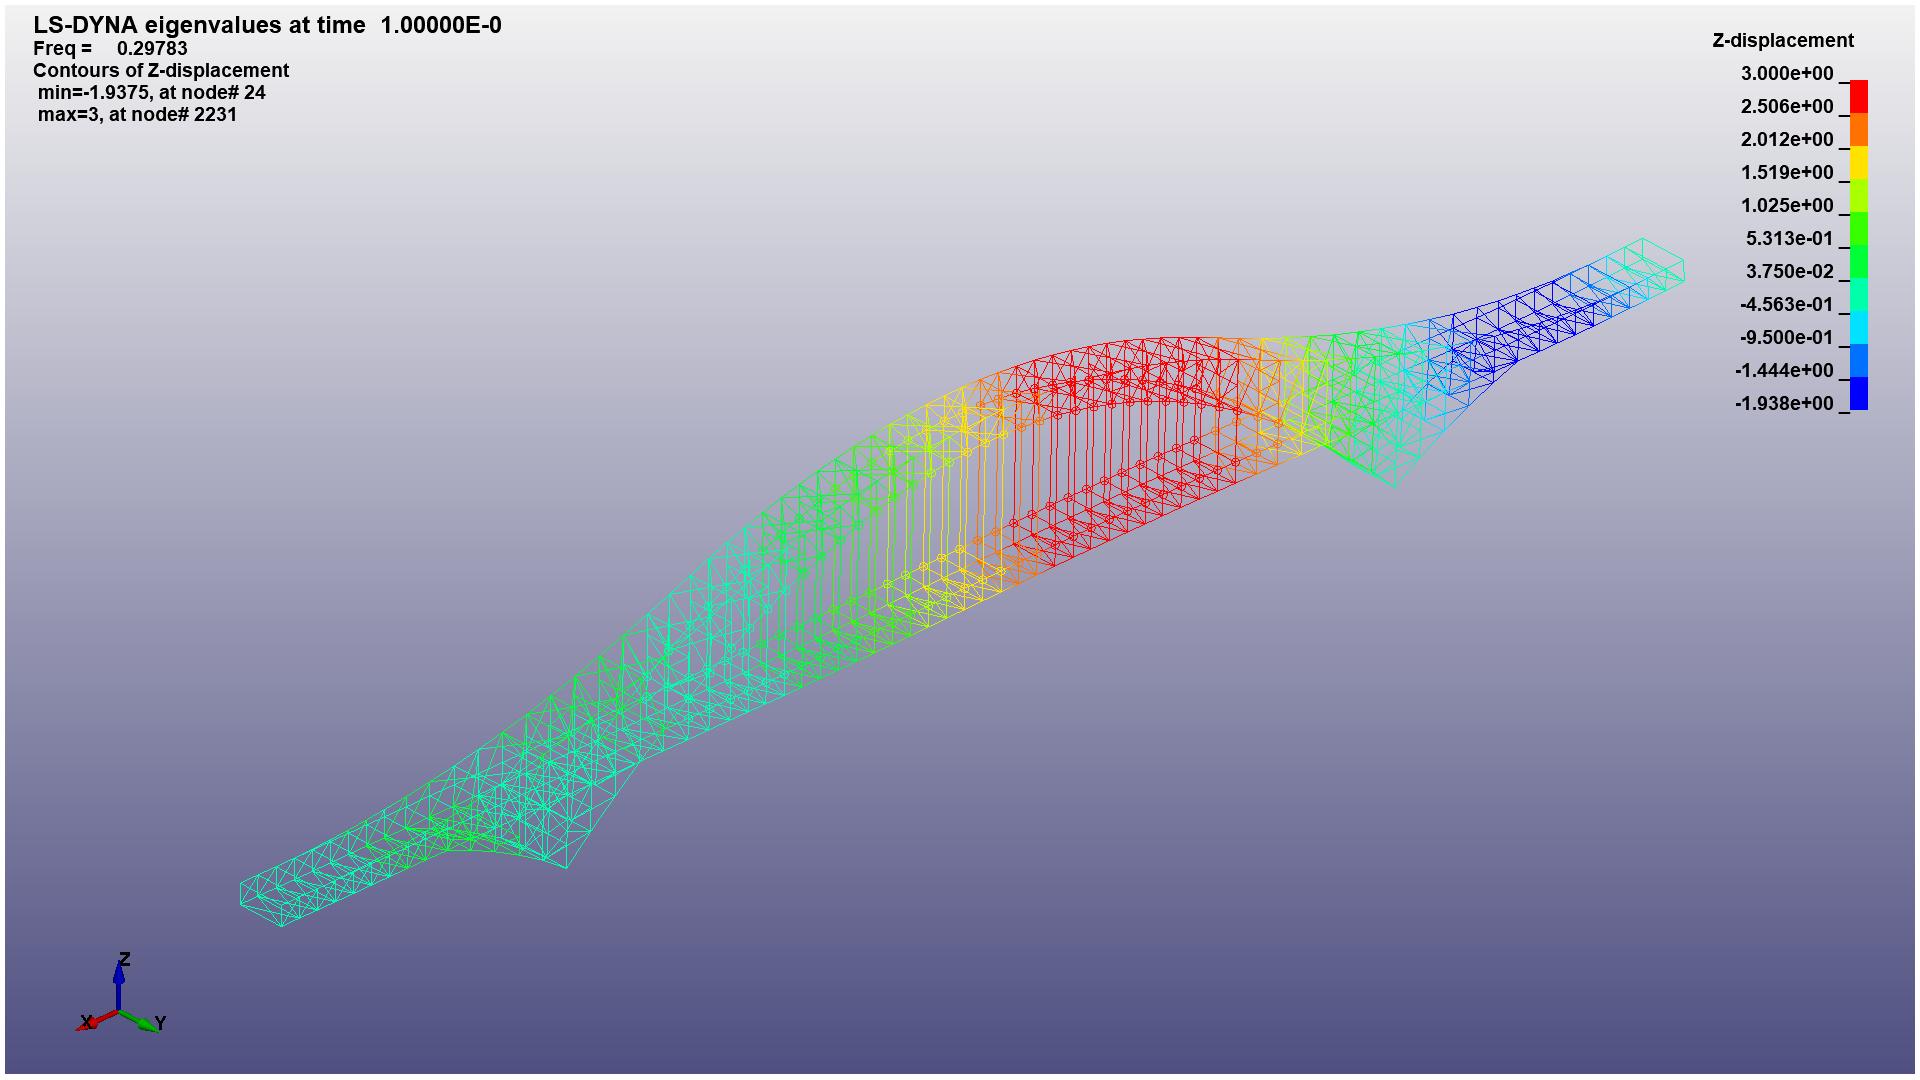
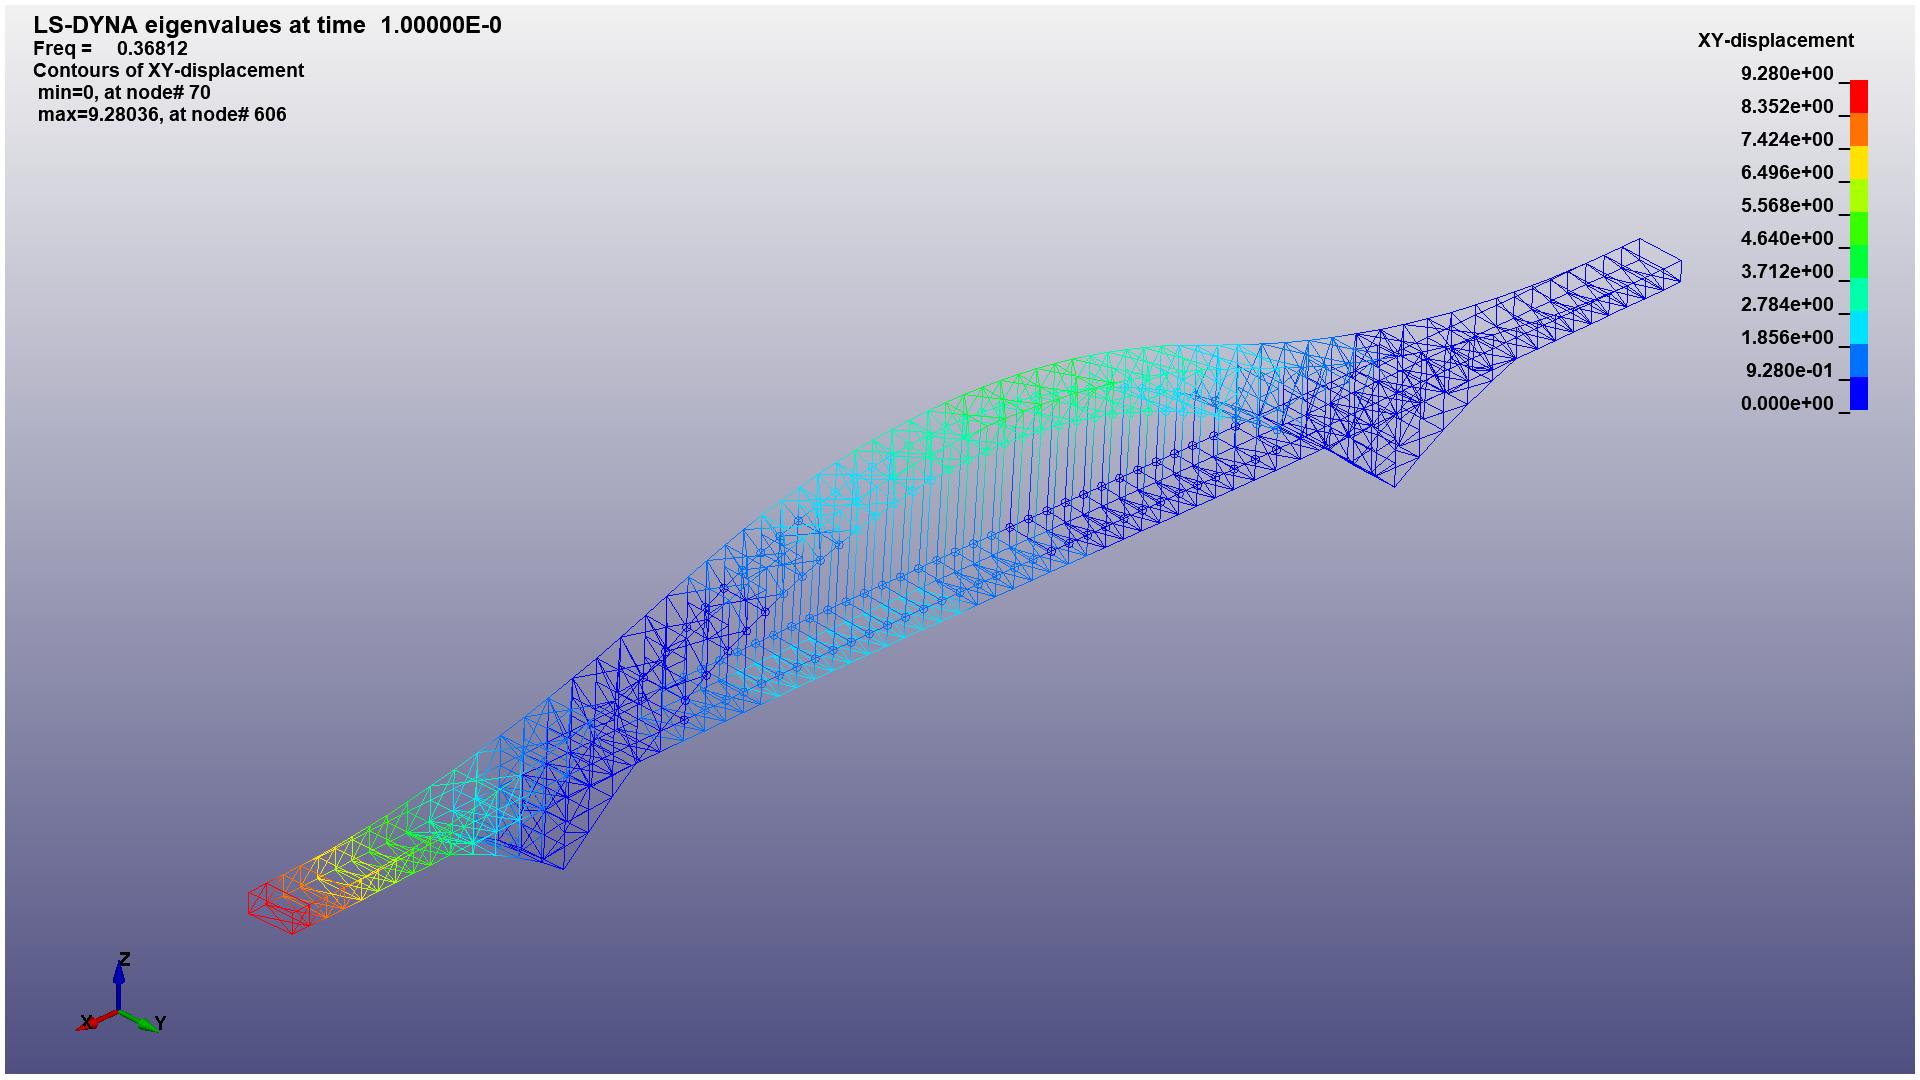
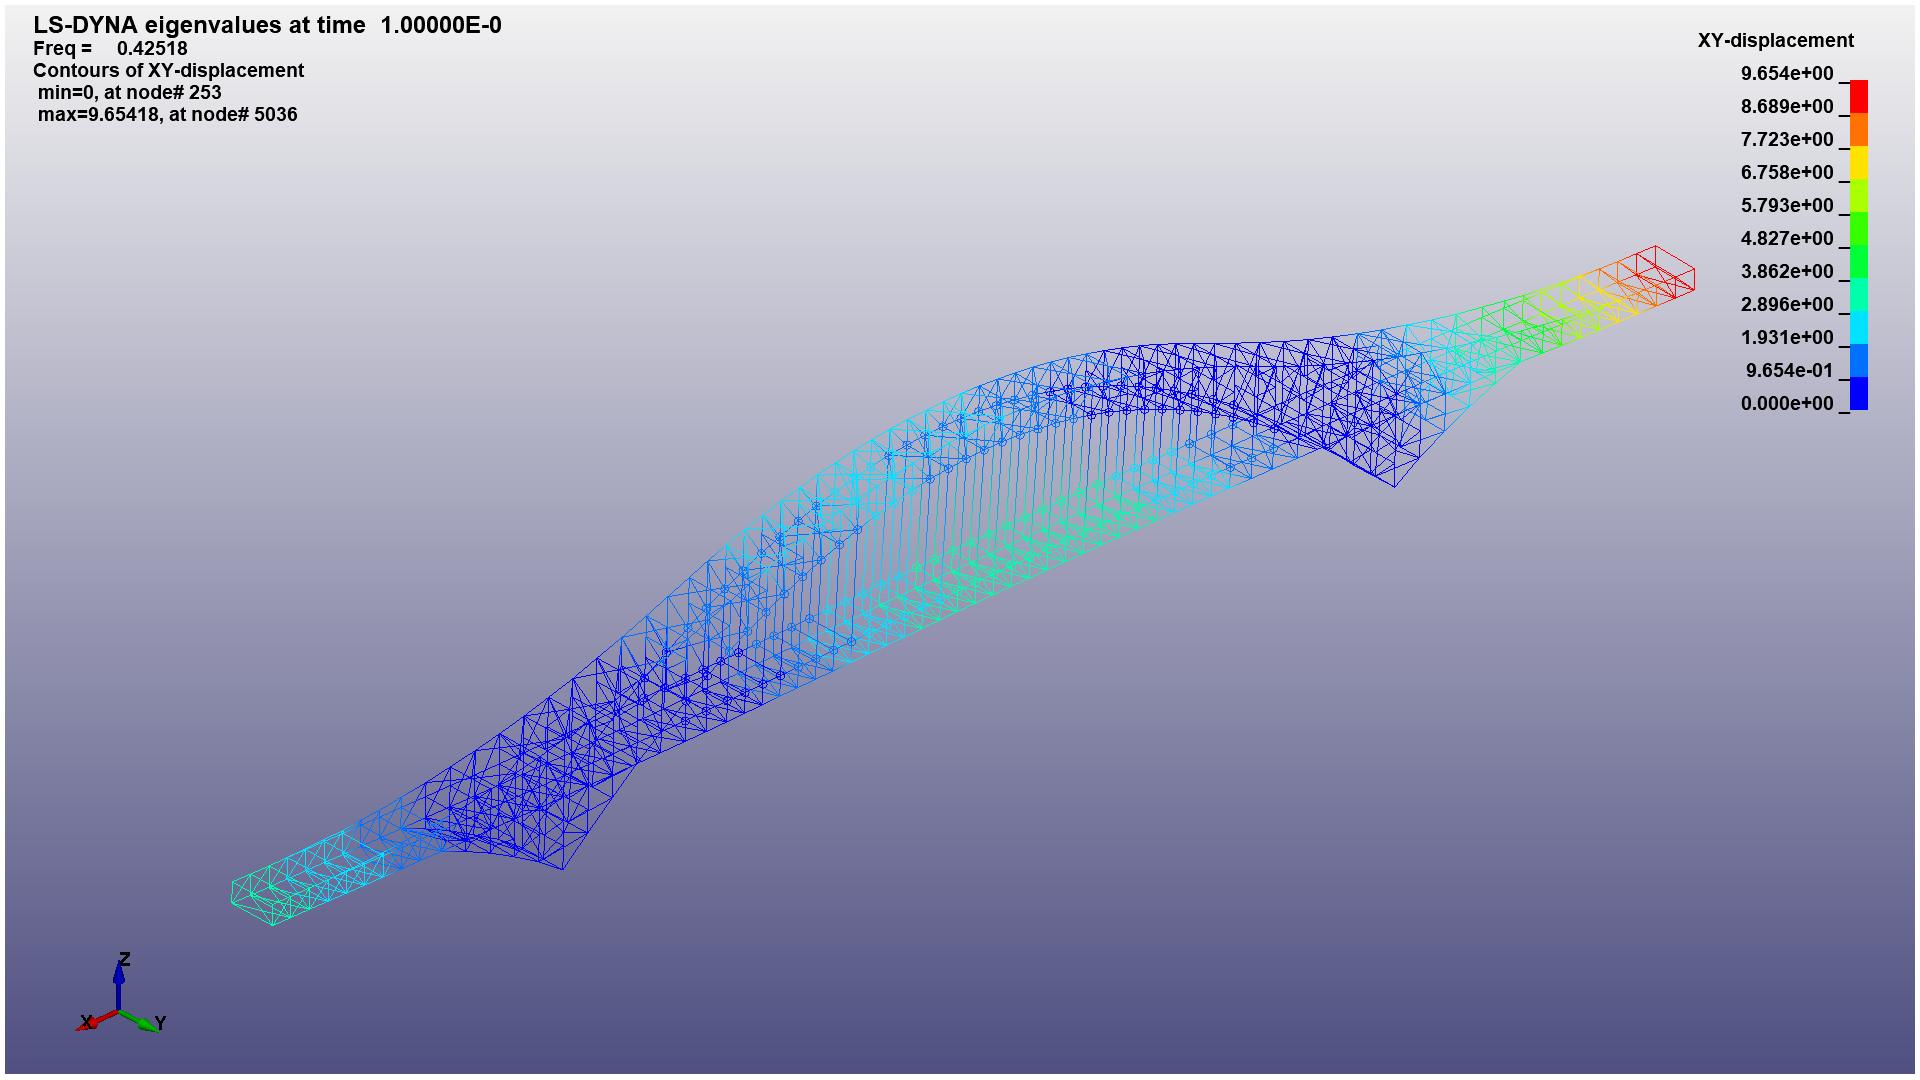
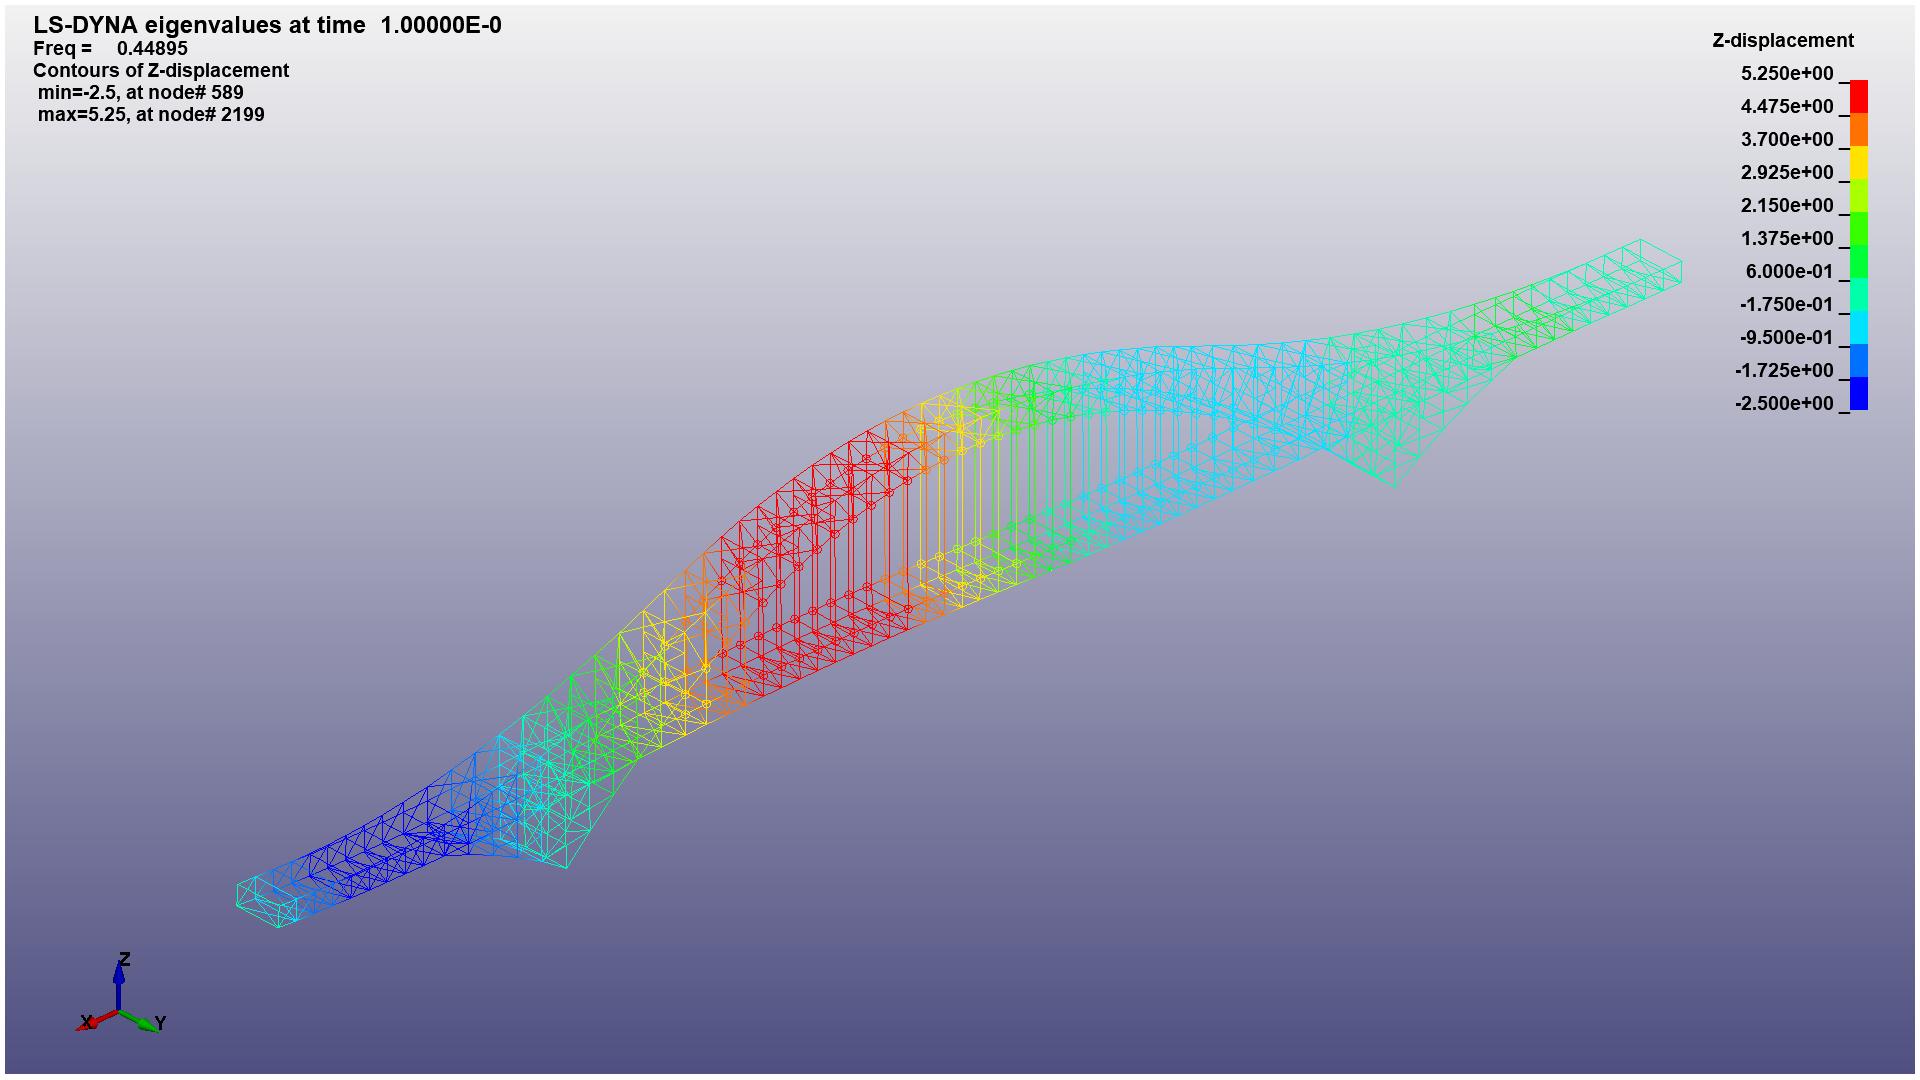
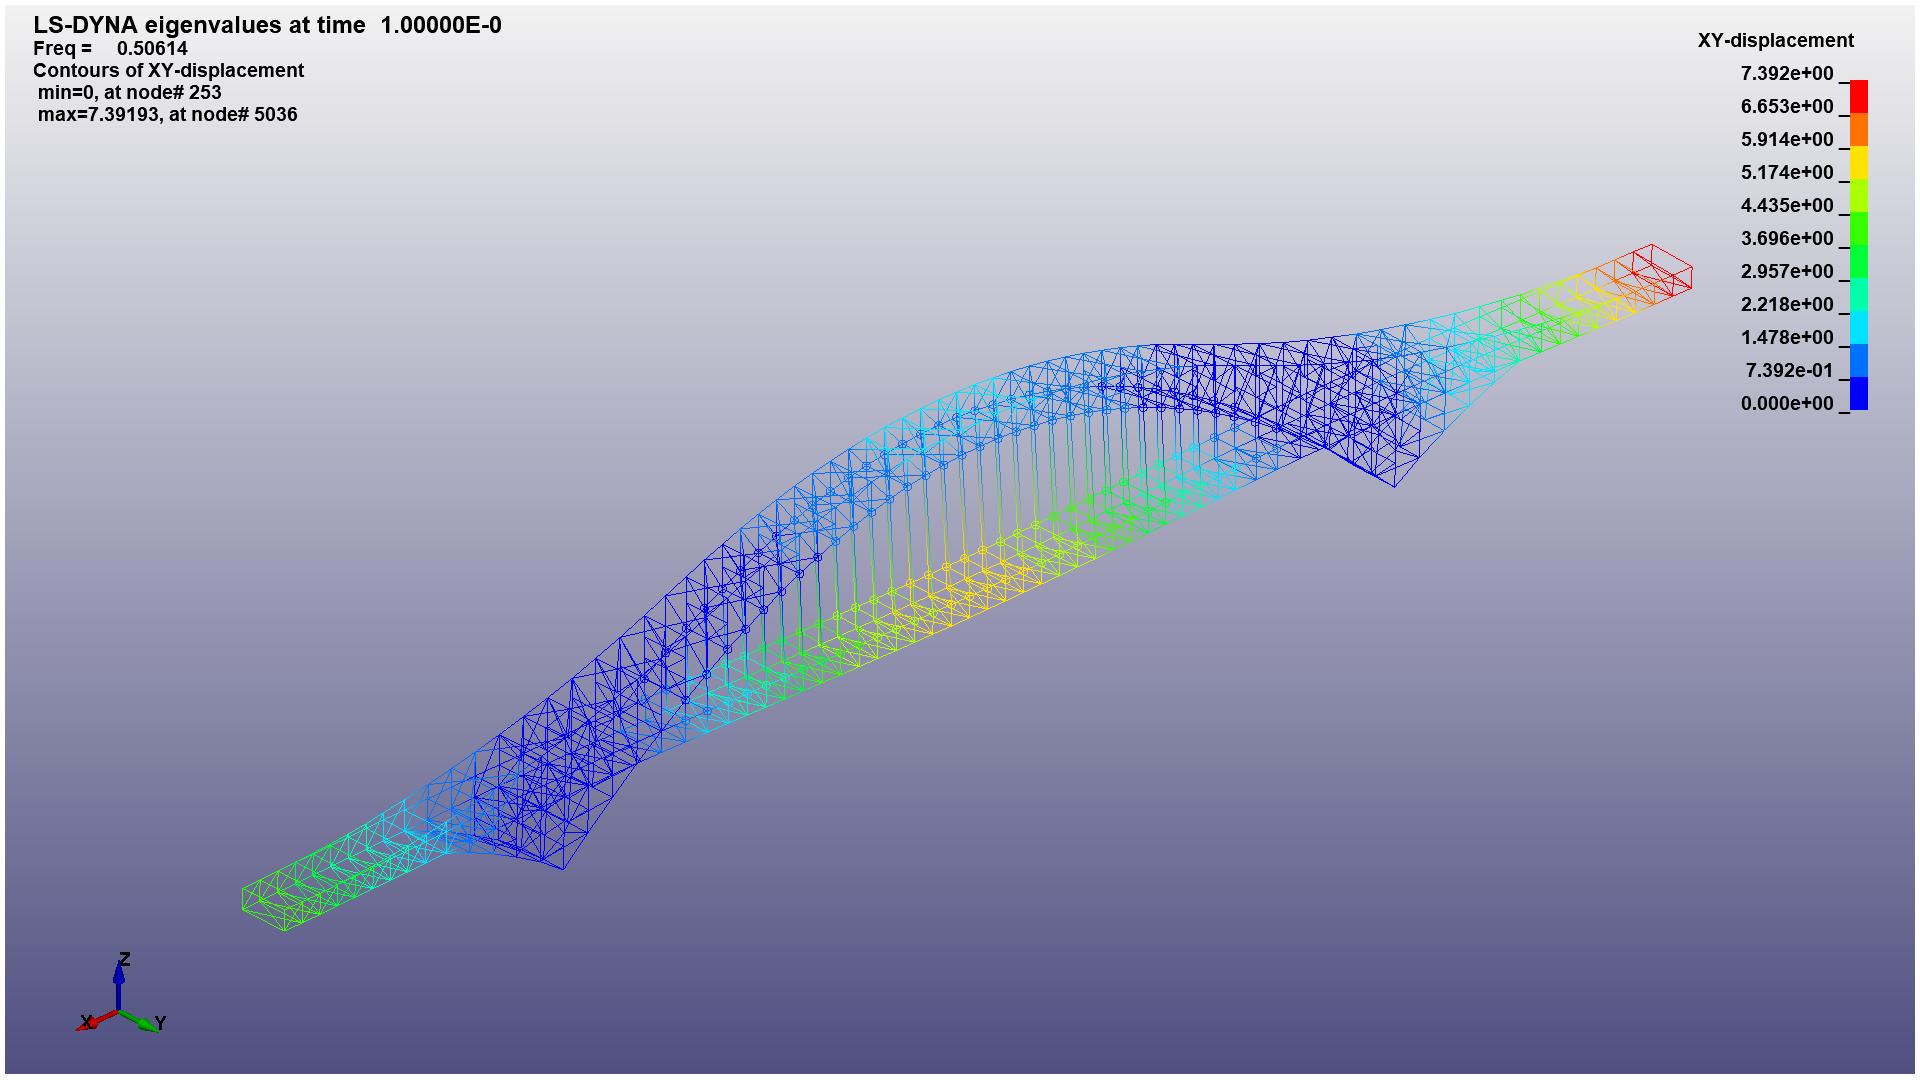
By using the keyword card IMPLICIT-EIGENVALUE of LS-DYNA, the first 20 orders of modalities are obtained. The vibration displacement of first 1-6 orders of modalities are shown in Figure 6.
|
(a) 1st mode of the structure with XY-displacement |
|
(b) 2nd mode of the structure with Z-displacement |
|
(c) 3rd mode of the structure with XY-displacement |
|
(d) 4th mode of the structure with XY-displacement |
|
(e) 5th mode of the structure with Z-displacement |
|
(f) 6th mode of the structure with XY-displacement |
Figure 6. The y-axial displacement of 1-6 mode (Photo credit: Original). |
4.2. WEA wave analysis.
Wenchuan earthquake’s seismic intensity is \( 11 deg \) , which could be considered as exceedance probability lower than 2~3%. According to Code for Seismic Design of Building (GB 50011-2010), structure under seismic excitation exceedance probability 2~3% should not collapse. For Wenchuan earthquake excitation wave, the maximum acceleration is: \( 802.713 cm/{s^{2}} \) direction north-south at time \( 48.515 s \) , \( -824.157 cm/{s^{2}} \) direction east-west at time \( 68.86s \) and \( 622.918 cm/{s^{2}} \) direction up-down at time \( 47.24 s \) . Detailed simulation information for WEA wave is shown in Table 3.
Table 3. Some of detailed information of WEA wave. | ||||
Seismic direction | Stress direction | Maximum stress (Pa) | Shear direction (local) | Maximum shear (Pa) |
North-south | Tension | 2.265e09 | XZ | 1.284e09 |
Compression | 1.941e09 | XY | 8.815e08 | |
East-west | Tension | 2.628e09 | XZ | 8.133e08 |
Compression | 2.349e09 | XY | 1.134e09 | |
Up-down | Tension | 1.842e09 | XZ | 5.557e08 |
Compression | 1.981e09 | XY | 9.926e08 | |
For north-south maximum acceleration, considering axial stress, roughly 60% beams’ axial force are at 5.827e08-1.621e08 Pa (tension) and 35% beams’ axial stress are at 6.789e08-2.584e08 Pa (compression). More than 95% beams are lower than the ultimate strength of 6.900e08 Pa and remain a certain safety threshold, which means most of the beam elements will not fall and thus the whole structure will not collapse. For GB 50011-2010, the target bridge could be maintained during huge earthquake (exceedance probability 2~3%). Less than 5% beams’ axial stress are higher of them, which located at the end of upper supported components for side spans, symbolizing the support system of side span could be of major consideration during seismic excitation compared to the rest of the bridge’s components. Under similar seismic events, those elements contain higher probability for axial failure.
The maximum axial tensile stress is: 2.265e09 Pa for maximum north-south acceleration, which highly exceed the ultimate strength and will cause tensile failure.
Considering shear stress, generally 90% beams’ XZ direction (local coordinate system) shear stress is at a low level of -1.153e08-8.454e07 Pa, which visualize the probability of shear failure in XZ direction is safe for shear ultimate strength 3.25e8 Pa. 85% beams’ XY direction shear stress is at -3.407e07-1.185e08, which also is safe. The maximum shear stress is 1.284e10 at the 2nd fixed-support side main deck component, which presents a higher dangerous rate at the end of the main deck in both sides. However, considering the capability of support system, the shear failure of those elements cannot cause the collapse of the whole bridge.
For east-west maximum acceleration, 90% beams’ axial stress are at -1.754e08-3.121e08 Pa which remain safety. Maximum axial stress is at 2.628e09 (tensile) located at the end of upper supported components for side spans which mentioned before. 90% beam’s XZ direction shear stress is at -6.235e07-1.128e08 Pa and maximum XZ shear stress is 1.134e09 Pa located also at the 2nd fixed-support side main deck component. 70% beams’ XY direction shear stress is at -1.574e08-9.207e06 Pa and maximum XZ shear stress is 1.284e09 Pa.
For up-down maximum acceleration, simultaneously, 90% beams’ axial stress are at -6.917e07-3.131e08 and maximum axial stress is at 1.981e09 Pa (compression). 90% beams’ XY direction shear stress is at -9.131e07-3.810e07 Pa and maximum XY shear stress is 8.815e08 Pa.
4.3. KEA wave analysis.
Kobe earthquake is similar to Wenchuan earthquake, which can be both consider to huge earthquake as exceedance probability lower than 2~3%. Table 4 illustrate some of the detailed information of KEA wave acceleration.
In KEA wave analysis, the whole structure consists higher displacements compared to WEA. However, the average and maximum tensile and shear stresses are smaller than WEA excitation, which are no longer put in this section. The dangerous elements and components are similar to WEA either, which is the end of upper supported components for side spans (axial stress) and the 2nd fixed-support side main deck component.
In conclusion, the target bridge is considered not collapse based on two exceedance probability lower than 2~3% earthquake, which satisfies the huge earthquake design standard of GB 50011-2010. However, two vulnerable areas are identified, which contains higher probability of failure and furthermore, cause the whole bridge’s collapse. Additionally, these vulnerable areas can be treated as dangerous places for the rest of same type’s bridge.
Table 4. Some of detailed information of KEA wave. | ||||||
Maximum acceleration ( \( cm/{s^{2}} \) ) | Time ( \( s \) ) | Seismic direction | Stress direction | Maximum stress ( \( Pa \) ) | Shear direction (local) | Maximum shear (Pa) |
-818.379 | 8.520 | North-south | Tension | 3.714e08 | XZ | 1.368e08 |
Compression | 1.186e08 | XY | 5.996e08 | |||
617.693 | 8.440 | East-west | Tension | 5.486e08 | XZ | 1.687e08 |
Compression | 1.106e09 | XY | 7.824e08 | |||
332.472 | 7.720 | Up-down | Tension | 4.046e08 | XZ | 1.259e08 |
Compression | 3.668e08 | XY | 2.423e08 | |||
4.4. CEA wave analysis.
Based on GB 50011-2010, the seismic resistance of bridge follows remain repairability under middle earthquake (exceedance probability at the level of 10%). In this case, based on literature research, CEA wave could be defined as middle earthquake. Compared with WEA and KEA, most of the stress on the elements of target bridge should under the ultimate strength. Detailed information is shown in Table 5.
Table 5. Some of detailed information of CEA wave. | ||||||
Maximum acceleration ( \( cm/{s^{2}} \) ) | Time ( \( s \) ) | Seismic direction | Stress direction | Maximum stress ( \( Pa \) ) | Shear direction (local) | Maximum shear ( \( Pa \) ) |
438.418 | 33.995 | North-south | Tension | 4.180e08 | XZ | 9.594e08 |
Compression | 7.005e08 | XY | 5.537e08 | |||
345.685 | 33.355 | East-west | Tension | 2.666e08 | XZ | 7.541e08 |
Compression | 2.958e08 | XY | 3.176e08 | |||
193.544 | 32.615 | Up-down | Tension | 1.971e08 | XZ | 8.684e08 |
Compression | 1.728e08 | XY | 1.328e08 | |||
For north-south maximum acceleration, 80% beams’ axial stress are between -2.408e07~6.088e07. 80% and over 90% beams’ XZ direction and XY direction shear stress are between -2.097e07~5.958e06 Pa and -7.973e07~7.369e06 Pa, respectively, which are lower than yield strength and thus remained in linear elastic stage. According to table 5, the maximum axial and shear force are at the level ultimate strength, which have a certain of probability to failure. Compared to huge earthquake event, the location of maximum stresses is at the support components in the bottom of the bridge, which demonstrate another vulnerable component for the bridge’s design. Compared to huge earthquake, middle earthquake effects more frequently, and the support components consist the whole bridge’s weight. Therefore, they share a similar or higher important state for the end of upper supported components for side spans and numbers of fixed-support side main deck components based on huge earthquake event.
4.5. ECA wave analysis.
The ECA wave is an artificial generated wave based on El-Centro wave. In this case, ECA wave is identified as a small earthquake event, which is applied to measure the bridge’s vulnerability under earthquake exceedance probability beneath 63%. For small earthquake event, the all-elements stress should beneath the yield strength. Detailed information is shown in table 6.
For north-south maximum acceleration, generally 70% elements’ axial stress are between -1.357e07~1.688e07 Pa and 28% elements’ axial force are between -4.402e07~-1.357e07 Pa, which are highly lower than yield strength and thus remained in linear elastic stage. Most of the elements are not produce plastic deformation or failure. Roughly, more than 90% elements’ XZ direction and XY direction shear stress are between -4.846e06~4.655e06 Pa and -1.237e07~1.058e07 Pa, respectively.
However, the maximum axial stress is 1.691e08 Pa and maximum shear stress is 6.185e08 Pa on XZ direction, which reaches the yield strength of material. For east-west and up-down maximum acceleration, similar to north-south case, most of elements’ axial and shear stress are lower than yield strength and contend a certain of safety threshold. However, the maximum axial and shear stress are exceeded to yield strength and approaches the maximum axial and shear stress on CEA case (middle earthquake event). The higher maximum stress will cause over large structural response and finally induce fatigue rupture after the earthquake event. Therefore, it is identified that the seismic resistance capability of target structure under small earthquake excitation still have higher potential to improve.
Table 6. Some of detailed information of ECA wave. | ||||||
Maximum acceleration ( \( cm/{s^{2}} \) ) | Time ( \( s \) ) | Seismic direction | Stress direction | Maximum stress ( \( Pa \) ) | Shear direction (local) | Maximum shear ( \( Pa \) ) |
331.227 | 2.16 | North-south | Tension | 1.691e08 | XZ | 6.185e08 |
Compression | 1.354e08 | XY | 1.271e08 | |||
244.741 | 11.49 | East-west | Tension | 5.085e08 | XZ | 2.837e08 |
Compression | 8.515e08 | XY | 5.627e08 | |||
216.743 | 3.37 | Up-down | Tension | 3.649e08 | XZ | 1.663e08 |
Compression | 3.190e08 | XY | 5.430e08 | |||
5. Conclusion
In this paper, an extra-large dual used transportation arch bridge is selected to measure its resistance under earthquake excitation. Four different time history waves of Chinese notable seismic are established as an earthquake load input to compare the performances of target bridge. Respectively, two waves (WEA and KEA) are considered as exceedance probability less than 2~3% to assess the bridge’s vulnerability under huge earthquake excitation. After that, CEA wave and ECA wave are separately subjected to analysis bridge vulnerability under middle and small earthquake event. Meanwhile, first 20th modes are generated to identify the dangerous components in earthquake vibration. The main result can be listed as 7 parts.
(1) Based on literature research, 68 earthquake events are found in the located bridge’s province. The seismic resistant performance is one of the major concerns under the bridge’s environment. Therefore, the seismic analysis of the bridge is significant important for the safety of the bridge and its traffic.
(2) The commercial FE analysis software LS-DYNA is used to simulate the seismic response of target bridge. By doing the mode analysis, the 1st, 3rd,4th and 6th mode is horizontal vibration, which shares higher response under horizontal seismic excitation.
(3) For each four seismic events analysis, in general, the bridge achieves the Chinese structure seismic resistance standard GB 50011-2010.
(4) Based on huge earthquake excitation, two components of the end of upper supported components for side spans and numbers of fixed-support side main deck components are considered vulnerable. For target structure, the side spans consist lower stiffness, which are more frequently affected by vibration action. Arch structures with similar type are also have a higher risk for those components, and thus deserve more frequent monitoring to maintain the material capability.
(5) Based on middle earthquake excitation, the supporting components are identified as another dangerous area based on maximum axial stress which need to be specially monitored.
(6) The result of small seismic event analysis shows that, although, target bridge presents enough seismic resistance capability for huge and middle earthquake. However, the maximum axial and shear stress of ECA are approached to CEA and KEA wave. This phenomenon illustrates that the bridge have relatively lower resistance ability for small earthquake action, which have a probability to lead to fatigue rupture.
(7) In this paper, the numerical method is plied to analysis target bridge, however, correctability of results should still be validated be experimental study. Hence, detailed analysis of a certain of components should be approached to quantify the precise damage rate and failure type compared to overall analysis.
References
[1]. Xing C, Wang H, Xu Z and Liang R 2022 Stochastic Analysis of a Large-Span Continuous Girder High-Speed Railway Bridge under Fully Non-Stationary Earthquake Appl. Sci. 12(24) p 12684
[2]. Guo W, Hu Y, Liu H and Bu D 2019 Seismic Performance Evaluation of Typical Piers of China’s High-Speed Railway Bridge Line Using Pushover Analysis Math. Prob. Eng. p 9514769
[3]. Vamvatsikos D and Cornell A 2002 Incremental dynamic analysis Earthq. Eng. Struct. Dyn. 31 pp 491-514
[4]. Liu X, Jiang L, Xiang P, Feng Y, Lai Z and Zhou W 2022 Running Safety of High-Speed Railway Train on Bridge During Earthquake Considering Uncertainty Parameters of Bridge Int. J. Struct. Stab. Dy. 22 p 10
[5]. Faroz A, Pujari N, Ghosh K, Ghosh J and Shekhar S 2016 Time-varying seismic fragility assessment of a corroding RC bridge pier considering non-uniform corrosion World Conf. Earthq. 16 p 1670
[6]. Kita A, Cavalagli N, Masciotta G, Lourenço B and Ubertini F 2020 Rapid post-earthquake damage localization and quantification in masonry structures through multidimensional non-linear seismic IDA Eng. Struct. 219 p 110841
[7]. Kita A, Cavalagli N, Venanzi I and Ubertini F 2021 A new method for earthquake-induced damage identification in historic masonry towers combining OMA and IDA B. Earthq. Eng. 19 pp 5307-37
[8]. Guo A, Shen Y, Bai J and Li H 2017 Application of the endurance time method to the seismic analysis and evaluation of highway bridges considering pounding effects Eng. Struct. 131 pp 220-230
[9]. Estekanchi H, Riahi T and Vafai A 2011 Application of endurance time method in seismic assessment of steel frames Eng. Struct. 33 pp 2535-46
[10]. Gao W 2008 Dynamic model test of Chongqing Chaotianmen Yangtze River Bridge (Master's thesis, Chongqing Jiaotong University)
[11]. Duan X, Li L and Xu W 2010 Design and technical characteristics of the main bridge of Chongqing Chaotianmen Yangtze River Bridge Bridge Construction 2 pp 37-40
Cite this article
Yang,F. (2023). Seismic vulnerability analysis on an extra-large highway-railway dual-used arch bridge. Applied and Computational Engineering,24,25-37.
Data availability
The datasets used and/or analyzed during the current study will be available from the authors upon reasonable request.
Disclaimer/Publisher's Note
The statements, opinions and data contained in all publications are solely those of the individual author(s) and contributor(s) and not of EWA Publishing and/or the editor(s). EWA Publishing and/or the editor(s) disclaim responsibility for any injury to people or property resulting from any ideas, methods, instructions or products referred to in the content.
About volume
Volume title: Proceedings of the 2023 International Conference on Functional Materials and Civil Engineering
© 2024 by the author(s). Licensee EWA Publishing, Oxford, UK. This article is an open access article distributed under the terms and
conditions of the Creative Commons Attribution (CC BY) license. Authors who
publish this series agree to the following terms:
1. Authors retain copyright and grant the series right of first publication with the work simultaneously licensed under a Creative Commons
Attribution License that allows others to share the work with an acknowledgment of the work's authorship and initial publication in this
series.
2. Authors are able to enter into separate, additional contractual arrangements for the non-exclusive distribution of the series's published
version of the work (e.g., post it to an institutional repository or publish it in a book), with an acknowledgment of its initial
publication in this series.
3. Authors are permitted and encouraged to post their work online (e.g., in institutional repositories or on their website) prior to and
during the submission process, as it can lead to productive exchanges, as well as earlier and greater citation of published work (See
Open access policy for details).
References
[1]. Xing C, Wang H, Xu Z and Liang R 2022 Stochastic Analysis of a Large-Span Continuous Girder High-Speed Railway Bridge under Fully Non-Stationary Earthquake Appl. Sci. 12(24) p 12684
[2]. Guo W, Hu Y, Liu H and Bu D 2019 Seismic Performance Evaluation of Typical Piers of China’s High-Speed Railway Bridge Line Using Pushover Analysis Math. Prob. Eng. p 9514769
[3]. Vamvatsikos D and Cornell A 2002 Incremental dynamic analysis Earthq. Eng. Struct. Dyn. 31 pp 491-514
[4]. Liu X, Jiang L, Xiang P, Feng Y, Lai Z and Zhou W 2022 Running Safety of High-Speed Railway Train on Bridge During Earthquake Considering Uncertainty Parameters of Bridge Int. J. Struct. Stab. Dy. 22 p 10
[5]. Faroz A, Pujari N, Ghosh K, Ghosh J and Shekhar S 2016 Time-varying seismic fragility assessment of a corroding RC bridge pier considering non-uniform corrosion World Conf. Earthq. 16 p 1670
[6]. Kita A, Cavalagli N, Masciotta G, Lourenço B and Ubertini F 2020 Rapid post-earthquake damage localization and quantification in masonry structures through multidimensional non-linear seismic IDA Eng. Struct. 219 p 110841
[7]. Kita A, Cavalagli N, Venanzi I and Ubertini F 2021 A new method for earthquake-induced damage identification in historic masonry towers combining OMA and IDA B. Earthq. Eng. 19 pp 5307-37
[8]. Guo A, Shen Y, Bai J and Li H 2017 Application of the endurance time method to the seismic analysis and evaluation of highway bridges considering pounding effects Eng. Struct. 131 pp 220-230
[9]. Estekanchi H, Riahi T and Vafai A 2011 Application of endurance time method in seismic assessment of steel frames Eng. Struct. 33 pp 2535-46
[10]. Gao W 2008 Dynamic model test of Chongqing Chaotianmen Yangtze River Bridge (Master's thesis, Chongqing Jiaotong University)
[11]. Duan X, Li L and Xu W 2010 Design and technical characteristics of the main bridge of Chongqing Chaotianmen Yangtze River Bridge Bridge Construction 2 pp 37-40