


1. Introduction
As is known to all, energy consumption has become a key problem in today's society. According to the previous report, the construction field accounts for one-third of the total energy consumption [1]. Based on this background, more and more countries and regions began to pay attention to energy saving in the field of construction, and countries began to formulate relevant policies to strengthen the supervision of building energy conservation and increase funding for the research and development of energy-saving materials. In the four decades since the 1973 oil embargo, for example, America has launched a series of programmes to encourage energy efficiency in residential and commercial buildings [2]. One of the energy-saving materials mentioned above is high reflectivity paints, which is widely used in cool roofs. Cool roof is the roof with high reflectance. Its surface is coated with high reflectance materials to reduce the absorption of solar heat energy, so as to achieve the purpose of energy-saving of air-conditioner [3]. In general, the reflectivity of cool roofs to solar thermal energy is around 60% [4]. In addition to the cool roof, there is another kind of roof which can also play a role in saving energy for air-conditioner, which is called “green roof”. Green roof is the planting of a layer of vegetation on the outermost layer of the roof, through the transpiration of plants to carry away the heat of the house, thus achieving the effect of energy saving of air-conditioner [5].
In the past, some scholars have studied cool or green roofs around the world and they have made comparison of their working mechanism or their impacts on energy-saving, environment-protecting. Shi et al. added white roofs (WR) and Sedum tray garden roof (STGR) to the roofs of office buildings in five cities located in four climate zones of China, in order to simulate the reconstruction of the roof, and conducted a 40-year life cycle cost analysis on both types of the roofs [6]. He et al. conducted field experiments in Shanghai to quantify the differences in thermal and energy performance between two different types of roofs (cool roofs, green roofs), and measured the thermal performance of green roofs, cool roofs, and ordinary roofs in summer and winter. Through the measurement results, they found that in summer, both green and cool roofs have cooling effects, and cool roofs have stronger cooling effects. In winter, green roofs can provide good insulation compared to cool roofs [7]. In addition, there are some studies focused on cities of other countries about comparison of cool and green roofs. Iovan Battista Cavadini et al. studied the effects of cool and green roofs on rooftop photovoltaic(PV) power generation under temperature conditions in Zurich, Switzerland, and found that in terms of increasing photovoltaic power generation, cool roofs are superior to green roofs [8]. Julian Sproul et al. used a 50-year life cycle cost analysis (LCCA) to provide an economic outlook for the selection of roof types. The results show that cool roofs and green roofs can provide valuable annual net savings. Owners who are concerned about global warming and local environmental benefits also choose different types of roofs. The former should choose a cool roof, while the latter should choose a green roof [9].
There have been many studies comparing the energy-saving performance and economic benefits of cool roofs and green roofs in different regions, in order to facilitate the selection of the optimal roof setting scheme for buildings in different climate zones. Yang et al. used EnergyPlus to compare and analyse the work of cool roofs and green roofs on summer design days [10]. They found that during peak hours, cool roofs are stronger in reducing heat flux through roofs than green roofs. In another study, Zinzi et al. investigated the annual heating and cooling loads of residential buildings with cool and green roofs located in different regions of the Mediterranean [11]. The results indicate that due to different climates, the total energy demand of green roofs is sometimes more sometimes less compared to cool roofs. However, when green roofs are kept moist, the total energy demand of green roofs is always less compared to cool roofs under all climatic conditions.
In the last few years, a limited number of studies have shown the comparison of cool roof and green roof in retail buildings, as well as focused on cities of all the climate zones in America. In response to research gap, this study chose retail buildings as the research object, considering their unique characteristics compared to other buildings like residential buildings and office buildings. The functions and nature of retail buildings often determine their location which are always in the bustling areas of cities. Retail buildings often have characteristics such as large volume, concentrated space, and high pedestrian flow [12], making it crucial to maintain comfortable temperature and humidity in the building. Meanwhile, the energy-saving effects of cool roof and green roof in different climate zones in the United States are analysed and compared. The reason why this study chooses the buildings of 16 American cities as research samples is that these 16 cities have complete meteorological data and are located in different climate zones, which can be compared more intuitively after simulation. Finally, the data of 2004 are chosen because the energy saving system of the United States was not very effective in this year and the energy saving effect of green roof and cool roof could be more directly reflected in the data. In addition, this study aims to carry out energy-saving renovations on old buildings, as in the past, energy conservation standards were lower and energy consumption was higher.
2. Methodology
2.1. Building model
A building model built by Energyplus originated from a Standalone Retail and its type is retail building, as shown in Figure 1. The building is 54.25 m long and 42.37 m wide, with only one floor and a total area of 2294.24 square meters. The building is divided into five different thermal zones, as shown in Figure 2. The roof of the entire house is a composite roof, consisting of three parts--Roof membrane, roof insulation, metal decking [13].
.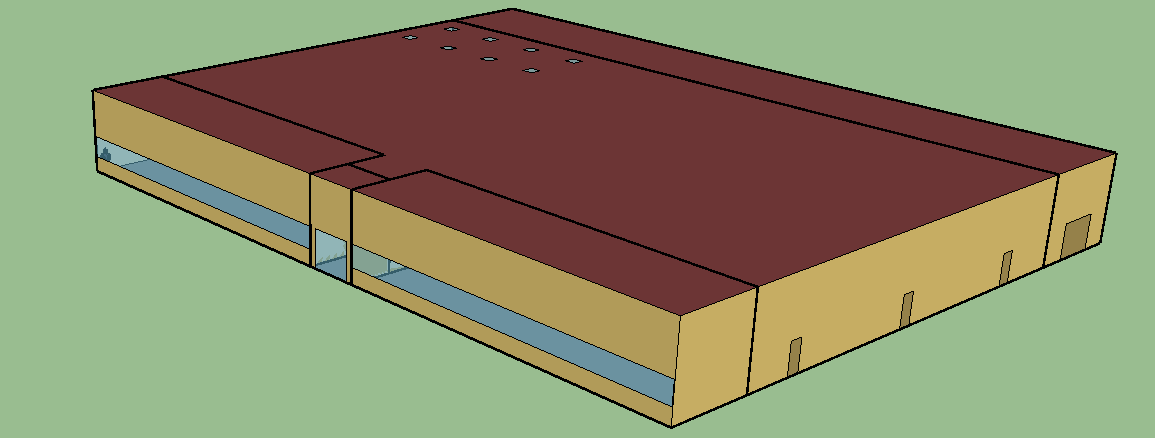
Figure 1. View of the retail model.
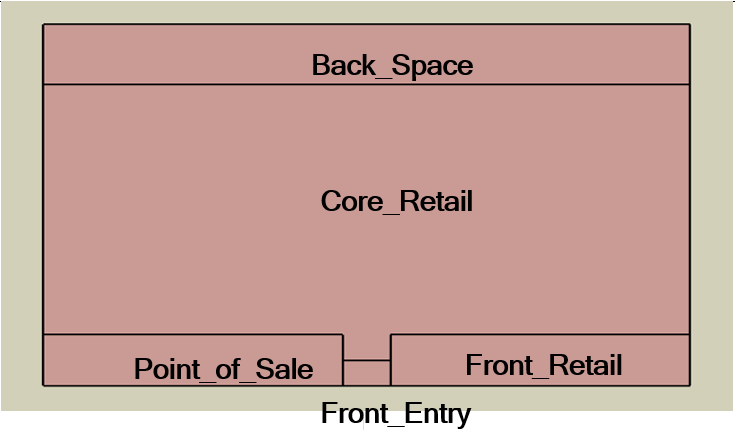
Figure 2. Five different thermal zones.
The infiltration values of the building's air barrier system are divided into peak and off-peak values. The peak value is 0.2016 cfm/sf of above grade exterior wall surface area, adjusted by wind (when fans turn off) [14] and the off-peak value is 25% of peak infiltration rate (when fans turn on) [15]. The internal thermal gains of the five thermal zones vary in aspects of the lighting and plug load settings, while with the same people setting as 6.19 m²/ Person, as shown in Table 1. The heating type of HVAC is set as gas furnace inside the packaged air conditioning unit for backspace, core retail, point of sale, and front detail Standalone gas combustion for front entry. Its cooling type is set as Packaged air conditioning unit for back space, core retail, point of sale, and front detail [16].
Table 1. The internal thermal gains of the five thermal zones.
Zone | Plug load setting (W/m2) | Lighting (W/m2) | People(m2/peroson) |
BACK_SPACE | 7.53 | 9.03 | 6.19 |
CORE_RETAIL | 3.23 | 18.30 | 6.19 |
POINT_OF_SALE | 21.53 | 18.30 | 6.19 |
FRONT_RETAIL | 3.23 | 18.30 | 6.19 |
FRONT_ENTRY | 0.00 | 18.30 | 6.19 |
In addition, the locations of the 16 cities are shown in Figure 3. The locations cover all the climate zones in America. The cities Fairbanks and Honolulu are not marked in Figure 3. Fairbanks is located in Alaska (Zone 7) and Honolulu is located in Hawaii (Zone 8).
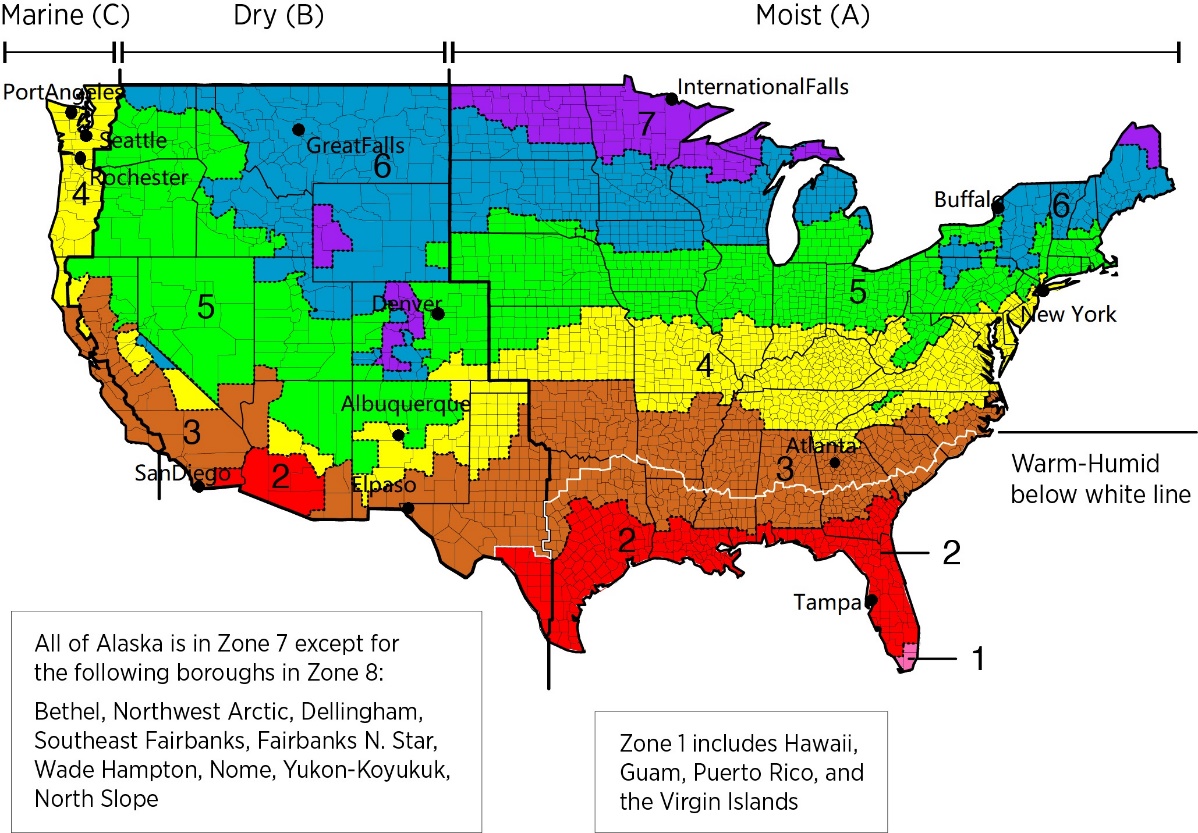
Figure 3. Locations of 16 cities.
2.2. The setting of cool roof and green roof
For the original roof, the data used in this study is the data of 16 American cities in the ASHRAE901 data set in 2004. As mentioned above, the reflectivity of the surface of a cool roof to sunlight(albedo) is usually 60%. Therefore, this study has changed the solar absorption rate of the outermost material of the cool roof to 0.4 in the "Material". For green roofs, we use the green layer (BaseEco) in the EMSPlantLoopOverrideControl file [17] to lay it on the outermost layer of the original roof, thereby forming a green roof.
2.3. Life-cycle cost analysis (LCCA)
The service life of green roofs is usually 40 years, while the service life of cool roofs is 20 years. Therefore, there will be a replacement of cool roofs within a 40-year period, and the cost of replacing a cool roof needs to be considered. LCCA is used to determine the net savings of green and cool roofs over a 40-year life cycle. The LCCA accounts for the following parameters: roof installation, replacement and maintenance, energy related benefits (cooling/heating costs), avoided power plant emissions (CO2, NOx, and SO2), without considering carbon reduction, costs, and water storage related benefits. In addition, reducing heat island effects, biodiversity, air quality, carbon dioxide sequestration, and increasing property value have also not been considered as their benefits are difficult to quantify or negligible.
2.3.1. The calculation of net present value (NPV). For cool roofs and green roofs, we need to consider their initial investment (Ci), discount rate (r), annual maintenance costs, annual air-conditioning power saving costs, etc. There is no need to consider the cost savings of annual carbon reduction and annual water storage. The formula of NPV is shown as Eq. (1)
\( NPV=\sum _{i=1}^{40}\frac{({C_{i}}-{C_{0}})}{{(1+r)^{i}}}\ \ \ \ \ \ (1) \)
In Eq. (1), Ci is the annual profit of the green roofs and the cool roofs compared to the common roofs, including annual energy cost savings, in $/m2. C0 is the annual cost, including installation, replacement costs (cool roofs) and maintenance costs (green roofs), in $/m2. The inflation-adjusted annual rate of return r is set as 3% [18]. The life-cycle years are set as 40 years.
2.3.2. Heating and cooling site energy savings and cost savings. This study will select representative cities from the 16 cities marked in Figure 3 for simulation calculations to obtain site energy savings for cool roofs and green roofs in each city’s retail buildings.
The heating and cooling source energy savings are calculated by multiplying the values for site energy savings of cool roofs or green roofs by the appropriate source to site ratio (f= 3.167 for electricity and 1.084 for natural gas), then summed to the yield source energy savings. But in this study, we just consider about the site energy savings which can directly manifest cool or green roofs' benefits in energy savings.
For cost savings, we checked some websites to calculate the average prices of electricity and natural gas during the period between 2018 and 2020. Then the cost savings of cool and green roofs can be calculated through each site energy saving multiplying its corresponding average price.
2.3.3. Power plant emissions savings. The CO2, NOx, and SO2 emissions reductions from heating or cooling energy savings were calculated by dividing the heating and cooling source energy savings by the appropriate energy transmission efficiency and pollutant emissions factors, and then summed to yield the emissions savings for each pollutant.
3. Results and discussion
3.1. Comparison of energy-saving data between cool roofs and green roofs in different thermal zones
According to the data of Prototype Building Models [19], this study divided the whole US into 8 thermal climate zones which vary from very hot to subarctic climate. In addition, we picked out each thermal climate zone’s representative city to compare their load energy savings.
Table 2. Thermal zones and their representative cities.
Thermal Zone | Thermal Climate Zone Name | Representative City |
1 | Very Hot | Honolulu |
2 | Hot | Tampa |
3 | Warm | Atlanta |
4 | Mixed | New York |
5 | Cool | Seattle |
6 | Cold | Rochester |
7 | Very Cold | International Falls |
8 | Subarctic | Fairbanks |
The load energy savings of site electricity and natural gas of 8 representative cities of each climate zone are shown in Figure 4. The annual site electricity saving of cool roof varies from 3.07 to 8.57 kWh/m2 and its average is 5.56 kWh/m2, of green roof varies from 1.03 to 3.25 kWh/m2 and its average is 2.00 kWh/m2. The site NG saving of cool roof varies from -7.55 to 0 kWh/m2 and its average is -4.06 kWh/m2, of green roof varies from 0 to 12.43 kWh/m2 and its average is 5.29 kWh/m2.
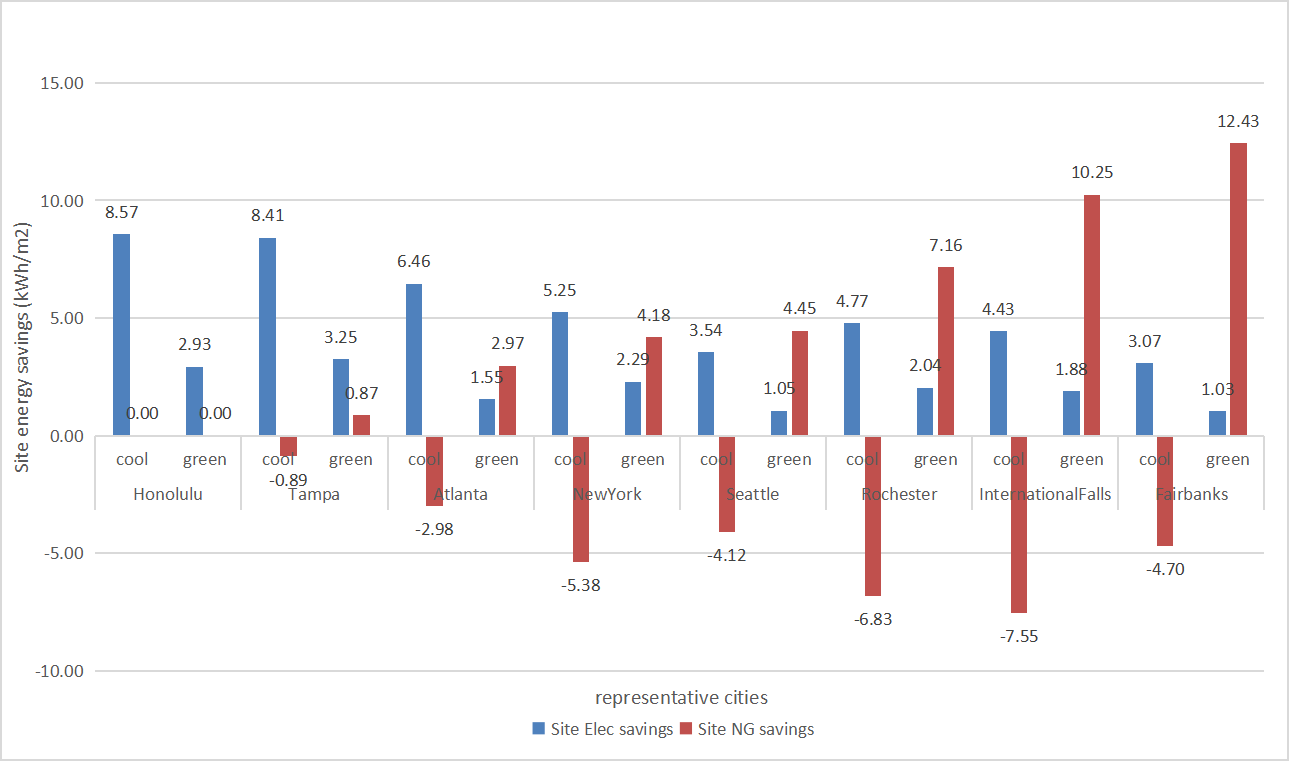
Figure 4. Site Energy savings.
From Figure 4, after adopting cool roofs in retail buildings in some cities, the consumption of natural gas actually increases, like Atlanta and New York. The reason is that after using a cool roof, the reflectivity of the roof to sunlight (albedo) increases, while the heat absorbed decreases, and the indoor temperature decreases. In order to maintain a constant indoor temperature, more natural gas needs to be consumed to provide indoor heating.
In addition, whatever the construction is cool roofs or green roofs, the consumption of electricity is reduced, the reason of which is that the cool roof reduces the indoor temperature by reducing the absorption rate of sunlight and the green roof takes away part of the indoor heat through transpiration. After the indoor temperature decreases, it does not need to consume too much electricity to cool the room.
In terms of total energy consumption, some cities like Seattle and Rochester have increased their total energy consumption after adopting cool roofs. The cool roofs of retail buildings in these cities have not played a role in reducing energy consumption. Based on Table 2, it can be found that most of these cities are located in Thermal Climate Zone 5 or more cold zone, and their buildings receive less sunlight compared to hot or warm zones. The cooling demand in these areas is not high, therefore the total energy consumption of retail buildings in these cities has actually increased after using cool roofs.
Moreover, for cities with green roofs, being located in warm or hot zones tends to save more electricity than natural gas. In cool or cold zones, adopting green roofs can save even more gas.
3.2. Cost savings of cool roofs and green roofs
In this study, we checked the official website of America to calculate the average prices of electricity and natural gas during the period between 2018 and 2020 [20]. We got $13 for natural gas per Btu during that period. After a complicated change of the units from $ per Btu to $ per kWh. The final prices of natural gas and electricity are 0.0428 $/kWh and 0.18 $/kWh respectively. Then the cost savings of cool and green roofs can be calculated through each site energy saving multiplying its corresponding average price.
Based on the data in Figure 4, the cost savings of two kinds of roofs in 8 representative cities can be calculated. The formula of cost savings is shown as Eq. (2).
\( Cost savings=site NG savings×0.0428+site Elec savings×0.18\ \ \ \ \ \ (2) \)
Through Eq. (2), the cost savings of two kinds of roofs in 8 representative cities are shown in Figure 5.
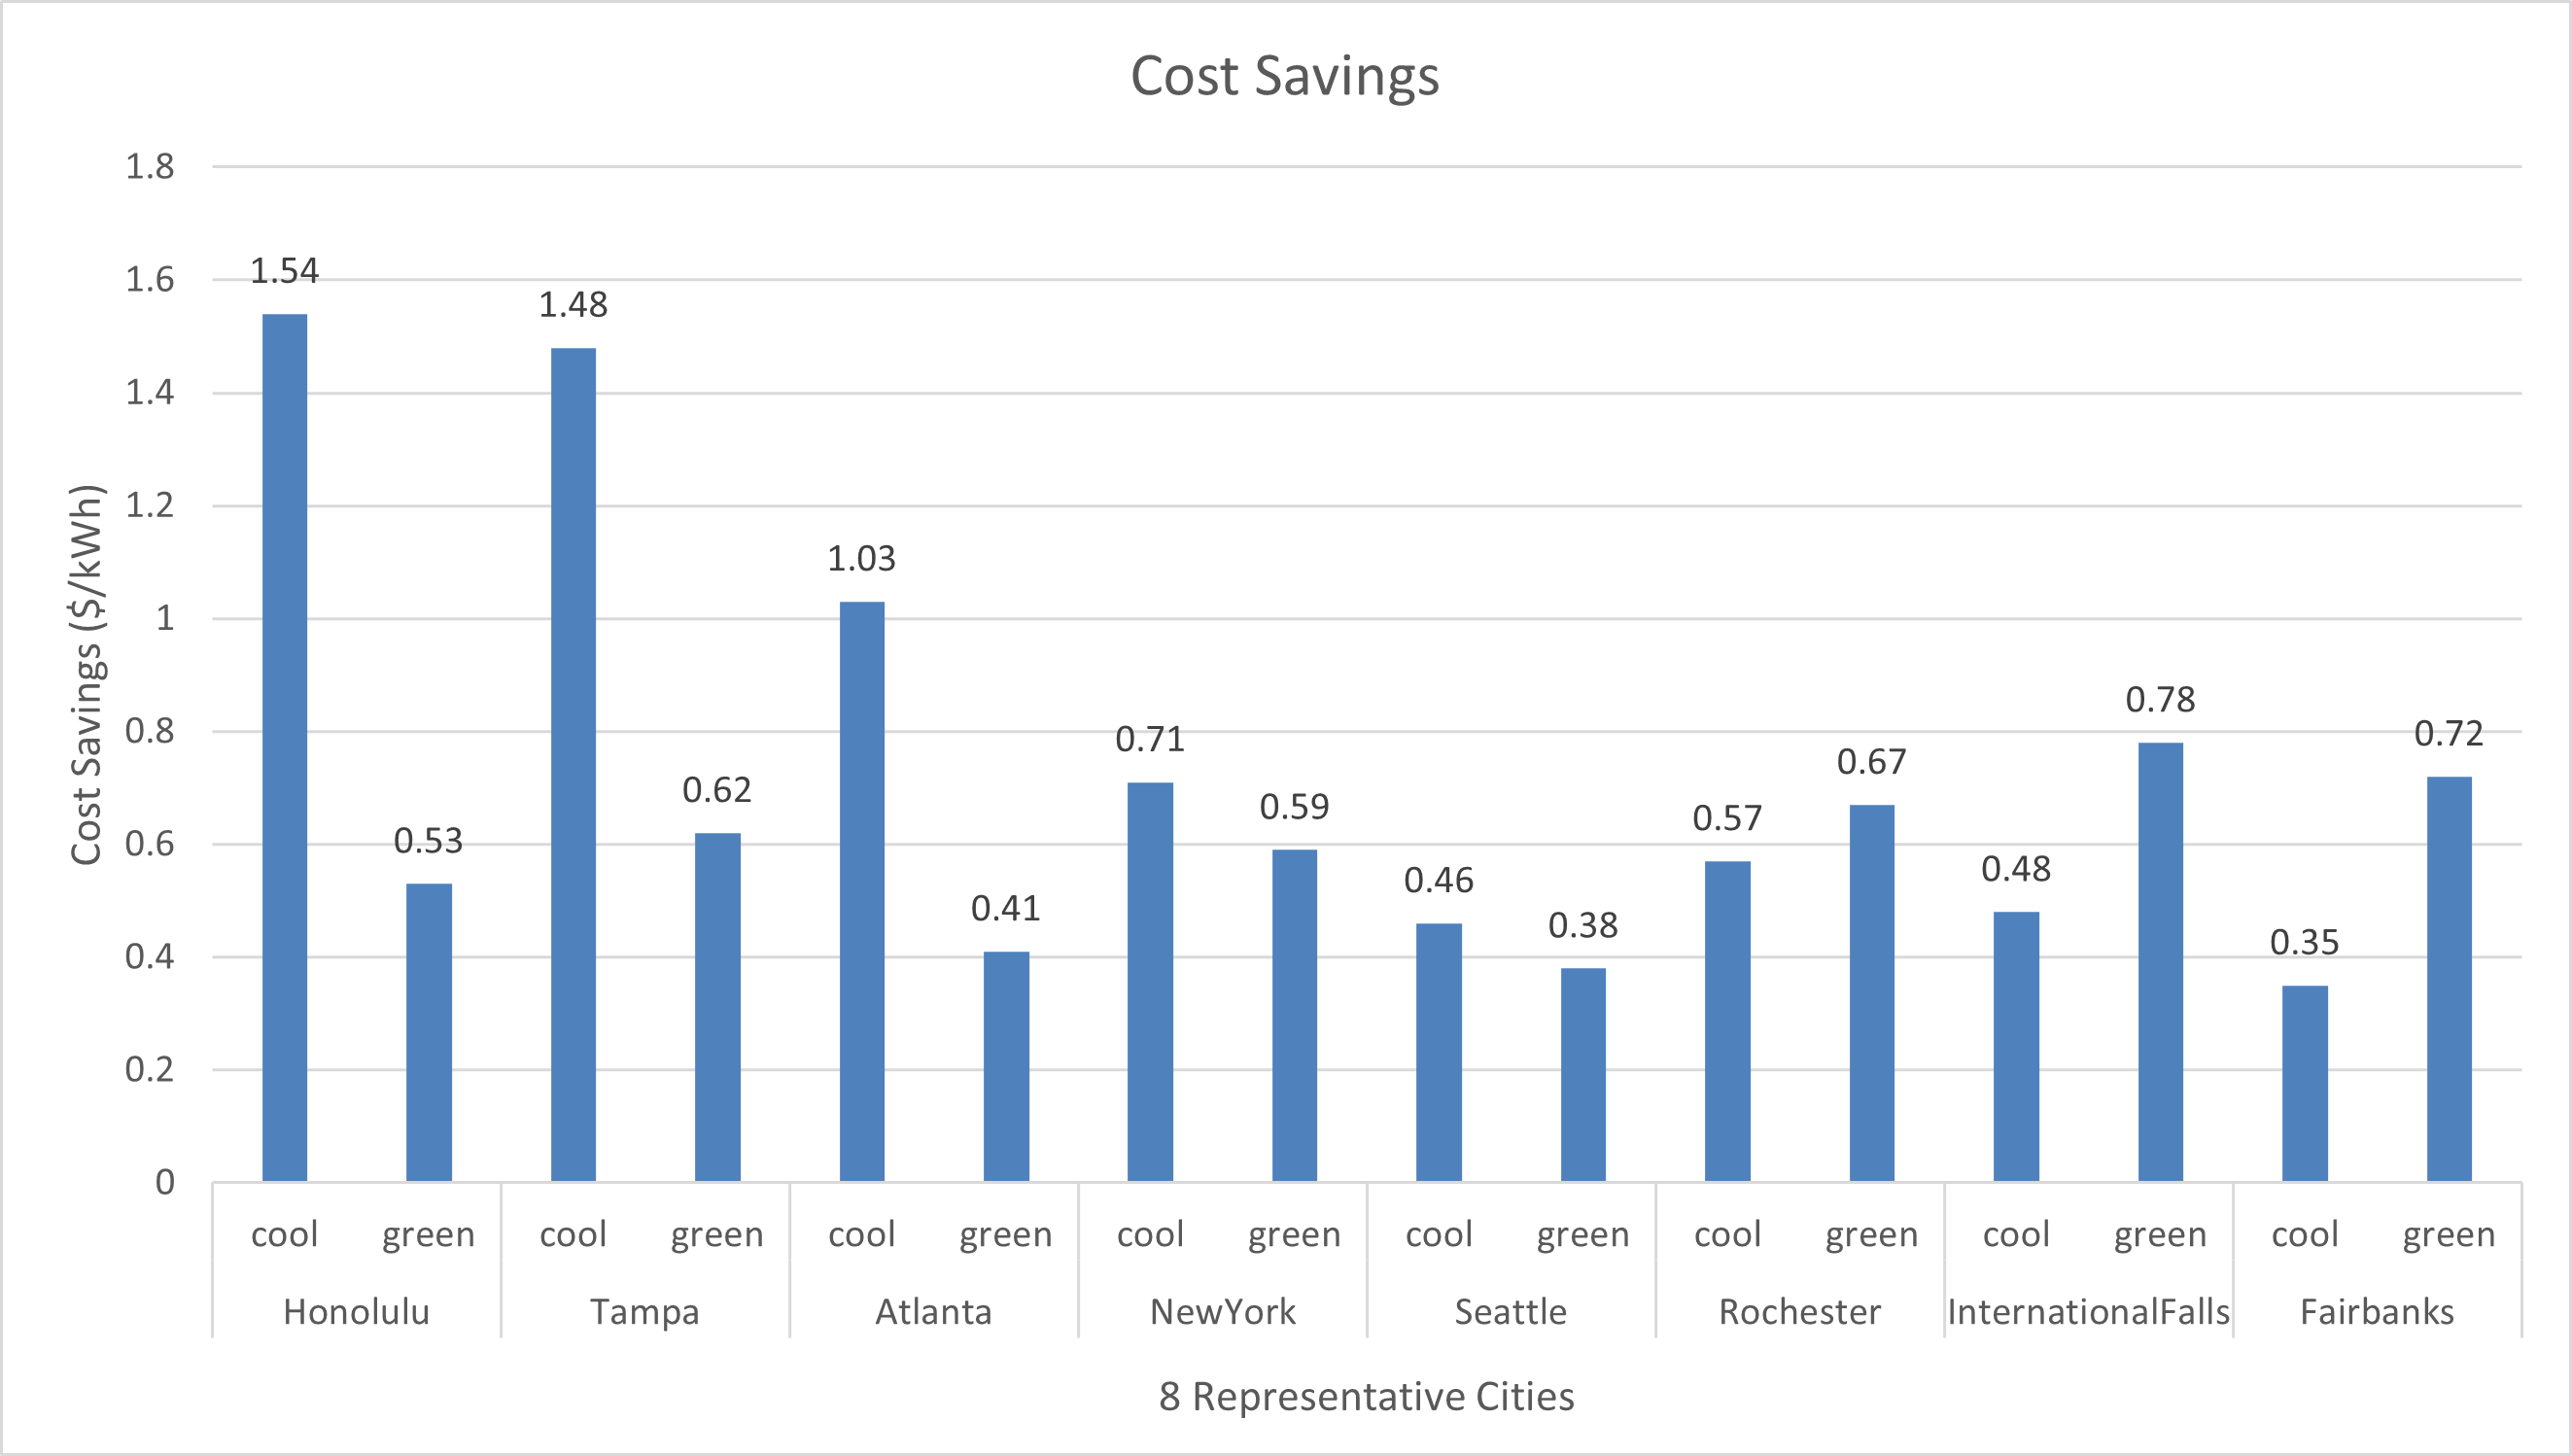
Figure 5. Cost savings.
3.3. Net present value (NPV) of cool roofs and green roofs in 16 cities
J. Sproul et al. investigated data from 22 projects located in different cities and obtained installation, replacement, and maintenance costs for green and cool roofs in different cities. The median of these data was used as the standard value in Table 3 for calculation.
Table 3. The installation, replacement and maintenance costs of green roof and cool roof [9].
Installation, replacement and maintenance costs | Green Roof | Cool Roof |
First installation cost ($/m2) | 172 | 22 |
Replacement cost ($/m2) | 57 | 22 |
Maintenance cost ($/m2·year) | 2.9 | 0.2 |
Peak load shaving benefit ($/m2) | 2.2 | 2.2 |
Roof life (year) | 40 | 20 |
The value in Table 3 is used in calculation of NPV. Among all the 16 cities, the first installation cost, replacement cost and maintenance cost are the same. The only different figure in NPV calculation is each city’s annual energy cost saving, which depends on local conditions. While considering about cost saving of each city, peak load shaving benefit should be taken consideration in. Green roofs and cool roofs can reduce peak electricity demand and energy consumption. For example, an air conditioner (AC) with a capacity of 50 kW is more expensive than another AC with a capacity of 10 kW. Cool and green roofs can reduce investment in air conditioning and peak load charging costs and provide good economic benefits. This benefit is called "peak load shaving benefit". When calculating the annual air conditioning electricity saving cost, we need to add peak load shaving benefit to the cost saving. For example, the cost saving for Albuquerque's cool roof case is 1 $/m2. When calculating the annual air conditioning power savings for Albuquerque's cool roof, we need to add 2.2 $/m2. The annual air conditioning energy-saving cost for the cool roof of Albuquerque is 3.2 $/m2. Through calculation, the NPV of cool roofs and green roofs are listed in Table 4.
Table 4. NPV of cool roofs and green roofs.
City | Green Roof NPV ($/m2) | Cool Roof NPV ($/m2) | Payback Period of Cool Roofs (years) |
Albuquerque | -169 | 35.27 | 8.41 |
Atlanta | -178.7 | 35.97 | 8.31 |
Buffalo | -175.01 | 26.49 | 9.82 |
Denver | -168.07 | 35.27 | 8.41 |
ElPaso | -169.23 | 37.82 | 8.07 |
Fairbanks | -171.54 | 20.25 | 11.16 |
GreatFalls | -169 | 28.57 | 9.45 |
Honolulu | -175.93 | 47.76 | 6.98 |
InternationalFalls | -170.15 | 23.02 | 10.52 |
NewYork | -174.54 | 28.57 | 9.45 |
PortAngeles | -179.4 | 20.25 | 11.16 |
Rochester | -172.69 | 25.33 | 10.04 |
Rochester | -178.24 | 36.66 | 8.22 |
Seattle | -179.4 | 22.79 | 10.57 |
Tampa | -173.85 | 36.37 | 7.12 |
Tucson | -162.29 | 48.45 | 6.92 |
In Table 4, all green roofs have negative NPVs and all cool roofs have positive NPVs, indicating that the project of adopting green roofs are impractical in terms of economic benefits, while adopting cool roofs can bring economic benefits. A negative NPV indicates that using green roofs instead of regular roofs in retail buildings does not bring economic benefits, and may even result in losses. In Table 3, even in the worst-cases, the NPV of cool roofs is still positive, indicating that cool roofs have good economic benefits in the application of retail buildings in the United States. In tropical cities like Honolulu and Tucson, cool roofs can reflect more solar energy and bring more cost savings, resulting in a higher NPV for cool roofs in tropical cities. Although the NPV of all green roofs is negative, it can only indicate that their economic benefits are not good. The energy-saving and environmental benefits of green roofs also need to be considered.
In addition, the payback period of green and cool roofs is also been taken consideration in. Payback period is calculated after the net cash flow of each year of the project being converted into the present value at the beginning of the project at the discount rate (r), which can be calculated according to Eq. (3). In Eq. (3), A, B, C, D represents “payback period”, “the number of years since the present value of cumulative net cash flow began to show a positive value”, “absolute value of the present value of cumulative net cash flow from the previous year”, “present value of net cash flow from the year when the positive value occurred” respectively.
\( A=(B-1)+\frac{C}{D}\ \ \ \ \ \ (3) \)
As shown in Table 3, all NPVs of green roofs are negative, therefore, the payback periods of green roofs in all cities are N/A. We use Eq. (3) to calculate the payback period of cool roofs. Those payback periods range from 6.92 to 11.16 years. Tropical cities like Honolulu and Tucson have the highest NPVs and the shortest payback periods.
3.4. Emission savings of CO2, NOx, and SO2
Power plants generally generate energy through combustion, which in turn drives steam turbines to generate electricity. Most power plants currently use coal as fuel and the combustion of coals can have adverse consequences, producing gas pollutants such as SO2 and NOx and causing pollution of sulfur dioxide and nitrogen oxides. If these two substances are not dealt with, pollutants will have serious impacts on the atmosphere. For instance, acid rain. After adopting green roofs and cool roofs, the retail building can save energy such as electricity and natural gas, thus reducing power plant emissions.
After checking the emission factors from U.S. Energy Information Administration, the emission factors of electricity and natural gas are set in Table 5.
Table 5. Emission factors of electricity and natural gas [21].
Energy | CO2 Emission Factors (kg/kWh) | NOx Emission Factors (g/kWh) | SO2 Emission Factors (g/kWh) |
Electricity | 0.429 | 0.65 | 2.7 |
Natural Gas | 0.1805 | 0 | 0 |
After checking the emission factors of electricity and natural gas, the CO2, NOx, and SO2 emissions reductions of each city can be calculated by calculating the reductions of electricity and natural gas respectively and summing up to yield the total emission savings. The emission savings of each city are shown in Table 6.
Table 6. Emission savings of 16 cities.
City | CO2 reductions(kg/m2) | NOx reductions(g/m2) | SO2 reductions(g/m2) | |||
Green roof | Cool roof | Green roof | Cool roof | Green roof | Cool roof | |
Albuquerque | 2.51 | 2.34 | 2.50 | 4.83 | 10.40 | 20.08 |
Atlanta | 1.28 | 2.54 | 1.12 | 4.66 | 4.66 | 19.37 |
Buffalo | 1.81 | 1.21 | 1.50 | 3.56 | 6.23 | 14.80 |
Denver | 2.75 | 2.22 | 2.38 | 5.09 | 9.90 | 21.15 |
ElPaso | 2.32 | 2.82 | 2.93 | 4.76 | 12.19 | 19.76 |
Fairbanks | 2.74 | 0.61 | 0.75 | 2.22 | 3.10 | 9.20 |
GreatFalls | 2.71 | 1.41 | 1.99 | 4.03 | 8.27 | 16.74 |
Honolulu | 1.39 | 4.09 | 2.11 | 6.19 | 8.78 | 25.72 |
InternationalFalls | 2.74 | 0.75 | 1.35 | 3.20 | 5.63 | 13.30 |
NewYork | 1.85 | 1.53 | 1.65 | 3.79 | 6.87 | 15.75 |
PortAngeles | 1.37 | 0.57 | 0.57 | 2.31 | 2.36 | 9.58 |
Rochester | 2.27 | 1.04 | 1.47 | 3.44 | 6.12 | 14.30 |
Rochester | 1.15 | 2.78 | 1.69 | 4.28 | 7.01 | 17.79 |
Seattle | 1.30 | 0.94 | 0.76 | 2.56 | 3.16 | 10.63 |
Tampa | 1.71 | 3.85 | 2.35 | 6.08 | 9.76 | 25.24 |
Tucson | 3.04 | 4.11 | 4.34 | 6.42 | 18.05 | 25.66 |
In Table 6, retail buildings in any city can reduce the emissions of CO2, NOx and SO2 of the power plants after adopting green roofs or cool roofs. For CO2 reduction, the effects of retail buildings in different cities after adopting green roofs or cool roofs are different. The retail buildings in some cities such as Atlanta, have higher CO2 reduction after using cool roofs than green roofs, while some retail buildings in other cities have the opposite effect. For NOx and SO2 reduction, the emission reductions of retail buildings in any city with cool roofs are always higher than those of retail buildings with green roofs. In addition, the emission reductions of retail buildings are related to the energy savings mentioned in section 3.1, and cities with high energy savings also have higher emission reductions.
4. Conclusion
This paper analysed the life-cycle cost analysis of retail buildings in 16 cities in the United States. By simulating the transformation of the ordinary roof of retail buildings into green roofs or cool roofs, it is concluded that the choice between the transformation of green roofs and cool roofs depends on the climate zone, the first installation cost, replacement and maintenance costs of the roofs, and various environmental benefits. This analysis compares the performance of green roofs and cool roofs in eight different thermal zones of the United States, providing valuable reference for decision-makers in these regions. The economic analysis and comparison of the 40-year life cycle show that the retail buildings in any city can obtain positive economic benefits after using cool roofs, and the payback period is between 6.92 and 11.16 years, while negative economic benefits will be obtained after using green roofs. Site energy savings in eight representative cities show that retail buildings can save electricity after adopting cool roofs or green roofs, while retail buildings in some thermal zones will increase the consumption of natural gas after adopting cool roofs. Emission savings from 16 cities show that retail buildings can reduce greenhouse gases and pollution gases after adopting green roofs or cool roofs and adopting a cool roof can reduce more NOx and SO2.
The results suggest that decision-makers can change the roofs of retail buildings in different thermal zones based on factors such as economic benefits, environmental benefits, and energy-saving benefits, in order to meet energy efficiency standards and local standards in the United States.
References
[1]. China Association of Building Energy Efficiency, “China Building Energy Research Report,” p. 73, 2016, [Online]. Available: http://www.efchina.org/Attachments/Report/report-20170710-1/report-20170710-1
[2]. S. Nadel et al., “An Introduction to U.S. Policies to Improve Building Efficiency,” Am. Counc. an Energy- Effic. Econ., no. 202, 2013.
[3]. B. Ashtari, M. Yeganeh, M. Bemanian, and B. Vojdani Fakhr, “A Conceptual Review of the Potential of Cool Roofs as an Effective Passive Solar Technique: Elaboration of Benefits and Drawbacks,” Front. Energy Res., vol. 9, no. October, pp. 1–18, 2021, doi: 10.3389/fenrg.2021.738182.
[4]. D. Z. Chen Hui, Ren Jun, “The function and development status of roof greening at home and abroad,” 2007.
[5]. S. Chowdhury, Y. Hamada, and K. Shabbir Ahmed, “Indoor heat stress and cooling energy comparison between green roof (GR) and non-green roof (n-GR) by simulations for labor intensive factories in the tropics,” Int. J. Sustain. Built Environ., vol. 6, no. 2, pp. 449–462, Dec. 2017, doi: 10.1016/J.IJSBE.2017.09.001.
[6]. D. Shi, Y. Gao, R. Guo, R. Levinson, Z. Sun, and B. Li, “Life cycle assessment of white roof and sedum-tray garden roof for office buildings in China,” Sustain. Cities Soc., vol. 46, no. December 2018, p. 101390, 2019, doi: 10.1016/j.scs.2018.12.018.
[7]. Y. He, H. Yu, A. Ozaki, and N. Dong, “Thermal and energy performance of green roof and cool roof: A comparison study in Shanghai area,” J. Clean. Prod., vol. 267, p. 122205, Sep. 2020, doi: 10.1016/J.JCLEPRO.2020.122205.
[8]. G. B. Cavadini and L. M. Cook, “Green and cool roof choices integrated into rooftop solar energy modelling,” Appl. Energy, vol. 296, p. 117082, Aug. 2021, doi: 10.1016/J.APENERGY.2021.117082.
[9]. J. Sproul, M. P. Wan, B. H. Mandel, and A. H. Rosenfeld, “Economic comparison of white, green, and black flat roofs in the United States,” Energy Build., vol. 71, pp. 20–27, 2014, doi: 10.1016/j.enbuild.2013.11.058.
[10]. J. Yang et al., “Green and cool roofs’ urban heat island mitigation potential in tropical climate,” Sol. Energy, vol. 173, pp. 597–609, Oct. 2018, doi: 10.1016/J.SOLENER.2018.08.006.
[11]. M. Zinzi and S. Agnoli, “Cool and green roofs. An energy and comfort comparison between passive cooling and mitigation urban heat island techniques for residential buildings in the Mediterranean region,” Energy Build., vol. 55, pp. 66–76, Dec. 2012, doi: 10.1016/J.ENBUILD.2011.09.024.
[12]. O. Prakash, A. Ahmad, A. Kumar, S. M. Mozammil Hasnain, A. Zare, and P. Verma, “Thermal performance and energy consumption analysis of retail buildings through daylighting: A numerical model with experimental validation,” Mater. Sci. Energy Technol., vol. 4, pp. 367–382, Jan. 2021, doi: 10.1016/J.MSET.2021.08.008.
[13]. “Analysis of Building Envelope Construction in 2003 CBECS,” no. June, 2007.
[14]. K. Gowri, D. Winiarski, and R. Jarnagin, “Infiltration Modeling Guidelines for Commercial Building Energy Analysis,” 2009.
[15]. H. Cho, K. Gowri, and B. Liu, “Energy Saving Impact of ASHRAE 90.1 Vestibule Requirements: Modeling of Air Infiltration through Door Openings,” 2010.
[16]. S. Goel et al., “Enhancements to ASHRAE Standard 90.1 Prototype Building Models,” 2014
[17]. “EMS Plant Loop Override Control.” https://cn.gii.tw/report/act1128090-green-roof-market-growth-future-prospects.html (accessed May 22, 2023).
[18]. “Prototype Building Models | Building Energy Codes Program.” https://www.energycodes. gov/prototype-building-models (accessed Jun. 10, 2023).
[19]. “Energy prices in the U.S. - statistics & facts | Statista.” https://www.statista.com/ topics/6337/energy-prices-in-the-us/?kw=&crmtag=adwords&gclid=EAIaIQobChMInIqnp5rN_wIVwcOWCh3D0wZnEAAYASAAEgIHcPD_BwE#topicOverview (accessed Jun. 19, 2023).
[20]. “Frequently Asked Questions (FAQs) - U.S. Energy Information Administration (EIA).” https://www.eia.gov/tools/faqs/index.php#electricity (accessed Jun. 25, 2023).
Cite this article
He,P. (2023). Energy-saving, economic and environmental benefits analysis of cool roofs and green roofs for retail buildings in America. Applied and Computational Engineering,25,242-253.
Data availability
The datasets used and/or analyzed during the current study will be available from the authors upon reasonable request.
Disclaimer/Publisher's Note
The statements, opinions and data contained in all publications are solely those of the individual author(s) and contributor(s) and not of EWA Publishing and/or the editor(s). EWA Publishing and/or the editor(s) disclaim responsibility for any injury to people or property resulting from any ideas, methods, instructions or products referred to in the content.
About volume
Volume title: Proceedings of the 2023 International Conference on Functional Materials and Civil Engineering
© 2024 by the author(s). Licensee EWA Publishing, Oxford, UK. This article is an open access article distributed under the terms and
conditions of the Creative Commons Attribution (CC BY) license. Authors who
publish this series agree to the following terms:
1. Authors retain copyright and grant the series right of first publication with the work simultaneously licensed under a Creative Commons
Attribution License that allows others to share the work with an acknowledgment of the work's authorship and initial publication in this
series.
2. Authors are able to enter into separate, additional contractual arrangements for the non-exclusive distribution of the series's published
version of the work (e.g., post it to an institutional repository or publish it in a book), with an acknowledgment of its initial
publication in this series.
3. Authors are permitted and encouraged to post their work online (e.g., in institutional repositories or on their website) prior to and
during the submission process, as it can lead to productive exchanges, as well as earlier and greater citation of published work (See
Open access policy for details).
References
[1]. China Association of Building Energy Efficiency, “China Building Energy Research Report,” p. 73, 2016, [Online]. Available: http://www.efchina.org/Attachments/Report/report-20170710-1/report-20170710-1
[2]. S. Nadel et al., “An Introduction to U.S. Policies to Improve Building Efficiency,” Am. Counc. an Energy- Effic. Econ., no. 202, 2013.
[3]. B. Ashtari, M. Yeganeh, M. Bemanian, and B. Vojdani Fakhr, “A Conceptual Review of the Potential of Cool Roofs as an Effective Passive Solar Technique: Elaboration of Benefits and Drawbacks,” Front. Energy Res., vol. 9, no. October, pp. 1–18, 2021, doi: 10.3389/fenrg.2021.738182.
[4]. D. Z. Chen Hui, Ren Jun, “The function and development status of roof greening at home and abroad,” 2007.
[5]. S. Chowdhury, Y. Hamada, and K. Shabbir Ahmed, “Indoor heat stress and cooling energy comparison between green roof (GR) and non-green roof (n-GR) by simulations for labor intensive factories in the tropics,” Int. J. Sustain. Built Environ., vol. 6, no. 2, pp. 449–462, Dec. 2017, doi: 10.1016/J.IJSBE.2017.09.001.
[6]. D. Shi, Y. Gao, R. Guo, R. Levinson, Z. Sun, and B. Li, “Life cycle assessment of white roof and sedum-tray garden roof for office buildings in China,” Sustain. Cities Soc., vol. 46, no. December 2018, p. 101390, 2019, doi: 10.1016/j.scs.2018.12.018.
[7]. Y. He, H. Yu, A. Ozaki, and N. Dong, “Thermal and energy performance of green roof and cool roof: A comparison study in Shanghai area,” J. Clean. Prod., vol. 267, p. 122205, Sep. 2020, doi: 10.1016/J.JCLEPRO.2020.122205.
[8]. G. B. Cavadini and L. M. Cook, “Green and cool roof choices integrated into rooftop solar energy modelling,” Appl. Energy, vol. 296, p. 117082, Aug. 2021, doi: 10.1016/J.APENERGY.2021.117082.
[9]. J. Sproul, M. P. Wan, B. H. Mandel, and A. H. Rosenfeld, “Economic comparison of white, green, and black flat roofs in the United States,” Energy Build., vol. 71, pp. 20–27, 2014, doi: 10.1016/j.enbuild.2013.11.058.
[10]. J. Yang et al., “Green and cool roofs’ urban heat island mitigation potential in tropical climate,” Sol. Energy, vol. 173, pp. 597–609, Oct. 2018, doi: 10.1016/J.SOLENER.2018.08.006.
[11]. M. Zinzi and S. Agnoli, “Cool and green roofs. An energy and comfort comparison between passive cooling and mitigation urban heat island techniques for residential buildings in the Mediterranean region,” Energy Build., vol. 55, pp. 66–76, Dec. 2012, doi: 10.1016/J.ENBUILD.2011.09.024.
[12]. O. Prakash, A. Ahmad, A. Kumar, S. M. Mozammil Hasnain, A. Zare, and P. Verma, “Thermal performance and energy consumption analysis of retail buildings through daylighting: A numerical model with experimental validation,” Mater. Sci. Energy Technol., vol. 4, pp. 367–382, Jan. 2021, doi: 10.1016/J.MSET.2021.08.008.
[13]. “Analysis of Building Envelope Construction in 2003 CBECS,” no. June, 2007.
[14]. K. Gowri, D. Winiarski, and R. Jarnagin, “Infiltration Modeling Guidelines for Commercial Building Energy Analysis,” 2009.
[15]. H. Cho, K. Gowri, and B. Liu, “Energy Saving Impact of ASHRAE 90.1 Vestibule Requirements: Modeling of Air Infiltration through Door Openings,” 2010.
[16]. S. Goel et al., “Enhancements to ASHRAE Standard 90.1 Prototype Building Models,” 2014
[17]. “EMS Plant Loop Override Control.” https://cn.gii.tw/report/act1128090-green-roof-market-growth-future-prospects.html (accessed May 22, 2023).
[18]. “Prototype Building Models | Building Energy Codes Program.” https://www.energycodes. gov/prototype-building-models (accessed Jun. 10, 2023).
[19]. “Energy prices in the U.S. - statistics & facts | Statista.” https://www.statista.com/ topics/6337/energy-prices-in-the-us/?kw=&crmtag=adwords&gclid=EAIaIQobChMInIqnp5rN_wIVwcOWCh3D0wZnEAAYASAAEgIHcPD_BwE#topicOverview (accessed Jun. 19, 2023).
[20]. “Frequently Asked Questions (FAQs) - U.S. Energy Information Administration (EIA).” https://www.eia.gov/tools/faqs/index.php#electricity (accessed Jun. 25, 2023).