


1. Introduction
As OpenAI paves the way for humanity to embrace the era of artificial intelligence, it has inadvertently sparked the emergence of numerous concept stocks directly linked to this transformative technology. In recent times, the stock prices of Chinese enterprises engaged in independent research and development of artificial intelligence technologies have experienced a remarkable surge. When assessing the future prospects of AI stocks in China, two popular yet contrasting forecasting techniques come into play: momentum strategies and contrarian strategies. The momentum effect was first hypothesised by Jegadeesh and Titman, suggesting stocks that did well in the early stages will continue to expand [1]. This effect results from investors' underreaction to new market information, which is when investors delay changing their investment strategy in response to the appearance of further details, causing the stock price to follow the prior trend. In contrast, the reversal effect, first proposed by De Bondt and Thaler, suggests that stocks that have experienced a significant increase in price in the past are more likely to decline in the future. This effect is attributed to investors' tendency to overreact to information, leading to an excessive response and subsequent correction in stock prices [2]. For instance, in a bull market, the greater the deviation between the stock price and the actual value of the company, the greater the likelihood that investors will overreact to unfavourable news and cause a dramatic decline in the stock price, creating a reversal effect. Fama and French attempted to reconcile the two hypotheses by raising the risk variables, but they could not form a universal conclusion [3].
This research will examine the performance of these two forecasting methodologies in China's AI concept stocks. This study utilizes data on AI concept stocks from the Wind financial database. After careful screening, we employs Python's fitting method to predict the performance of both momentum and contrarian strategies. By analyzing historical data and examining the fitting results, this article aims to provide supporting evidence for evaluating the potential future trends of artificial intelligence concept stocks.
The fitting method employed in Python allows the researcher to analyze and model the historical price data of AI concept stocks. By applying this method to the dataset, the study seeks to uncover patterns and trends that may inform the future performance of these stocks. The fitting results serve as a basis for making predictions and drawing conclusions regarding the potential rise or fall of AI concept stocks in the future.
2. Methodology
2.1. Data selection
In this paper, the data are cross-referenced in China financial database iFinD and Wind Economic Database in Chatgpt plate. The gather gathered data on 19 concept stocks, including their daily opening and closing prices, from December 8, 2022, to May 8, 2023. This date is one week following the public release of Chatgpt on November 30th, and the concept has sparked widespread interest. With the global release of the epochal AI tool Chatgpt on November 30th, 2022, and a week's dissemination, investor enthusiasm for the AI plate has progressively increased, and Chinese technology businesses have also actively engaged in developing AI technology. This study was motivated by the need to forecast stock performance during the popular Chatgpt half-year.
2.2. Momentum strategies
The momentum strategy model predicts upcoming ups and downs based on the positive and negative returns during the previous N days. The momentum strategy's expected cumulative returns are obtained by the model, which adjusts positions in response to ups and downs forecasts. In order to determine the goodness of fit, the cumulative revenue is then contrasted with the stock's actual revenue.
To begin, the arithmetic return formula (1) is used in this research to calculate the actual stock yield, in which Pt represents the price of a particular day, and the corresponding Pt-1 represents the price of the previous day. Then, this study cycles for 0 to 60 days to determine the model with the maximum goodness of fit in order to produce the best N-day prediction. The cycle range is chosen at 0 to 60 days to ensure that at least 2/3 of the forecast data are valid, given that only 180 days of data have been collected during the time. When the return is positive, the daily position is set to 1. Conversely, when the return is negative, indicating a drop, the daily position is set to -1.
Formula (1): Arithmetic Return= 
Finally, modify positions if the return from the previous day was positive and the stock price increased, then buy long and if the yield was negative with the stock price decreased, sell short. The goodness-of-fit R square is calculated by comparing the cumulative gain, which results from multiplying the profits following the position modification, with the actual value.
2.3. Contrarian strategies
Contrary to the momentum strategy, the contrarian strategy implies that a stock continues to climb for a period of time, followed by a callback, and continues to fall for a a while, followed by a rebound, therefore the threshold for defining a callback or rebound becomes highly essential. This study uses formula (2) and (3) to determine distances, where SMA is calculated by n days price (P1, P2 ... Pn) over n days and distance equals a certain day’s close price minus n days SMA. Next, using the mean of that distance as the median and the standard deviation as the threshold. If the current day's distance exceeds the threshold, shorten the next step; If the distance is smaller than the threshold, purchase over time; When distance values alternate between positive and negative values for two days in a row, it means that the distance has returned to its mean value, and positions are closed until the following time distance becomes excessive. Similarly, Python is applied to locate the maximum goodness of fit to get the ideal value of N.
Formula (2): Distance = Close Price- SMA(n)
Formula (3): SMA(n) = \( \frac{{P_{1}}+{P_{2}}+⋯+{P_{n}}}{n} \)
Take the company Kedaxunfei(002230.SZ)as an example, the distance chart using 2-days-SMA is shown in figure 1. In this figure, the middle red line represents distance mean (0.15536082474227042) and the other two red lines show the thresholds
(mean±standard deviation= [-0.9345680595883954,1.2452897090729362]). The position adjustment rule under the aforementioned reversal technique is then applied to 002230.SZ, and the resulting figure 2 is rendered in Python.
|
Figure 1. Kedaxunfei (002230.SZ) distance chart. |
|
Figure 2. Kedaxunfei(002230.SZ) adjustment chart. |
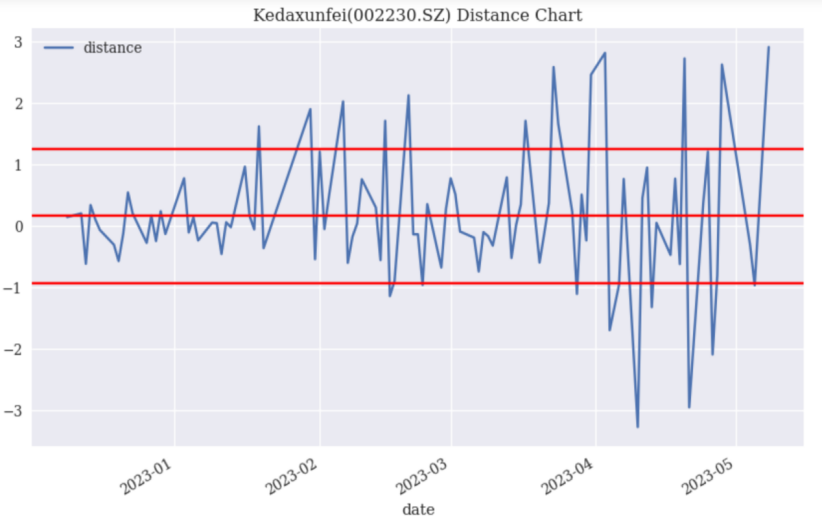
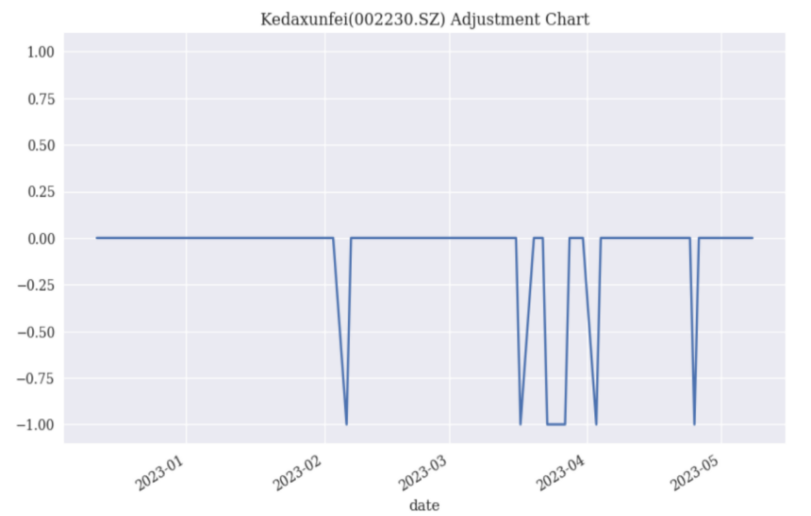
Figure 1 and Figure 2 shows that despite the stock's significant price fluctuations, the majority of the positions are closed. If adjustments are necessary, it is anticipated that the stock market may overreact, leading to the creation of short positions.
2.4. Result and analysis
In general, the momentum method outperforms the reversal strategy in predicting the price movement of AI stock (Table1). The approach with a goodness of fit R square greater than 50% demonstrates that it has greater explanatory power than the natural chance of 50% of stock rising and falling. As a result, in this paper, the model goodness of fit strategy is considered effective when it exceeds 50%. The results show that among the 19 AI concept stocks, three of them cannot be explained by both strategies, and the momentum strategy of the remaining 16 stocks is far more effective than the reversal strategy. Compared to the reversal strategy, which has no predictive power for 94.74% of AI concept stocks (negative R square), the momentum strategy can predict 57.89% of AI concept stocks with more than 80% explanatory power. Additionally, the optimal n value for momentum strategies is typically in the intermediate range (between 10 and 30). In contrast, the best n value for reversal strategies is typically relatively short-term (less than 5 days) or relatively long-term (around 55 days). The extreme value of n in the reversal strategy leads to either an exceptionally high or low tolerance for deviation. However, interestingly, the best goodness of fit is found within this range, which highlights that the reversal strategy fails to accurately reflect the stock's trend. This outcome further demonstrates that the explanatory power of the reversal strategy is negative.
Table 1. Comparison table of strategies fitting goodness.
Stock Name | Optimal N | R square-Momentum strategies | Optimal N | R sqaure-Contrarian strategies | Valid Strategy |
002230.SZ | 15 | 88.18% | 2 | -28.01% | Momentum strategies |
003032.SZ | 18 | -57.22% | 45 | 25.64% | None |
300071.SZ | 30 | -36.95% | 40 | -23.39% | None |
300465.SZ | 26 | 42.97% | 2 | -28.61% | None |
688787.SH | 10 | 89.45% | 58 | -112.55% | Momentum strategies |
002362.SZ | 15 | 82.52% | 57 | -39.98% | Momentum strategies |
002229.SZ | 29 | 94.31% | 2 | -129.01% | Momentum strategies |
300520.SZ | 22 | 86.87% | 6 | -72.81% | Momentum strategies |
300418.SZ | 24 | 94.11% | 4 | -60.33% | Momentum strategies |
601360.SH | 20 | 97.28% | 5 | -103.32% | Momentum strategies |
300229.SZ | 27 | 81.77% | 2 | -32.96% | Momentum strategies |
300245.SZ | 30 | 73.28% | 2 | -63.88% | Momentum strategies |
002354.SZ | 17 | 52.82% | 42 | -37.66% | Momentum strategies |
300047.SZ | 25 | 69.81% | 2 | -53.49% | Momentum strategies |
300033.SZ | 6 | 80.06% | 4 | -78.13% | Momentum strategies |
300624.SZ | 24 | 93.46% | 2 | -37.00% | Momentum strategies |
002878.SZ | 29 | 72.13% | 2 | -8.37% | Momentum strategies |
688327.SH | 15 | 87.36% | 2 | -117.21% | Momentum strategies |
300364.SZ | 27 | 74.54% | 2 | -48.05% | Momentum strategies |
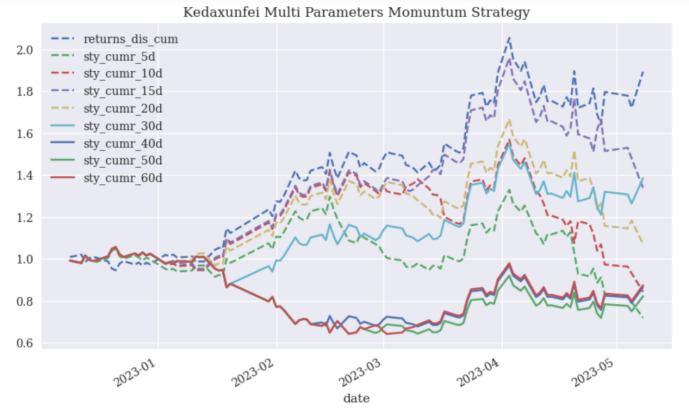
Similarly, take the company Kedaxunfei(002230.SZ)as an example. Figure 3 compares the forecasted outcomes of typical representative days with the actual price trend. The exact rate of return for stocks is represented by returns_dis_cum, and the forecast for various days is shown by sty_cumr_nd. Despite the fact that different N values have plainly varied fitting degrees, the overall projection adheres to the actual increasing trend regardless of N number.
|
Figure 3. Kedaxunfei muti parameters momuntum strategy. |
|
Figure 4. Kedaxunfei Reverse Strategy (SMA=2). |
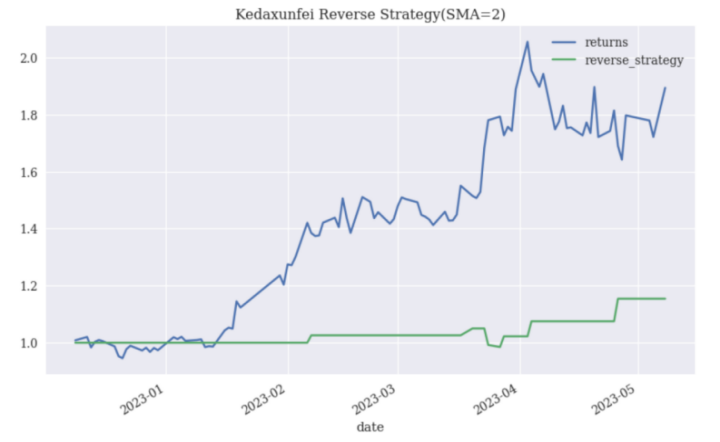
However, in Figure 4, which is the best reversal approach, it can only just anticipate the overall modest rising trend, but not the entire stage, and there is a prediction that contradicts the actual rise and collapse.
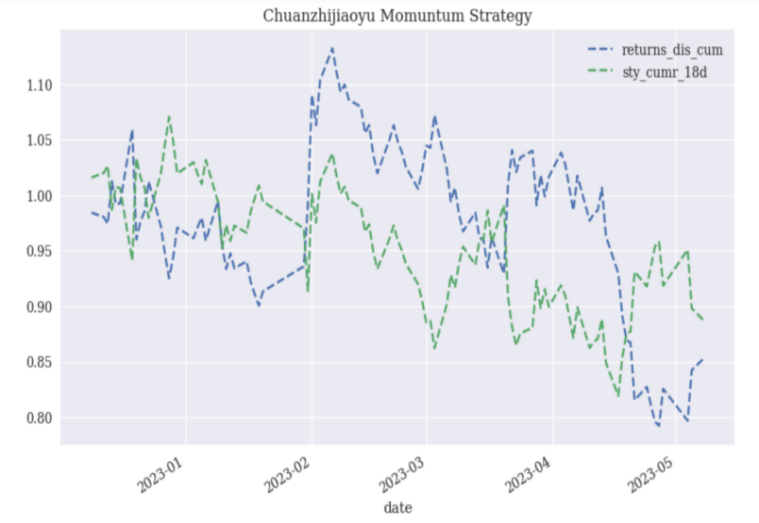
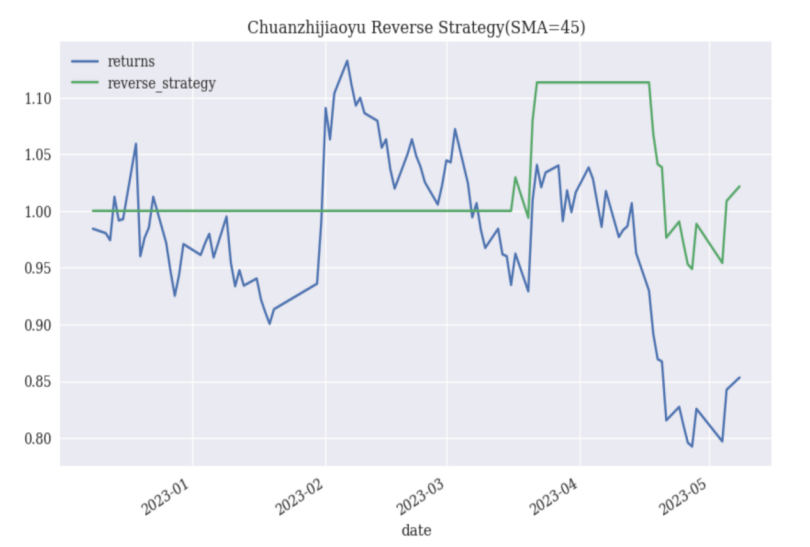
The explanation for this phenomenon is that Kedaxunfei(002230.SZ) has been steadily rising, and it is more advantageous to follow the momentum strategy, which predicts higher returns with previously higher prices, than the reversal approach. But the price of another stock, Chuanzhijiaoyu (003032.SZ), displayed a pattern of abrupt spike and then gradual drop. In essence, momentum strategies(Figure 5) forecasted its short-term ascent but could not identify its downward trend. Contrarian techniques, on the other hand, forecast the downward trend (Figure 6), but regrettably did not catch its quick ascending movement. Therefore, neither strategy performs well in Kedaxunfei(002230.SZ).
|
Figure 5. Chuanzhijiaoyu momuntum strategy. |
|
Figure 6. Chuanzhijiaoyu Reverse Stategy(SMA=45). |
In short, for the majority of AI stocks, momentum approach clearly outperforms reversal method. The decline, however, cannot be accurately predicted using the momentum technique. In contrast, the reversal method can serve as a warning to investors regarding potential pullbacks following a period of overheating-induced growth.
3. Discussion
This article comes to the conclusion that the momentum technique is better suited than the reverse method for predicting the price of AI concept stocks through python fitting. This result, however, goes against what the majority of researchers on the China stock market have concluded. They believe that there is reversal effect rather than a momentum effect on the Chinese stock market. This contradictory outcome can be explained by three different factors [4].
The first is that stocks of the actual AI concept are increasing. In particular, the ongoing development of Chatgpt and the introduction of the AI conversation robot Annie have heightened investors' interest in AI. According to Barberis and Hong and Stein, investors' delayed reaction to new information and the development of price expectations have resulted in a momentum effect, but this effect will reverse itself as prices get closer to expectations) [5][6]. As a result, the performance of the AI concept stocks has not yet met their expectations, which is consistent with the contrarian effect observed in the broader trend of the China stock market. Secondly, according to Tan , the momentum strategy is preferable to bear market in a bull market. At this stage, the majority of AI idea stock prices are rising rather than experiencing a shock, therefore momentum approach will be more useful than contrarian strategy [7]. Last but not least, from the perspective of behavioural finance, the DHS model by Daniel, Hirschleifer, and Subrahmanyam states that investors' overconfidence and biassed self-attraction behaviour causes the stock price to follow the momentum strategy in the short term but is suitable for reversal in the long term [8]. Consequently, when the irrational enthusiasm for AI subsides, AI-related stocks are likely to behave similarly to other stocks that adhere to the reversal strategy.
Even while the momentum method now outperforms the reversal technique, they can both be converted. According to Song's hypothesis, investors will select the momentum strategy if they sense wealth, as opposed to the reversal approach otherwise [9]. Therefore, the trajectory of AI concept stocks will once more follow the reversal strategy in the future when the three factors supporting the momentum approach mentioned above shift, i.e. when the enthusiasm for AI wanes.
4. Conclusion
According to the results of this study, momentum strategy can forecast at least 80% of the upcoming stock price changes of the majority of AI concept stocks listed on the Chinese stock market. Contrarily, the contrarian approach is unable to accurately forecast market movements. However, people can identify theoretical reasons supporting the use of the momentum strategy. Despite contradicting the academic theory that suggests a reversal pattern in the overall Chinese stock market, there are several factors specific to the enthusiastic market conditions of AI concept stocks, their growth stage, and the principles of behavioral finance that can explain this deviation. Research by Barberis, Hong and Stein, as well as the DHS model, propose that once the AI market becomes overheated, the contrarian strategy may regain its effectiveness.
Indeed, the omission of turnover data in the paper is a notable flaw. By only considering the opening and closing prices of AI concept stocks, important information about trading volume and liquidity is overlooked. Additionally, the study method does not create a combination that wins and one that loses; instead, it directly simulates the outcomes using Python following the principles of the two strategies, allowing for the adoption of more precise prediction techniques in subsequent studies.
The existence of the momentum effect is confirmed in this paper, but it only applies to the enthusiastic rising period in the Chinese stock market. There is still much to be learned about the momentum strategy and reversal strategy's existence in China's stock market in terms of their form, reasons for existing, and ability to predict stock prices.
Acknowledgment
First and foremost, I want to thank Renmin University of China, where I received my education and cultivation, as well as all of my lecturers for guiding me through the research process and teaching me about economic theory, Python, and research methodologies. Additionally, I want to appreciate the teaching assistants for their aid with paper formatting and writing abilities. Last but not least, I want to express my gratitude to the references' authors for their work. I would not have been able to complete this paper without their theoretical backing.
References
[1]. Jegadeesh N., Titman S.Returns to Buying Winners and Selling Losers: Implications for Stock Market Efficiency[J]. Journal of Finance, 1993(1): 65~91.
[2]. De Bondt W.F.M., Thaler R.Does the Stock Market Overreact? [J]. Journal of Finance, 1985(3): 793~805.
[3]. Fama E.F., French K.R..A Five-factor Asset Pricing Model[J]. Journal of Financial Economics, 2015(1): 1~22.
[4]. Chui A C W, Titman S, John Wei. Individualism and Momentum around the World. The Journal of Finance, 2010(1).
[5]. Barberis, Nicholas, Shleifer, Andrei and Vishny, Robert 1998, “A Model of Investor Sentiment”, Journal of Financial Economics, Vol.49, pp.307~343.
[6]. Hong, H. and Stein, J.C., 1999, “A Unified Theory of Underreaction, Momentum Trading and Overreaction in Asset Markets”, The Journal of Finance, Vol.54, pp. 2143~2184.
[7]. Tan Xiaofen, Empirical Research and Theoretical Explanation of Momentum Effect and Reversal Effect in China's A-Share Market_China Soft Science 2012 Vol.8, p. 45-57.
[8]. Daniel K., Hirshleifer D., Subrahmanyam A. Inverstor psychology and security market under and overreaction[J]. Journal of Finance, 1998(6):1839~1885.
[9]. Song Guanghui, Analysis of stock price momentum effect and reversal effect based on evolutionary game model,_Accounting Monthly_2019_Vol.9, p156-163.
Cite this article
Zhao,Y. (2023). Research on momentum strategy and contrarian strategy in AI stock prediction. Applied and Computational Engineering,29,125-132.
Data availability
The datasets used and/or analyzed during the current study will be available from the authors upon reasonable request.
Disclaimer/Publisher's Note
The statements, opinions and data contained in all publications are solely those of the individual author(s) and contributor(s) and not of EWA Publishing and/or the editor(s). EWA Publishing and/or the editor(s) disclaim responsibility for any injury to people or property resulting from any ideas, methods, instructions or products referred to in the content.
About volume
Volume title: Proceedings of the 5th International Conference on Computing and Data Science
© 2024 by the author(s). Licensee EWA Publishing, Oxford, UK. This article is an open access article distributed under the terms and
conditions of the Creative Commons Attribution (CC BY) license. Authors who
publish this series agree to the following terms:
1. Authors retain copyright and grant the series right of first publication with the work simultaneously licensed under a Creative Commons
Attribution License that allows others to share the work with an acknowledgment of the work's authorship and initial publication in this
series.
2. Authors are able to enter into separate, additional contractual arrangements for the non-exclusive distribution of the series's published
version of the work (e.g., post it to an institutional repository or publish it in a book), with an acknowledgment of its initial
publication in this series.
3. Authors are permitted and encouraged to post their work online (e.g., in institutional repositories or on their website) prior to and
during the submission process, as it can lead to productive exchanges, as well as earlier and greater citation of published work (See
Open access policy for details).
References
[1]. Jegadeesh N., Titman S.Returns to Buying Winners and Selling Losers: Implications for Stock Market Efficiency[J]. Journal of Finance, 1993(1): 65~91.
[2]. De Bondt W.F.M., Thaler R.Does the Stock Market Overreact? [J]. Journal of Finance, 1985(3): 793~805.
[3]. Fama E.F., French K.R..A Five-factor Asset Pricing Model[J]. Journal of Financial Economics, 2015(1): 1~22.
[4]. Chui A C W, Titman S, John Wei. Individualism and Momentum around the World. The Journal of Finance, 2010(1).
[5]. Barberis, Nicholas, Shleifer, Andrei and Vishny, Robert 1998, “A Model of Investor Sentiment”, Journal of Financial Economics, Vol.49, pp.307~343.
[6]. Hong, H. and Stein, J.C., 1999, “A Unified Theory of Underreaction, Momentum Trading and Overreaction in Asset Markets”, The Journal of Finance, Vol.54, pp. 2143~2184.
[7]. Tan Xiaofen, Empirical Research and Theoretical Explanation of Momentum Effect and Reversal Effect in China's A-Share Market_China Soft Science 2012 Vol.8, p. 45-57.
[8]. Daniel K., Hirshleifer D., Subrahmanyam A. Inverstor psychology and security market under and overreaction[J]. Journal of Finance, 1998(6):1839~1885.
[9]. Song Guanghui, Analysis of stock price momentum effect and reversal effect based on evolutionary game model,_Accounting Monthly_2019_Vol.9, p156-163.