


1. Introduction
The World Happiness Index (HI) is an attempt to define happiness based of a series of formative indicators, each of them supposedly reflecting a component of the general happiness of a nation, to generate a composite, latent index by which the nations may be ranked according to their happiness.[1] Since the 20th century, people's pursuit of happiness has become an important research direction. Previous scholars have different understandings and measures of happiness, but they are all trying to explore a key question: what makes people feel happy, and how to evaluate this sense of happiness?
To evaluate the state of human welfare, numerous indicators have been developed and are applied as statistical measures. [2]These efforts include studying individual subjective feelings from the perspectives of psychology and sociology, as well as analyzing the impact of social welfare and economic conditions on happiness from an economic perspective. We have explored and studied various aspects, including subjective well-being surveys, material living standards indicators, and the quality of social relationships.
Why am I so interested in happiness index? Because happiness is not only an emotion, but also an important symbol of social progress and personal satisfaction. Understanding people's feelings of happiness can not only help policy makers better formulate policies and improve social welfare levels, but also guide individuals to make wiser choices when pursuing happiness.
The study of happiness index not only focuses on individual happiness feelings, but also examines the impact of social structure, economic development level, government policies, and other factors on the overall level of happiness. For example, some studies have found a certain positive correlation between economic income and happiness, but it is not absolute. Other factors such as social relationships, health status, and job satisfaction also have an impact on happiness. Therefore, research on happiness index is also helping us re-examine the definition and measurement standards of social progress, no longer solely focusing on economic growth, but paying more attention to people's quality of life and happiness feelings.
In this paper, we will delve into the significance, research methods, and implications for individuals and society of happiness index, in order to provide readers with a comprehensive guide to happiness index research.
2. Factors influencing happiness index obtained from data
2.1. Inspiration from heat maps
Heat maps, as an intuitive visualization tool, vividly demonstrate the strong relationship between happiness and a country's gross domestic product (GDP) per capita, healthy life expectancy and freedom of life choices. This finding provides insights that reveal a significant positive correlation between improvements in economic, health and autonomous life choices and subjective well-being across the globe.
First, an increase in GDP per capita usually implies better material living conditions. This enhancement not only provides individuals with more opportunities and resources, but may also have a direct impact on their well-being. A prosperous economic situation means that more social resources are available to improve the quality of life, creating a more generous and fulfilling living environment for individuals. Whenever individuals receive high pay, they cannot only satisfy their budgets, but they can also budget for leisure, such as cars. However, sadness dwells when low salaries make people struggle to cater to their budgets. Therefore, high GDP increases happiness.[3]
Second, an increase in healthy life expectancy does not only reflect improved medical and sanitary conditions, but also demonstrates society's higher concern for the quality of an individual's life. Physical health is the cornerstone for building a happy life, so higher healthy life expectancy is closely related to a higher happiness index. A healthy society means that more people are able to enjoy a longer life and a higher quality of life, thus enhancing overall well-being.
Finally, increased freedom of life choices provides individuals with more autonomy. This increased autonomy has a positive impact on individual satisfaction and happiness. The ability to freely make personal life decisions regarding career, family, and socialization, and to achieve a life that is more in line with the individual's values and aspirations, is one of the key factors in increased well-being.
This deeply relevant finding not only has far-reaching implications for the field of happiness research, but also provides strong guidance for the development of national policies. Considering multiple factors such as economy, health and freedom in a comprehensive manner in policy making is expected to contribute to the overall prosperity of a society and the happiness of its inhabitants. It also implies that national policies should aim to create more inclusive and sustainable social environments in order to improve the overall quality of life.(From Figure.1)
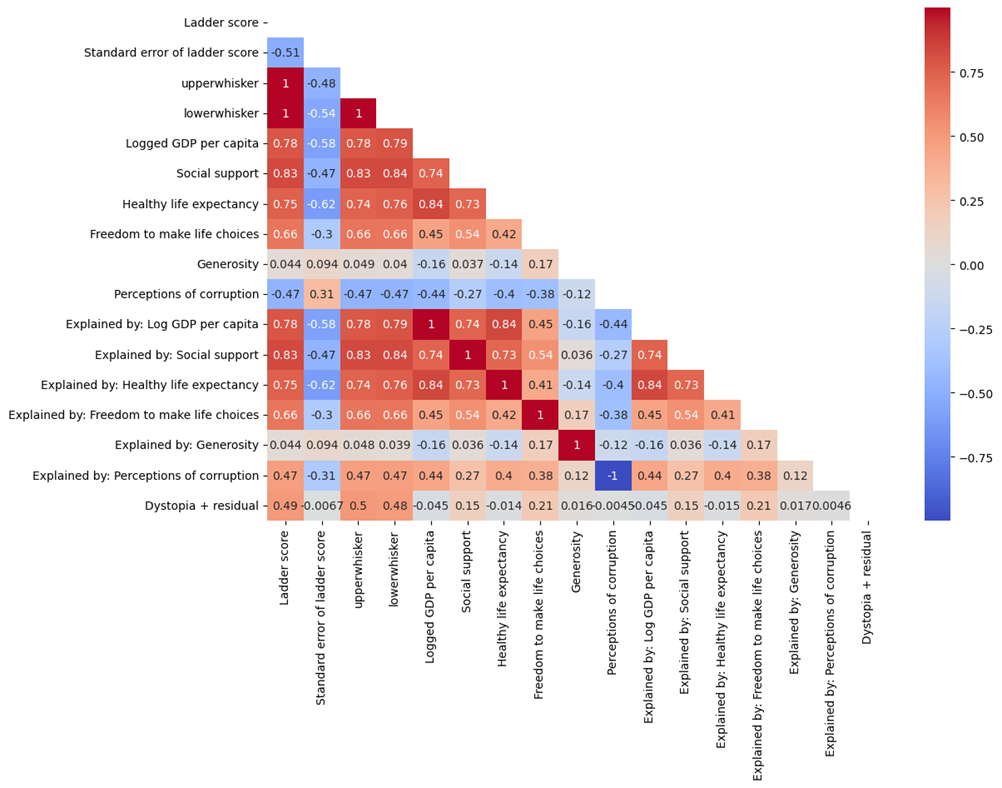
Figure 1: factors heat maps
2.2. Insights from the Bar Chart
Figure 2 presents the distribution of each data column and helps us to gain insight into the overall characteristics of the data. A closer analysis of the chart reveals a significant similarity between the happiness index and the logarithm of GDP per capita. This means that the logarithm of GDP per capita seems to influence the happiness rankings or scores to some extent when examining the happiness index. The existence of this similarity may imply that in certain countries or regions, as economic conditions improve, people's happiness also shows some improvement.
However, it should be emphasized that this is only a preliminary observation, and the specific complexity of the relationship requires further in-depth research and analysis. We cannot simply establish a single causal relationship between improved economic levels and increased happiness, as there are other possible influencing factors that need to be considered. Therefore, this observation provides a thought-provoking starting point for embarking on more in-depth research in the future.
For each of the data columns in this bar chart, the distribution is clearly visible on the graph, providing us with a more comprehensive picture of the overall pattern of the data. Further analysis reveals the similarity between the happiness index and the logarithm of GDP per capita. This trend may imply that in certain countries or regions, as the economic level increases, people's happiness also shows an upward trend.
However, it is important to note that to deeply understand the mechanism behind this trend, we need to conduct more systematic and exhaustive studies. Therefore, this initial observation provides a good starting point for future in-depth studies on the relationship between happiness and economic level in a country or region.
To summarize, the analysis of this bar chart provides us with some interesting insights and triggers in-depth thinking about the relationship between happiness and economic level in countries or regions. This initial observation lays the foundation for future research work, and we look forward to a more detailed and comprehensive study that will reveal the nature of this relationship and its practical implications for society.(From Figure.2)
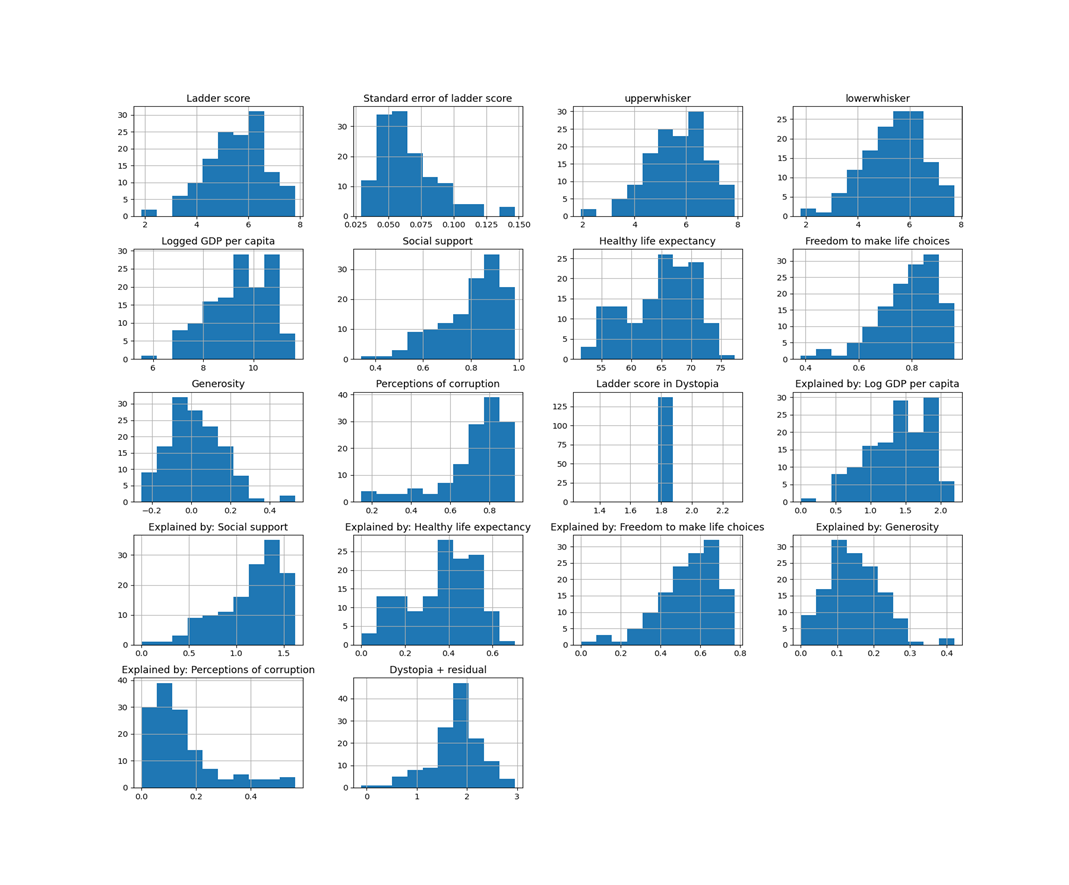
Figure 2: bar chart
2.3. Discovery of scatter plots
A closer look at these six scatter plots clearly reveals some striking trends. First, it is worth noting the significant positive correlation between the happiness index and healthy life expectancy. This suggests that people are more likely to experience higher levels of happiness in regions or countries where they have a longer healthy life expectancy.
Secondly, there is also a positive relationship between social support and freedom of life choices and happiness index. Increases in social support and freedom of life choices appear to be associated with higher happiness indices. This suggests that having a strong social support system and increased individual autonomy may lead to more happiness for people.
On the other hand, there is a negative correlation between happiness index and perception of corruption. This implies that people are more likely to have higher levels of happiness in regions or countries with lower perceptions of corruption. This observation emphasizes the importance of clean governance and anti-corruption advocacy in improving the happiness index.
However, this last trend shows a relatively low correlation between happiness index and generosity, suggesting that generosity has a relatively small impact on happiness. This may imply that the relationship between generosity and happiness is not very strong and that other factors may play a more important role in influencing the happiness index.
The discovery of these trends provides a window of insight into what constitutes happiness. By analyzing these trends, we are able to see that people's subjective feelings of happiness are influenced by multiple factors at different levels, including health, social support, freedom of life choices, anti-corruption advocacy and generosity. This not only helps us understand the relative importance of each factor in happiness, but also provides useful clues for formulating happiness-enhancing policies.
Particularly important to emphasize is the negative correlation for perceived corruption, which provides clear guidance for social governance and anti-corruption advocacy. By establishing a transparent, fair, and clean social environment, people's trust in the social system can be increased, which indirectly affects their well-being. This provides a clear path for governments and relevant institutions to improve governance and fight corruption.
These factors need to be considered more comprehensively when formulating policies to create a social environment with a greater sense of well-being. Taking into account a number of factors, such as health, social support, individual autonomy and corruption perceptions, is expected to contribute to the overall prosperity of society and the well-being of its inhabitants.(From Figure.3)
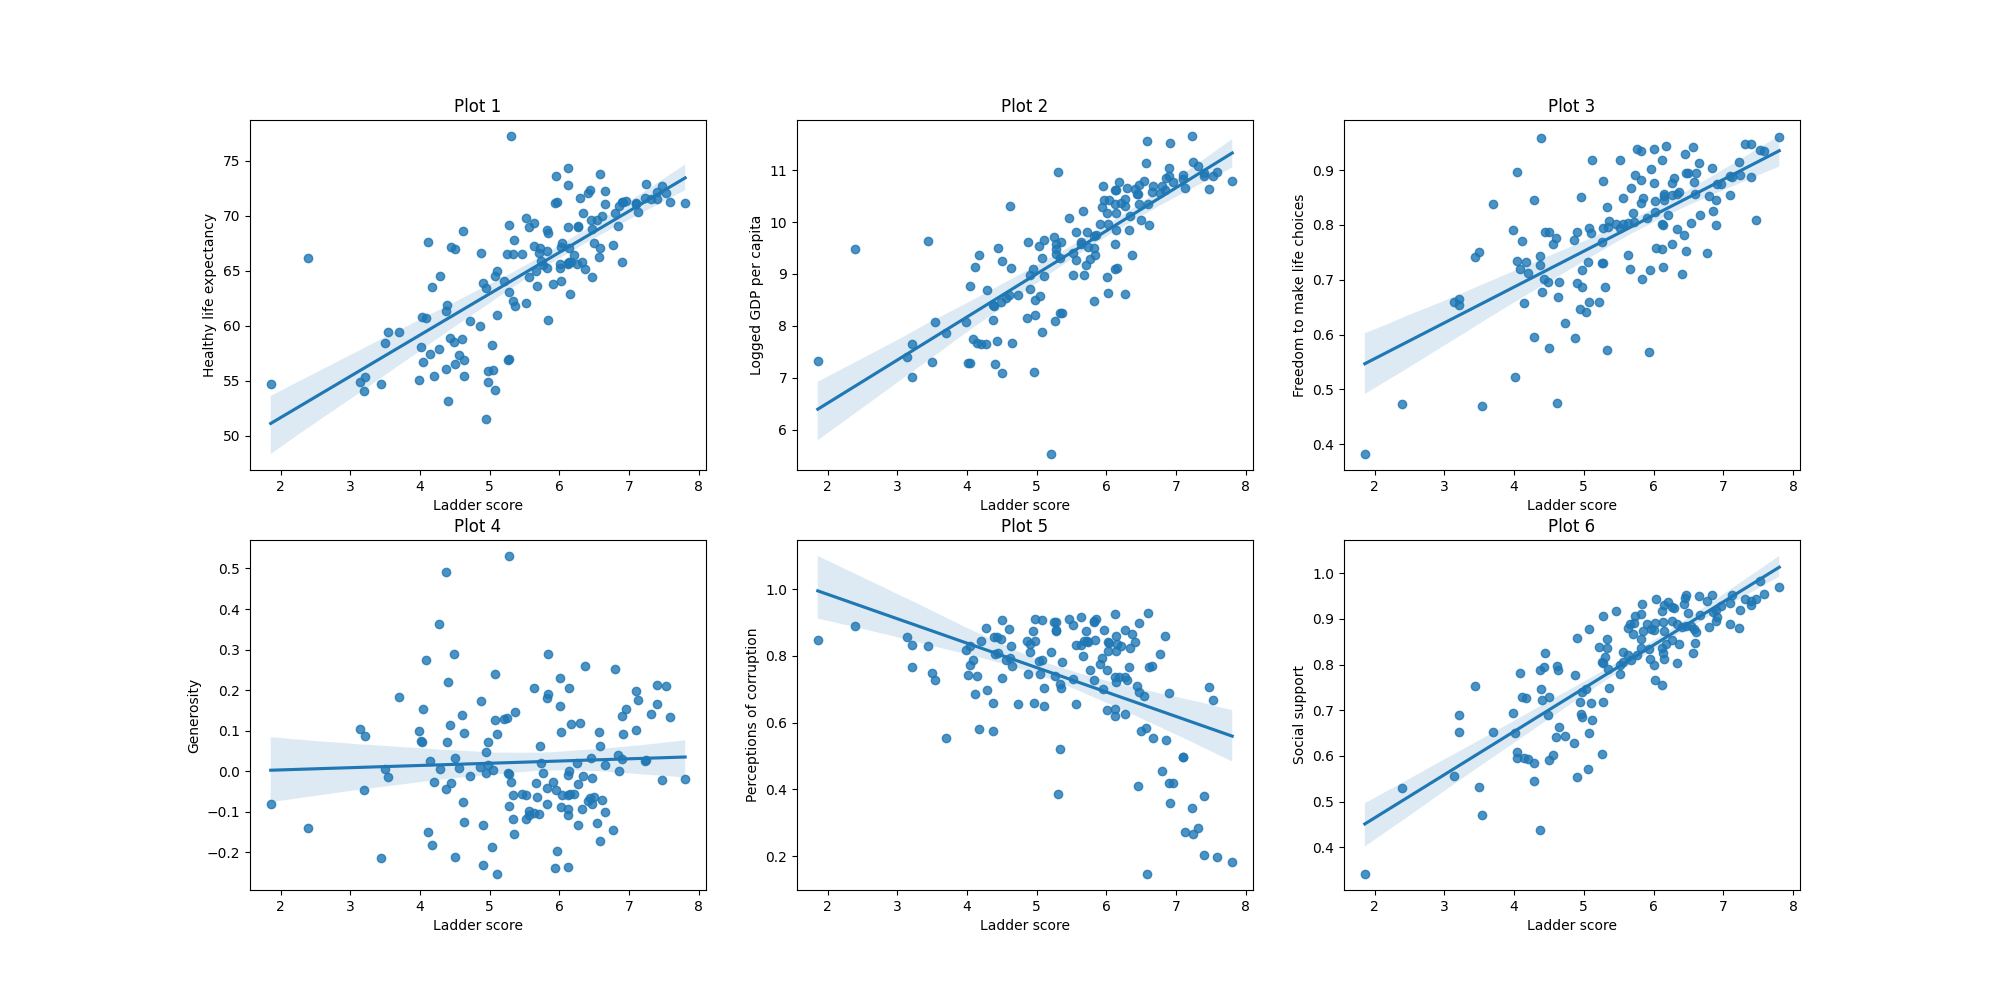
Figure 3: scatter plots
2.4. The relationship between GDP, social support, and regions
Figure 4, we carefully observed the average happiness index scores for each region. The results show that countries in Western Europe and North America generally have a higher happiness index, reflecting a relatively high level of life satisfaction among residents in these regions. On the contrary, countries in Africa and Southeast Asia exhibit lower happiness indices, revealing an overall lower level of happiness among residents in these regions.
The global regional differences may be influenced by multiple factors. Firstly, the level of economic development is a significant factor. Western Europe and North America typically have higher economic levels, which are directly related to better quality of life and greater happiness. The sound social welfare system and relatively stable political environment in these regions also provide better living conditions for residents, thereby improving overall happiness. But in the case of the U.S., within-country analysis, happiness has a positive relationship with income level but the utility curve is similar to the one of diminishing marginal utility. In other words, the incremental size of happiness is smaller when income is increasing by $1,000.[4]
In contrast, countries in Africa and Southeast Asia may face multiple economic, social, and health challenges. Low levels of economic development, inadequate social support systems, and health issues may become the main factors that constrain the improvement of happiness in these regions. This indicates that improving the happiness index in these regions requires a comprehensive consideration of improving economic, social, and health conditions.
In the chart, the size of the circle represents the step score, while the color reflects the geographical region where the country is located. This design allows us to clearly see the distribution of happiness index in different regions. By selecting social support and per capita gross domestic product (GDP) as the horizontal and vertical coordinates for the study, the researchers successfully captured the impact of these factors on the happiness index.
When observing the chart, we can see that most of the circles are distributed in the upper right corner of the image, which means that these countries usually have a higher happiness index in situations of high social support and per capita GDP. Especially, the happiness index of European countries is usually higher, which may be closely related to their relatively high social support system and economic level. On the contrary, the happiness index of sub Saharan African countries is relatively low, which may be affected by lower levels of economic development and insufficient social support systems.
These observations provide us with profound insights, indicating that social support and economic conditions play a crucial role in shaping the distribution of global happiness indices. Therefore, future efforts should focus on targeted improvement of these factors, especially in areas with lower levels of development. By formulating and implementing relevant policies, we are expected to promote the overall improvement of happiness on a global scale.(From Figure.4)
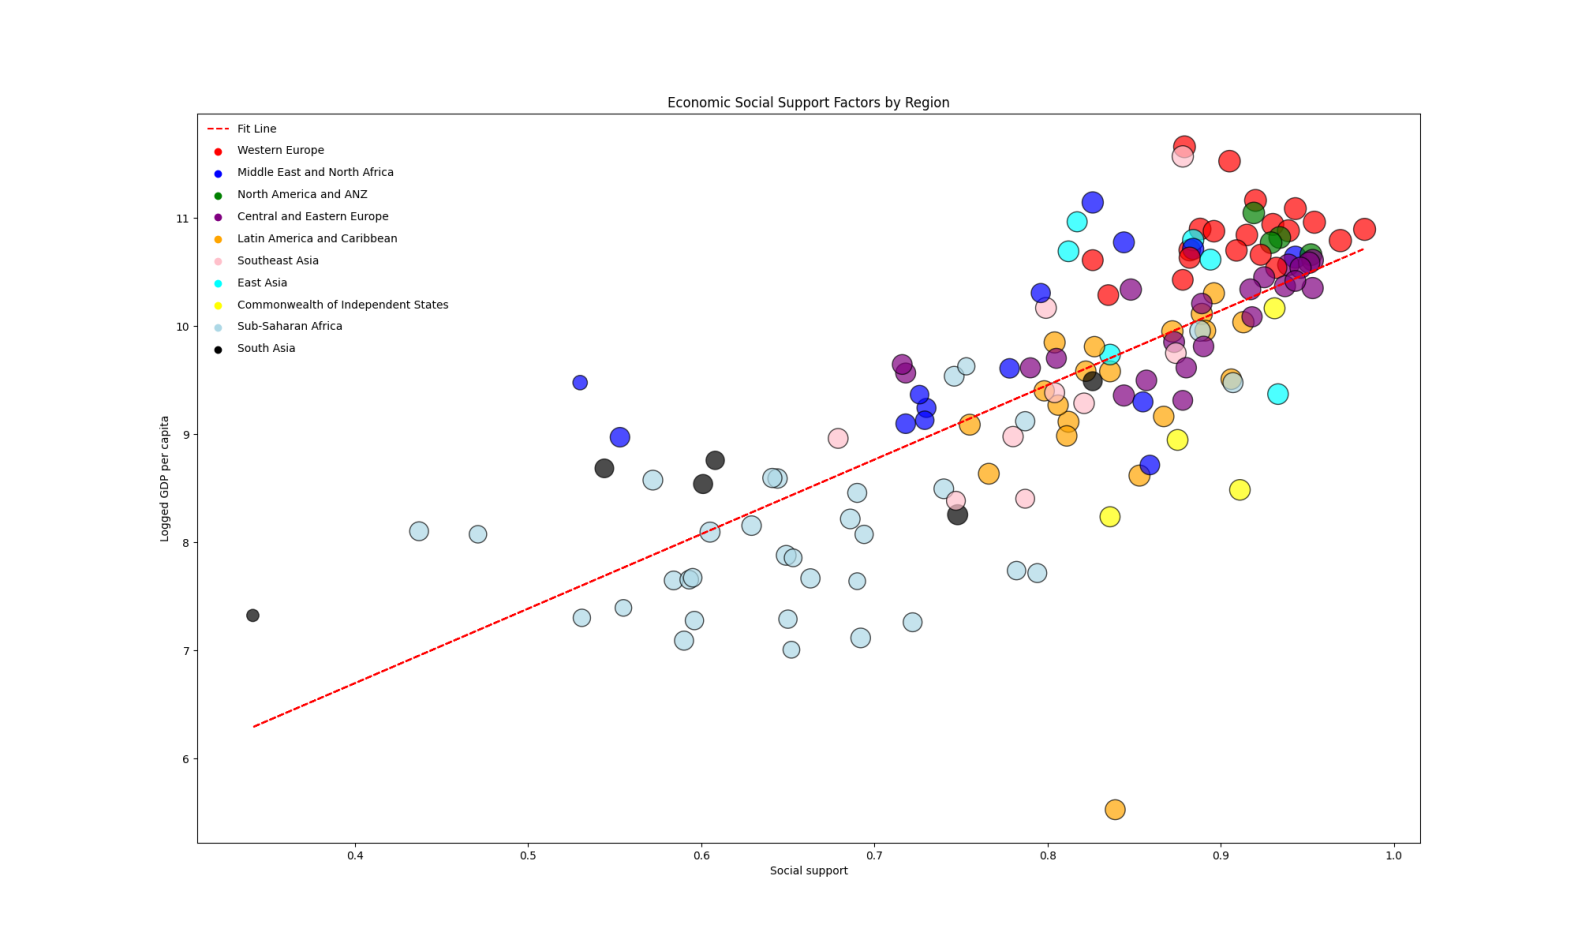
Figure 4: Diagram of the relationship between GDP, social support, and regions
3. Conclusion
By analyzing these charts in depth, we can gain a fuller understanding of how happy people are across the globe. First, it is observed that people in Europe and North America seem to experience happiness more generally. This may be related to factors such as the relatively high standard of living, social support and well-being policies in these regions. However, it is not just a simple geographical difference, but involves several complex influences.
People's well-being is influenced by a combination of factors, the most notable of which include recorded gross domestic product (GDP) per capita, social support, healthy life expectancy, freedom of personal life choices, and perceptions of corruption. The ladder scores show a significant positive correlation with these factors. This means that higher economic levels are tied to better quality of life, stronger social support systems, and more rights to life choices. The overall health of the society, perceived freedom, and aversion to corruption are all closely related to the happiness index, creating a more enjoyable and fulfilling life for the individual.
Interestingly, there is a negative correlation between the ladder score and perception of corruption. This suggests that there is some contradiction between individuals' concern for social justice and integrity and their happiness. Corruption tends to be a negative factor in society, negatively affecting individuals' trust and satisfaction. Therefore, regulating and combating corruption also becomes crucial in the pursuit of happiness. The national average of subjective well-being would decrease by 0.23 points if a government became more corrupt by 10 points, and unemployment rate had to decrease equivalently by 9.2% to keep the national average subjective well-being unchanged.[5]
These findings not only emphasize the impact of different factors on well-being globally, but also provide a strong reference for policymaking. The finding can be used to inform public conversations and policy makers’ decisions about budgeting.[6] It is important to note that happiness is a complex and multi-layered subject that requires the comprehensive consideration of multiple aspects in order to achieve a more holistic social well-being. In future research, differences in well-being across cultures, education levels and social systems can be further explored to provide deeper insights for building a more equitable and sustainable society.
References
[1]. Carlsen L. Happiness as a sustainability factor. The world happiness index: a posetic-based data analysis[J]. Sustainability science, 2018, 13(2): 549-571.
[2]. Cuijpers R. GDP and Happiness[J]. Gross National Happiness, the new GDP, 2009: 9-56.
[3]. Liu Q. Factors Affecting the Happiness Index[J]. Interdisciplinary Humanities and Communication Studies, 2024, 1(5).
[4]. KIM D. Factors affecting the happiness[D]. KDI School, 2015.
[5]. Li Q, An L. Corruption takes away happiness: Evidence from a cross-national study[J]. Journal of Happiness Studies, 2020, 21: 485-504.
[6]. Musikanski L, Cloutier S, Bejarano E, et al. Happiness index methodology[J]. Journal of Sustainable Social Change, 2017, 9(1): 2.
Cite this article
Xiao,J. (2024). Multidimensional Exploration of Happiness: A Comprehensive Analysis of Social, Economic, Psychological, and Other Factors. Communications in Humanities Research,38,63-69.
Data availability
The datasets used and/or analyzed during the current study will be available from the authors upon reasonable request.
Disclaimer/Publisher's Note
The statements, opinions and data contained in all publications are solely those of the individual author(s) and contributor(s) and not of EWA Publishing and/or the editor(s). EWA Publishing and/or the editor(s) disclaim responsibility for any injury to people or property resulting from any ideas, methods, instructions or products referred to in the content.
About volume
Volume title: Proceedings of the 3rd International Conference on Literature, Language, and Culture Development
© 2024 by the author(s). Licensee EWA Publishing, Oxford, UK. This article is an open access article distributed under the terms and
conditions of the Creative Commons Attribution (CC BY) license. Authors who
publish this series agree to the following terms:
1. Authors retain copyright and grant the series right of first publication with the work simultaneously licensed under a Creative Commons
Attribution License that allows others to share the work with an acknowledgment of the work's authorship and initial publication in this
series.
2. Authors are able to enter into separate, additional contractual arrangements for the non-exclusive distribution of the series's published
version of the work (e.g., post it to an institutional repository or publish it in a book), with an acknowledgment of its initial
publication in this series.
3. Authors are permitted and encouraged to post their work online (e.g., in institutional repositories or on their website) prior to and
during the submission process, as it can lead to productive exchanges, as well as earlier and greater citation of published work (See
Open access policy for details).
References
[1]. Carlsen L. Happiness as a sustainability factor. The world happiness index: a posetic-based data analysis[J]. Sustainability science, 2018, 13(2): 549-571.
[2]. Cuijpers R. GDP and Happiness[J]. Gross National Happiness, the new GDP, 2009: 9-56.
[3]. Liu Q. Factors Affecting the Happiness Index[J]. Interdisciplinary Humanities and Communication Studies, 2024, 1(5).
[4]. KIM D. Factors affecting the happiness[D]. KDI School, 2015.
[5]. Li Q, An L. Corruption takes away happiness: Evidence from a cross-national study[J]. Journal of Happiness Studies, 2020, 21: 485-504.
[6]. Musikanski L, Cloutier S, Bejarano E, et al. Happiness index methodology[J]. Journal of Sustainable Social Change, 2017, 9(1): 2.