


1. Introduction
In mandarin, there is a voiceless retroflex fricative /ʂ/ and two retroflex affricatives /ʈʂ, ʈʂʰ/. In General American English (GAE), postalveolar affricates /dʒ, tʃ/ and voiceless postalveolar fricative /ʃ/ play crucial roles in consisting a word. Besides the state of being aspirated and voiced or not, the only difference between the two groups (shown in Table 1) is the place of articulation. Therefore, due to their similarities, it is possible that people who take Mandarin as their mother tongue will be affected when acquiring English [1,2].
Table 1: Two groups of consonants involved in this research.
Voiceless affricative | Voiceless affricative (aspirated) | Voiceless fricative | |
Retroflex | /ʈʂ / | /ʈʂʰ/ | /ʂ/ |
Voiced affricative | Voiceless affricative | Voiceless fricative | |
Postalveolar | /dʒ/ | /tʃ/ | /ʃ/ |
Svantesson first focused on Standard Mandarin’s fricatives and affricates [3]. Three parameters—spectral centroid, spread, and mean intensity level—were taken from the crucial band spectra to create the fricative pattern. Studies on Chinese dialects and other ethnic languages have also benefited from approach [4,5]. It cannot, however, reliably distinguish between various fricatives and affricates.
Six Standard Mandarin fricatives’ energy values were derived by Sun using 162 evenly spaced frequency bands between 2 and 16 kHz [6]. According to principal component analysis, the first three components comprised 94.8% of the data of fricatives.
Eight English fricatives were examined by Jongman and his colleagues using ten acoustic criteria, including spectrum, amplitude, and duration [7,8]. Six spectrum and amplitude-related factors were discovered to be an efficient way to distinguish between the four fricative articulation points.
Ran & Shi conducted an additional study on a few factors utilizing speech pattern research concepts and techniques based on fricative space analysis [4]. Five fricatives from the Beijing dialect are reanalyzed, and the G and D values of fricatives are proposed by normalization and relativism. In the research of Lee et al., Mandarin affricates are proven not to be distinguished through merely one acoustic feature [9].
Lee & Gu examined the connections between acoustic characteristics and phonetic traits for six Mandarin affricates [10]. Praat retrieved the nine acoustic features, which include the duration, amplitude, spectral energy distribution, and F2 start of the subsequent vowel. According to discriminant analysis, combining all nine auditory data provided the six affricates with an 85.9% identification rate. According to a principal component analysis, the first five components supplied 86.3% of the information for the affricates. The most significant auditory factors for Mandarin affricates are the friction’s spectrum energy distribution parameters, some of which primarily affect the articulation site. Others, however, are mainly responsible for the condition of ambition.
Most previous studies focused on the fricatives or the affricatives produced by the Chinese. Scarcely any of them mentioned how Chinese English learners produced comparable phonemes in English and the influence committed by the similar ones in their mother tongue. It is significant for Chinese English learners to realize the differences between those comparable phonemes. Figuring out what are the differences and what are the possible reasons is the first step. Therefore, based on the previous study, the hypothesize of this paper is:
The similarity of comparable phonemes in English and Mandarin will affect Chinese English learners’ acquisition of them.
The hypothesis will be proved to throw examining the acoustic characteristics of fricatives and affricates that occurred in English and Mandarin produced by Chinese English learners, testing the ability of Chinese English learners to differentiate the comparable phonemes, while concluding the influence of mother language, Mandarin, on English during the second language acquisition.
2. Method
2.1. Participants
Four speakers who take Mandarin as their first language (two males and two females) will participate in the research. All four speakers are junior students in English major and have once been trained in a foreign language school for six years, which ensures their English abilities and positive attitudes toward second language acquisition.
2.2. Materials
Two vowels (/ɑ, u/) are selected to combine with the six consonants in Table 1. Therefore, six words for each language are created as the stimuli used in this research. Some other consonants are used as codas to ensure that all the stimuli (especially English ones) are real words. In total, twelve stimuli are listed in Table 2.
Table 2: Stimuli used in this research.
/ɑ/ | /u/ | |||
/ʈʂ / | 渣 /ʈʂa:/ | residue | 珠 /ʈʂu:/ | bead |
/ʈʂʰ/ | 插 /ʈʂha:/ | insert | 出 /ʈʂhu:/ | out |
/ʂ/ | 沙 /ʂa:/ | sand | 书 /ʂu:/ | book |
/dʒ/ | jar /dʒɑːr/ | Jude/dʒuːd/ | ||
/tʃ/ | char /tʃɑːr/ | chew /tʃuː/ | ||
/ʃ/ | sharp/ʃɑːrp/ | shoe /ʃuː/ | ||
2.3. Procedure and Analysis
All the speakers are required to utter the stimuli in Table 2. There are in total 48 audio files are saved in wav form. All in silent experimental environments, recordings are realized as mono soundtracks, ensuring the following analysis’s accuracy.
Praat is used to extract the most important acoustic characteristic of each consonant – spectral moment, which includes spectral centroid (1st order moment), standard deviation (square root of the second-order central moment), skewness (normalized third-order major moment), and kurtosis (normalized fourth-order central moment) [10].
Based on the spectral function of the middle 80% duration of the fricative segment, the spectral centroid (i.e., mean), standard deviation, skewness, and kurtosis are calculated. The spectral centroid represents the center position of the energy; the standard deviation represents the dispersion of the spectrum; the skewness indicates whether the energy is mainly distributed in the high-frequency or low-frequency range (positive skewness indicates more energy in the low-frequency range, while negative skewness indicates more energy in the high-frequency range). The kurtosis represents the sharpness or flatness of the energy concentration area. The algorithms used in the research are listed below (f is the frequency):
\( e=\int _{0}^{∞}f{ |S(f)|^{p}} df \) (1)
3. Results
3.1. Acoustic Characteristics
The current research’s acoustic measurements (spectral centroid (i.e., mean), standard deviation, skewness, kurtosis) are shown in Table.
Table 3: Acoustic characteristics of each speaker.
F1 | M1 | ||||||||||||||||||||||||||
Spectral Centroid | Standard Deviation | Skewness | Kurtosis | Spectral Centroid | Standard Deviation | Skewness | Kurtosis | ||||||||||||||||||||
zha | 949.187 | 1144.572 | 3.274 | 11.323 | 839.369 | 166.979 | 3.612 | 86.081 | |||||||||||||||||||
jar | 1000.112 | 1385.751 | 3.719 | 13.35 | 721.132 | 175.557 | 2.378 | 44.511 | |||||||||||||||||||
cha | 1123.515 | 907.192 | 3.136 | 14.229 | 813.965 | 229.466 | 3.051 | 54.665 | |||||||||||||||||||
char | 869.779 | 759.097 | 5.584 | 42.115 | 738.883 | 200.889 | 2.745 | 72.874 | |||||||||||||||||||
sha | 1417.693 | 1544.709 | 2.105 | 3.726 | 742.533 | 161.284 | 2.41 | 60.874 | |||||||||||||||||||
sharp | 1531.871 | 1591.091 | 1.819 | 2.275 | 749.223 | 134.091 | 6.324 | 211.523 | |||||||||||||||||||
zhu | 464.523 | 824.023 | 6.218 | 40.188 | 531.468 | 244.464 | 2.869 | 68.573 | |||||||||||||||||||
jude | 763.939 | 1253.868 | 4.03 | 16.382 | 514.172 | 320.414 | 3.162 | 53.401 | |||||||||||||||||||
chu | 844.996 | 1390.379 | 3.526 | 11.936 | 591.888 | 217.262 | 4.34 | 120.17 | |||||||||||||||||||
chew | 932.326 | 1403.876 | 3.096 | 9.621 | 469.828 | 310.597 | 4.363 | 68.726 | |||||||||||||||||||
shu | 1084.382 | 1679.568 | 2.473 | 5.022 | 567.796 | 236.245 | 5.833 | 141.941 | |||||||||||||||||||
shoe | 1117.351 | 1706.358 | 2.269 | 3.844 | 559.012 | 300.696 | 2.236 | 37.911 | |||||||||||||||||||
F2 | M2 | ||||||||||||||||||||||||||
Spectral Centroid | Standard Deviation | Skewness | Kurtosis | Spectral Centroid | Standard Deviation | Skewness | Kurtosis | ||||||||||||||||||||
zha | 429.197 | 604.578 | 4.536 | 30.889 | 689.736 | 391.863 | 2.691 | 16.63 | |||||||||||||||||||
jar | 490.858 | 561.513 | 6.094 | 86.058 | 676.058 | 393.226 | 5.289 | 62.139 | |||||||||||||||||||
cha | 740.83 | 926.175 | 3.106 | 15.606 | 714.079 | 310.019 | 2.317 | 28.692 | |||||||||||||||||||
char | 629.468 | 629.468 | 4.058 | 37.737 | 628.606 | 444.773 | 5.025 | 51.73 | |||||||||||||||||||
sha | 1092.696 | 1241.657 | 2.436 | 11.488 | 786.884 | 362.643 | 6.668 | 88.446 | |||||||||||||||||||
sharp | 999.193 | 1178.029 | 2.489 | 11.722 | 711.993 | 318.395 | 6.043 | 89.853 | |||||||||||||||||||
zhu | 351.329 | 261.873 | 16.662 | 501.075 | 310.645 | 235.017 | 14.955 | 357.457 | |||||||||||||||||||
jude | 374.002 | 336 | 15.056 | 401.449 | 332.309 | 261.398 | 15.436 | 334.625 | |||||||||||||||||||
chu | 355.487 | 398.635 | 19.046 | 534.074 | 338.749 | 342.323 | 12.966 | 216.327 | |||||||||||||||||||
chew | 528.183 | 721.634 | 5.996 | 58.49 | 369.522 | 387.355 | 13.155 | 200.559 | |||||||||||||||||||
shu | 419.813 | 820.224 | 10.468 | 146.319 | 345.97 | 462.854 | 10.108 | 120.338 | |||||||||||||||||||
shoe | 639.572 | 976.262 | 5.729 | 56.204 | 348.826 | 445.349 | 11.411 | 150.122 | |||||||||||||||||||
The method of numeric outlier is used to calculate the IQR (Inter Quartile Range) to examine the nonparametric outliers. Box plots for the results of the test are presented below. Two outliers in the spectral centroid’s data are displaced from the four figures. Meanwhile, more outliers are displaced in Figures 3&4, which indicates that the data from extracted skewness and kurtosis are non-convergent. This phenomenon may be explained in two ways. First, unlike spectral centroid and standard deviation, skewness and kurtosis are more personalized. Speakers may produce them differently due to their biological differences. Moreover, the limitation of sample size may also be a reason for the outliers, which could be further examined with a larger sample size.
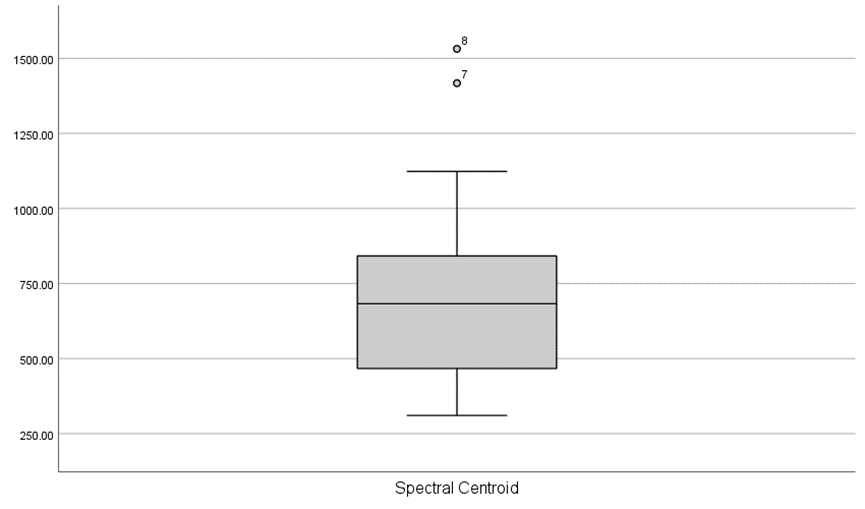
Figure 1: Box plot of spectral centroid.
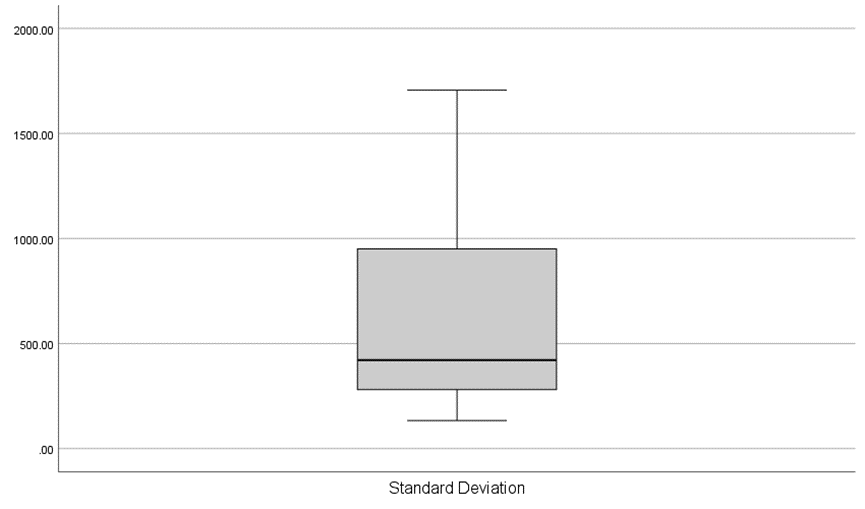
Figure 2: Box plot of standard deviation.
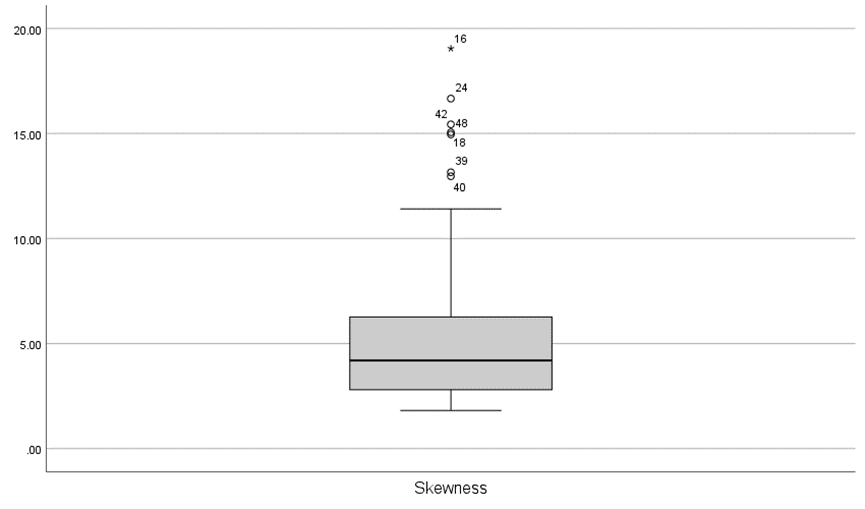
Figure 3: Box plot of skewness.
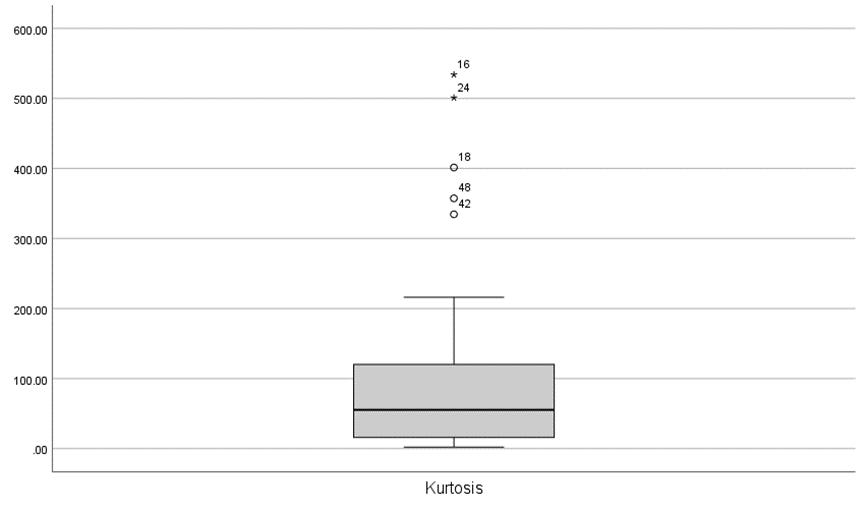
Figure 4: Box plot of Kurtosis.
A one-way ANOVA was performed to compare the effect of language on each acoustic characteristic for the three comparable groups. This test includes 4 speakers * 2 vowels * 6 comparable phonemes = 48 acoustic features that are extracted to be compared with different languages. The results are listed below in Table 3. It revealed that there was no statistically significant difference in the four characteristics in all three groups, which indicates that language is not one of the main factors influencing a speaker’s producing fricatives and affricatives differently. These findings at least hint that participants, representatives of professional English learners with Mandarin as their mother tongue, have difficulty in differentiating the comparable fricatives and affricates that occurred in both English and Mandarin.
Table 4: Summary of results of ANOVA tests for each comparable group.
/ʈʂ /-/dʒ/ | /ʈʂʰ/-/tʃ/ | /ʂ/-/ʃ/ | ||||||
F | Sig. | F | Sig. | F | Sig. | |||
Spectral Centroid | 0.151 | 0.703 | 2.094 | 0.17 | 0.018 | 0.895 | ||
Standard Deviation | 0.007 | 0.934 | 0.268 | 0.613 | 0.003 | 0.955 | ||
Skewness | 0.143 | 0.711 | 1.138 | 0.304 | 0.094 | 0.763 | ||
Kurtosis | 0.721 | 0.41 | 1.01 | 0.332 | 0.003 | 0.958 | ||
3.2. Euclidean Distances
After the four characteristics are extracted, Euclidean distance is used to test the similarity between the comparable phonemes in each group. In mathematics, the Euclidean distance between two points in Euclidean space is the length of a line segment between the two points. It can be calculated from the Cartesian coordinates of the points using the Pythagorean theorem, occasionally called the Pythagorean distance.
The distance between two objects that are not points is usually the smallest distance between pairs of points from the two objects. Formulas are known for computing distances between different types of objects. The formula is listed below:
\( d=\sqrt[]{\sum _{i=1}^{n}{({x_{i}}-{y_{i}})^{2}}} \) (2)
The distances between each comparable phoneme are listed in Table 4. The displacement of distances is shown in Figure 5, where the values are most gathered in the range under 300.
Table 5: Euclidean Distances between each comparable phoneme.
/ʈʂ /-/dʒ/ | /ʈʂʰ/-/tʃ/ | /ʂ/-/ʃ/ | ||||||
/ɑ/ | /u/ | /ɑ/ | /u/ | /ɑ/ | /u/ | |||
F1 | 246 | 524 | 295 | 88 | 123 | 42 | ||
F2 | 93.29 | 126.24 | 317.69 | 600.42 | 113.1 | 284.23 | ||
M1 | 125.63 | 79.36 | 82.37 | 162.04 | 153.28 | 122.74 | ||
M2 | 47.61 | 41.07 | 161.25 | 56.78 | 87 | 34.69 | ||
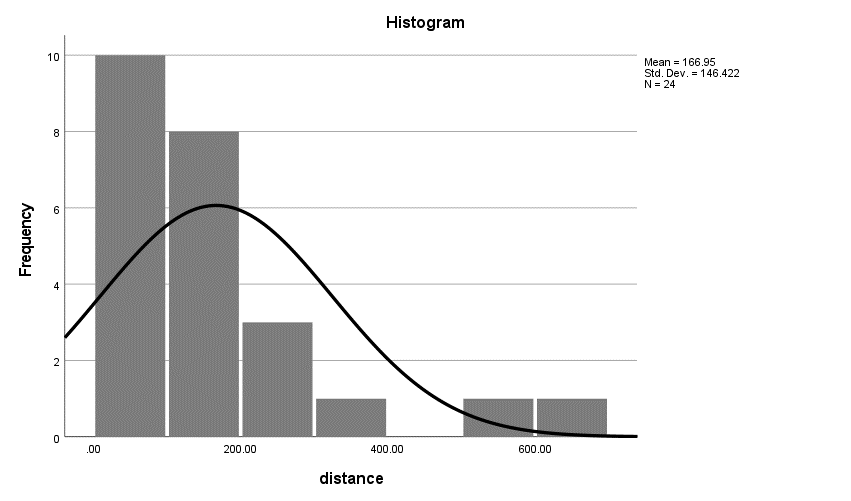
Figure 5: Histogram of the calculated distance.
Table 6: Results of K-means cluster for distance.
Final Cluster Centers | ||
Cluster | ||
1 | 2 | |
Distance | 122.13 | 480.70 |
Number of Cases in each Cluster | ||
Cluster | 1 | 21 |
2 | 3 | |
Valid | 24 | |
The classic distance-based clustering algorithm is used here to separate these calculated distances into two degrees. Due to the limited sample size, the number of cluster groups was set as two. The result of the K-means cluster is shown in Table 5. The final cluster centers after ten iterations are 122.13 for group one and 480.7 for group two. Since the smaller the distance is, the similar the pronunciations of the comparable phonemes are, group one refers to a worse degree of differentiation. In contrast, group two refers to a better one. Only 12.5% (three out of twenty-four) of the calculated distances belong to group two, which represents the deficiency of Chinese English learners’ abilities to differentiate similar fricatives and affricatives that occurred in both English and Mandarin.
3.3. Gender
As the last research orientation for the present experiment, the effect imparted upon the ability to differentiate similar phonemes by gender is elaborated in this part. Gender has already appeared as an environmental condition antecedently, while the following main content is to expound its effect on speech with the statistical support in Table 6.
A one-way ANOVA was performed to compare the effect of gender on distances between comparable phonemes. This test includes 4 speakers * 2 vowels * 3 pairs of comparable phonemes = 12 Euclidean distances that are compared with in genders. The results revealed that there were statistically significant differences in the groups of spectral centroids (F=7.414, p = .009) and standard deviation (F=62.893, p =.000). In contrast, no statistically significant difference was found in the groups of skewness (F=.157, p =.694) and kurtosis (F=.577, p =.451).
Table 7: Results of the ANOVA test for the factor of gender.
F | Sig. | |
Spectral Centroid | 7.414 | .009 |
Standard Deviation | 62.893 | .000 |
Skewness | .157 | .694 |
Kurtosis | .577 | .451 |
There are two possible explanations. First, gender affects the ability to differentiate the comparable phonemes during second language acquisition for Chinese English Learners in terms of study attitudes, study methods, and cognitive ability in different genders, which requires further study to verify. However, this difference may be caused by biological differences between the two genders.
4. Discussion
This deficiency in differentiating the comparable fricatives and affricates in English and Mandarin may derive from the inability to distinguish these phonemes auditorily. Since English learners sensed no difference, they spontaneously replaced such phonemes with their similar counterparts in Mandarin. To improve the situation, Chinese English learners may listen more carefully to the audio of native English speakers and acquire the pronunciations from articulation places and articulatory matters with the help of professional linguistics.
The similarity between comparable phonemes in English and Mandarin may be crucial for Chinese English learners. Exploring the differences and testing students’ ability to differentiate is one of the steps of concurring the difficulties brought by it.
Previous studies on fricatives and affricatives most focus on monolingual speakers’ productions but neglect the ones of second language learners. The results from this paper can remind Chinese English learners and Chinese English teachers to pay more attention to the pronunciation of fricative and affricates in English. Therefore, improve the ability to differentiate them from their counterparts in Mandarin.
The sample size of the current study is limited. Future studies could enlarge the number of participants and stimuli to obtain a more precise result. In addition, only four acoustic characteristics are involved in this study. More relative features could be involved in the following studies.
5. Conclusion
Based on a series of results and discussions, some conclusions with more generality and universality are drawn. The acoustic measurements extracted and the Euclidean distances calculated followed. The hypothesis of this paper can be proved that the similarity of comparable phonemes in English and Mandarin affects Chinese English learners’ acquisition of them. Moreover, the effect is negative. Last, gender also affects the ability to differentiate the comparable phonemes. The results of this research can help Chinese English students and teachers better learn and teach English as a second language. Last but not least, the limitation of this research is also analyzed.
References
[1]. Wang Y.J.(2003) The basic methods and ideas of second language speech acquisition research. Chinese Language Learning (02),61-66.
[2]. Zhai H.H. & Zhao J.L.(2015)A review of the influence of Chinese dialects on English phonetic acquisition. Foreign Language World (01),88-95.
[3]. Svantesson L. (1986)Acoustic analysis of Chinese fricatives and affricates. Journal of Chinese Linguistics.14;53-70.
[4]. Ran Qibin & Shi Feng. (2012)On fricative pattern in Beijing Mandarin. TCSOL Studies. 45(1): 67-72. (in Chinese).
[5]. Bao Yin. (2014) Research on modern Mongolian Harqin dialect fricative spectrum’s focus. Manchu Studies. 58(1): 75-78. (in Chinese).
[6]. Sun Ruixin. (2011) A study of the fricative quality based on spectral principal components. Acta Acoustica. 36(4): 427-434. (in Chinese).
[7]. Jongman, Allard & Wayland, Ratree & Wong, Serena. (2000)Acoustic characteristics of English fricatives. The Journal of the Acoustical Society of America. 108. 1252-63. 10.1121/1.1288413.
[8]. Maniwa, Kazumi & Jongman, Allard & Wade, Travis. (2009) Acoustic characteristics of clearly spoken English fricatives. The Journal of the Acoustical Society of America. 125. 3962-73. 10.1121/1.2990715.
[9]. Lee, C.Y., Zhang, Y., Li, X. (2014)Acoustic characteristics of voiceless fricatives in Mandarin Chinese. Journal of Chinese Linguistics, 42(1), 150–171. http://www.jstor.org/stable/23753944.
[10]. Lee, Shanpeng& Gu, Wentao. (2016)Acoustic characteristics of Mandarin Chinese affricates. Journal of Tsinghua Univ (Sci & Technol), 2016, Vol.56, No.11.Doi: 10.16511/j.cnki.qhdxxb.2016.26.012.
Cite this article
Geng,T. (2023). A Study on Fricatives and Affricates Produced by Chinese English Learners. Communications in Humanities Research,13,305-312.
Data availability
The datasets used and/or analyzed during the current study will be available from the authors upon reasonable request.
Disclaimer/Publisher's Note
The statements, opinions and data contained in all publications are solely those of the individual author(s) and contributor(s) and not of EWA Publishing and/or the editor(s). EWA Publishing and/or the editor(s) disclaim responsibility for any injury to people or property resulting from any ideas, methods, instructions or products referred to in the content.
About volume
Volume title: Proceedings of the International Conference on Global Politics and Socio-Humanities
© 2024 by the author(s). Licensee EWA Publishing, Oxford, UK. This article is an open access article distributed under the terms and
conditions of the Creative Commons Attribution (CC BY) license. Authors who
publish this series agree to the following terms:
1. Authors retain copyright and grant the series right of first publication with the work simultaneously licensed under a Creative Commons
Attribution License that allows others to share the work with an acknowledgment of the work's authorship and initial publication in this
series.
2. Authors are able to enter into separate, additional contractual arrangements for the non-exclusive distribution of the series's published
version of the work (e.g., post it to an institutional repository or publish it in a book), with an acknowledgment of its initial
publication in this series.
3. Authors are permitted and encouraged to post their work online (e.g., in institutional repositories or on their website) prior to and
during the submission process, as it can lead to productive exchanges, as well as earlier and greater citation of published work (See
Open access policy for details).
References
[1]. Wang Y.J.(2003) The basic methods and ideas of second language speech acquisition research. Chinese Language Learning (02),61-66.
[2]. Zhai H.H. & Zhao J.L.(2015)A review of the influence of Chinese dialects on English phonetic acquisition. Foreign Language World (01),88-95.
[3]. Svantesson L. (1986)Acoustic analysis of Chinese fricatives and affricates. Journal of Chinese Linguistics.14;53-70.
[4]. Ran Qibin & Shi Feng. (2012)On fricative pattern in Beijing Mandarin. TCSOL Studies. 45(1): 67-72. (in Chinese).
[5]. Bao Yin. (2014) Research on modern Mongolian Harqin dialect fricative spectrum’s focus. Manchu Studies. 58(1): 75-78. (in Chinese).
[6]. Sun Ruixin. (2011) A study of the fricative quality based on spectral principal components. Acta Acoustica. 36(4): 427-434. (in Chinese).
[7]. Jongman, Allard & Wayland, Ratree & Wong, Serena. (2000)Acoustic characteristics of English fricatives. The Journal of the Acoustical Society of America. 108. 1252-63. 10.1121/1.1288413.
[8]. Maniwa, Kazumi & Jongman, Allard & Wade, Travis. (2009) Acoustic characteristics of clearly spoken English fricatives. The Journal of the Acoustical Society of America. 125. 3962-73. 10.1121/1.2990715.
[9]. Lee, C.Y., Zhang, Y., Li, X. (2014)Acoustic characteristics of voiceless fricatives in Mandarin Chinese. Journal of Chinese Linguistics, 42(1), 150–171. http://www.jstor.org/stable/23753944.
[10]. Lee, Shanpeng& Gu, Wentao. (2016)Acoustic characteristics of Mandarin Chinese affricates. Journal of Tsinghua Univ (Sci & Technol), 2016, Vol.56, No.11.Doi: 10.16511/j.cnki.qhdxxb.2016.26.012.