


1 Introduction
Cutting-edge technologies are rapidly transforming society and human life. In recent years, the proliferation of online technologies has supported individuals across various sectors, including public transportation, travel, gaming, and education. This technological progress has expanded accommodation options for travelers, making private home rentals increasingly popular compared to traditional hotels. Airbnb, one of the most prominent lodging marketplaces, is used by thousands of travelers and customers worldwide each year. It bridges the gap between property owners and renters by providing a platform that facilitates the search for suitable accommodations through both a website and a mobile application. Moreover, Airbnb helps hosts connect with the right customers to rent their properties.
Founded in 2008 by Brian Chesky, Nathan Blecharczyk, and Joe Gebbia in San Francisco, Airbnb now operates in 191 countries, managing over 3,000,000 listings in 65,000 cities. Its online platform offers detailed information about hosts and properties, including reviews, which assist renters in making informed decisions and avoiding unsuitable rentals [1].
Research focusing on the Airbnb platform is crucial for governments to develop effective policies. Such studies are also significant for renters, hosts, and Airbnb itself for platform enhancement. For instance, Shabrina, Arcaute, and Batty [2] examined the relationship between Airbnb misuse and housing features, providing indicators to explore Airbnb's impact on London's housing market. Their findings indicated that misuse could lead to increased rental prices in specific areas, highlighting the applicability of machine learning methods in analyzing Airbnb data. Additionally, Li, Liao, and Gao [3] utilized unsupervised learning methods to classify Airbnb listings, exploring operational patterns of hosts. Sigala [4] applied Porter’s value chain model to classify Airbnb services, investigating their influence on the renting experience.
This study focuses on data from the Inside Airbnb website. By employing clustering methods like K-Means Clustering and Principal Component Analysis, the research explores the relationship between Airbnb house prices and potential influencing factors in London, providing a classification of Airbnb services and visualizations on a map.
2 Literature review
Please follow these instructions as carefully as possible so all articles within a conference have the same style to the title page. This paragraph follows a section title so it should not be indented.
2.1 Machine learning in Airbnb data analysis
Airbnb has become a focal point for researchers aiming to understand the dynamics of the sharing economy and its impact on urban housing markets. Shabrina, Arcaute, and Batty nvestigated the misuse of Airbnb listings in London and its correlation with housing prices. Their study demonstrated that inappropriate usage of the platform could lead to increased rental prices in specific neighborhoods, highlighting the significance of ML methods in discerning these patterns. Similarly, Li, Liao, and Gao employed unsupervised learning techniques, specifically K-Means Clustering, to classify Airbnb listings based on various attributes. Their analysis provided insights into host behaviors and rental patterns, underscoring the utility of ML in managing and optimizing rental platforms.
Furthermore, Sigala utilized Porter’s value chain model in conjunction with ML techniques to classify Airbnb services, examining how these services influence the overall renting experience. This approach not only facilitated a deeper understanding of service quality but also informed strategies for enhancing user satisfaction on the platform. These studies collectively emphasize the pivotal role of ML in analyzing and interpreting complex Airbnb datasets, offering actionable insights for stakeholders such as hosts, renters, and policymakers.
2.2 Machine learning in smart cities
The concept of smart cities revolves around the application of advanced technologies to enhance urban living conditions, optimize resource management, and improve the overall quality of life for residents. Machine learning plays a critical role in this transformation by enabling the analysis of vast amounts of data generated within urban environments. According to Kuo [5], ML algorithms are instrumental in processing and making sense of urban data, facilitating informed decision-making in areas such as infrastructure development, environmental monitoring, and public safety.
One notable application of ML in smart cities is traffic management. Intelligent Transportation Systems (ITS) leverage ML algorithms to predict traffic patterns [6][7], optimize signal timings, delivery, infrastructure monitoring [8][9], decision making [10] and reduce congestion. For instance, Zhang et al. [11] developed a machine learning-based traffic prediction model that significantly improved the accuracy of traffic flow forecasts, thereby enhancing the efficiency of traffic management systems. Additionally, ML techniques have been employed to optimize public transportation routes and schedules, as demonstrated by Yan et al [12]., who utilized deep learning models to analyze ridership data and adjust bus routes dynamically to meet demand fluctuations.
2.3 Machine learning in urban planning
The list of authors should be indented 25 mm to match the abstract. The style for the names is initials then surname, with a comma after all but the last two names, which are separated by ‘and’. Initials should have full stops. First names in full may be used if desired. If an author has additional information to appear as a footnote, such as a permanent address or to indicate that they are the corresponding author, the footnote should be entered after the surname.
Urban planning benefits immensely from machine learning through the ability to model and predict urban growth, land use changes, and socio-economic trends. ML algorithms assist urban planners in simulating various scenarios, assessing the potential impact of development projects, and identifying optimal locations for new infrastructure. For example, Kulkarni & Vijaya [13] applied ML models to predict urban sprawl in rapidly growing cities, enabling planners to implement sustainable development strategies effectively.
Moreover, ML has been utilized to analyze spatial patterns related to housing, employment, and amenities, thereby informing zoning laws and land use policies. A study by Rey-Blanco et al [14]. employed random forest algorithms to assess the factors influencing residential property values, providing valuable insights for urban planners aiming to enhance housing affordability and accessibility. Additionally, ML-driven Geographic Information Systems (GIS) have been developed to visualize and analyze complex urban data, facilitating a more comprehensive understanding of urban dynamics [15].
2.4 Applications of principal component analysis and clustering in urban data
Principal Component Analysis (PCA) and clustering algorithms, such as K-Means, are frequently employed in urban data analysis to reduce dimensionality and identify distinct patterns within complex datasets. PCA transforms high-dimensional data into a lower-dimensional space, preserving the most significant variance components, which simplifies subsequent analysis. K-Means clustering, on the other hand, groups data points into clusters based on their similarity, revealing inherent structures within the data.
In the context of Airbnb data analysis, PCA and K-Means clustering facilitate the identification of key factors influencing rental prices and host behaviors. For instance, the current study employs these techniques to classify London’s Airbnb listings, uncovering patterns related to rental availability and geographical distribution. This methodological approach is supported by previous research, such as that by Petruzzi et al. [16], who utilized PCA and clustering to analyze the spatial distribution of Airbnb listings in Barcelona, revealing significant patterns in host activity and rental pricing.
The application of machine learning methods in spatial data science offers powerful tools for analyzing and interpreting complex urban datasets. In the realm of Airbnb data analysis, ML techniques like PCA and K-Means clustering provide valuable insights into rental patterns and host behaviors, informing strategies for platform optimization and urban policy-making. Beyond the scope of Airbnb, machine learning contributes significantly to the development of smart cities, enhancing transportation systems, urban planning, and overall city management. As urban environments continue to grow in complexity, the integration of advanced machine learning techniques will remain essential for fostering sustainable and efficient urban development.
3 Computational experiments
The dataset used in this study contains host information, including essential details such as host ID, host name, price, and reviews. This analysis focuses on seven primary features, along with the hosts' geographical positions (longitude and latitude).
3.1 Handling missing values and outliers
Rows with missing values are removed to ensure data integrity.
Outliers are detected and excluded using the z-score method, which identifies data points that deviate significantly from the mean as shown in figure1 and figure2.
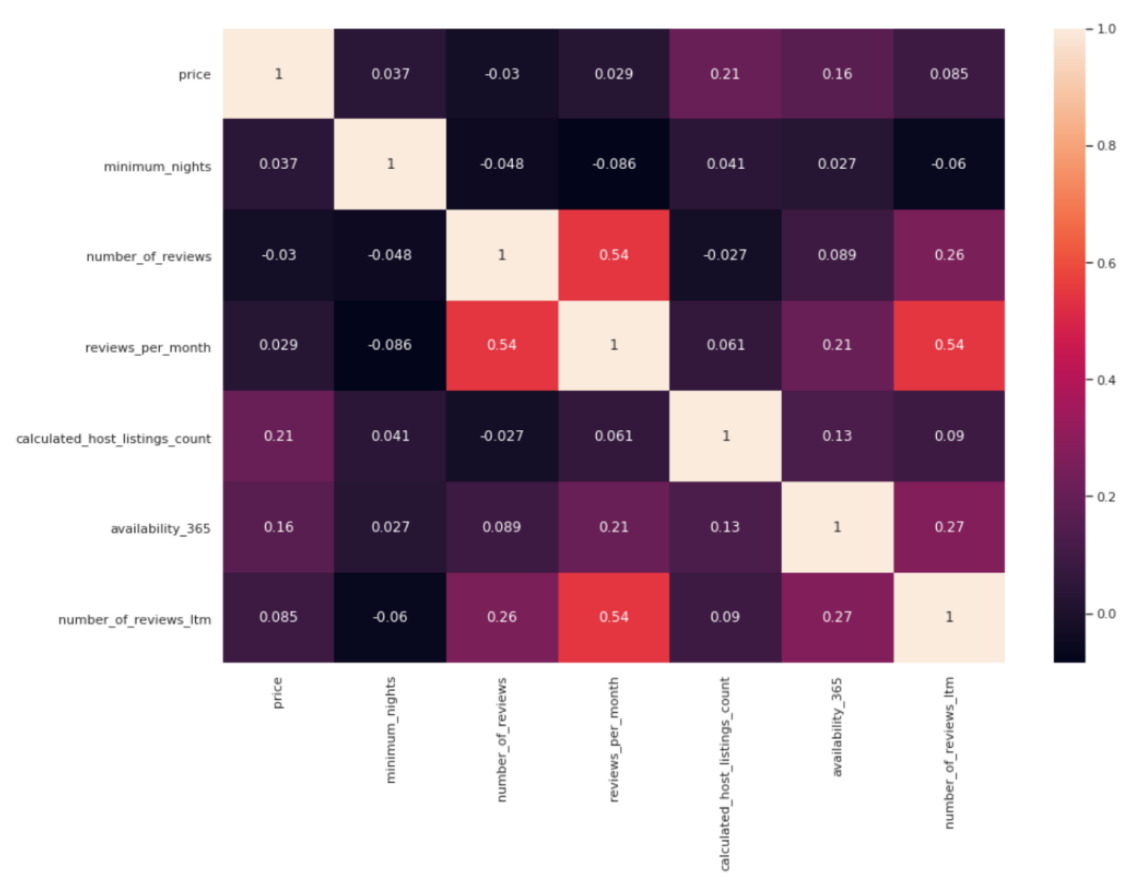
Figure 1. Correlation matrix

Figure 2. Correlation levels of features
3.2 Correlation analysis
Exploring the correlation matrix reveals no highly correlated features, indicating that multicollinearity is not a concern for the machine learning methods employed. Figure 3 plots the correlation between each feature and price suggests that ‘calculated_host_listing_count’ is the most sensitive and relevant feature. Most features show a positive correlation with price, except for ‘number_of_reviews’ as shown in figure3.
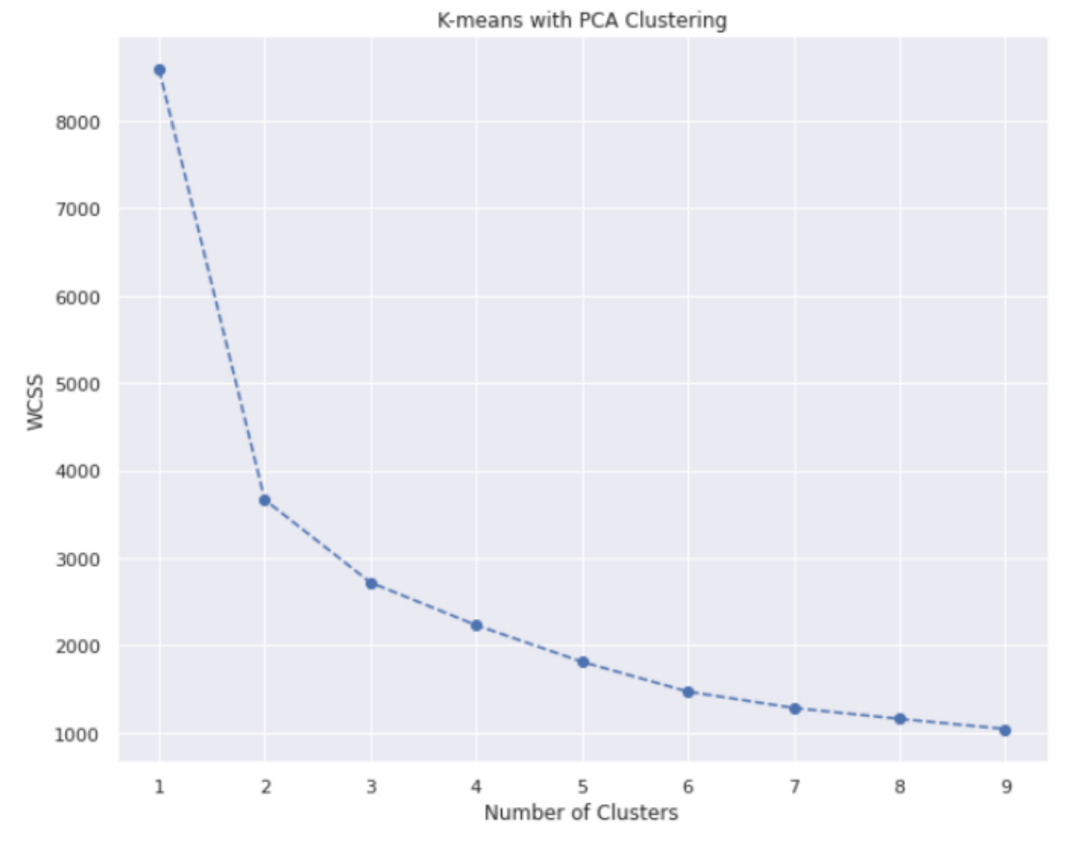
Figure 3. K-means with PCA clustering
3.3 Data normalization
Visualization of feature distributions indicates that the data are not normally distributed. To address this, Min-Max Scaling is applied to rescale the data to a range of 0 to 1. This standardizes all attributes, assigning them equal weight in the analysis.
3.4 Dimensionality reduction
Due to the high number of features, Principal Component Analysis (PCA) is utilized to reduce the dataset's dimensionality. The Elbow Method determines that three principal components are sufficient to explain over 88.6% of the variance in the original dataset, resulting in a cumulative explained variance of 0.866 as shown in figure 4.
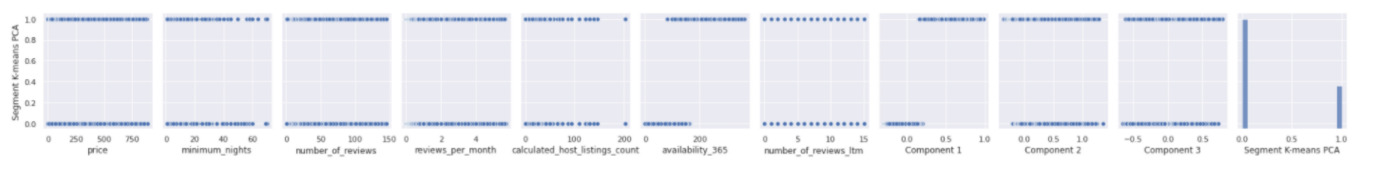
Figure 4. Pair plots
3.5 Clustering
After PCA, the optimal number of clusters for K-Means Clustering is determined using the Elbow Method, which suggests two clusters based on the trend of Within-Cluster Sum of Squares (WSCC).
The clustering model achieves a silhouette score of 0.64, indicating a reliable and reasonable classification.
Visualization in component pairs shows a clear division of the data into two highly discriminative clusters. The pair plot reveals that the clustering is primarily influenced by the 'availability' attribute, with significant differences between the two clusters. Other attributes show minimal differences as shown in figure 5 and figure 6.
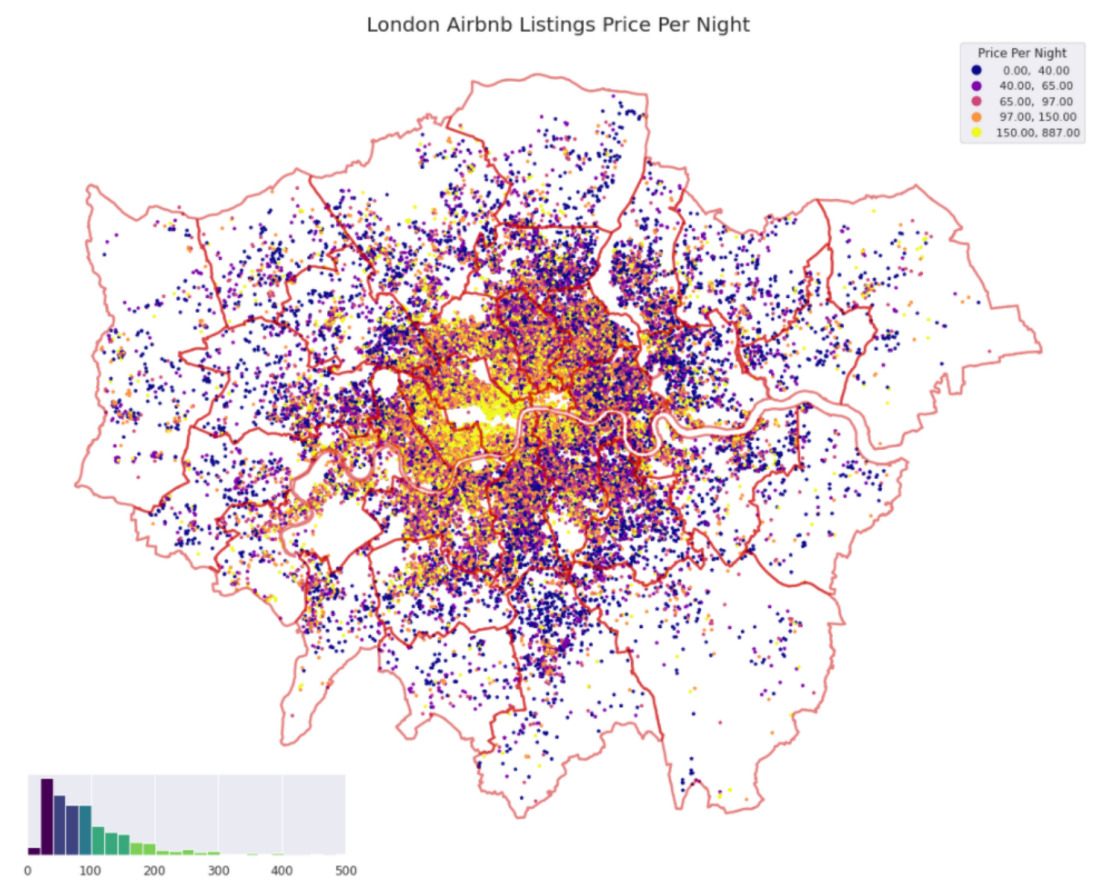
Figure 5. London Airbnb listings price per night
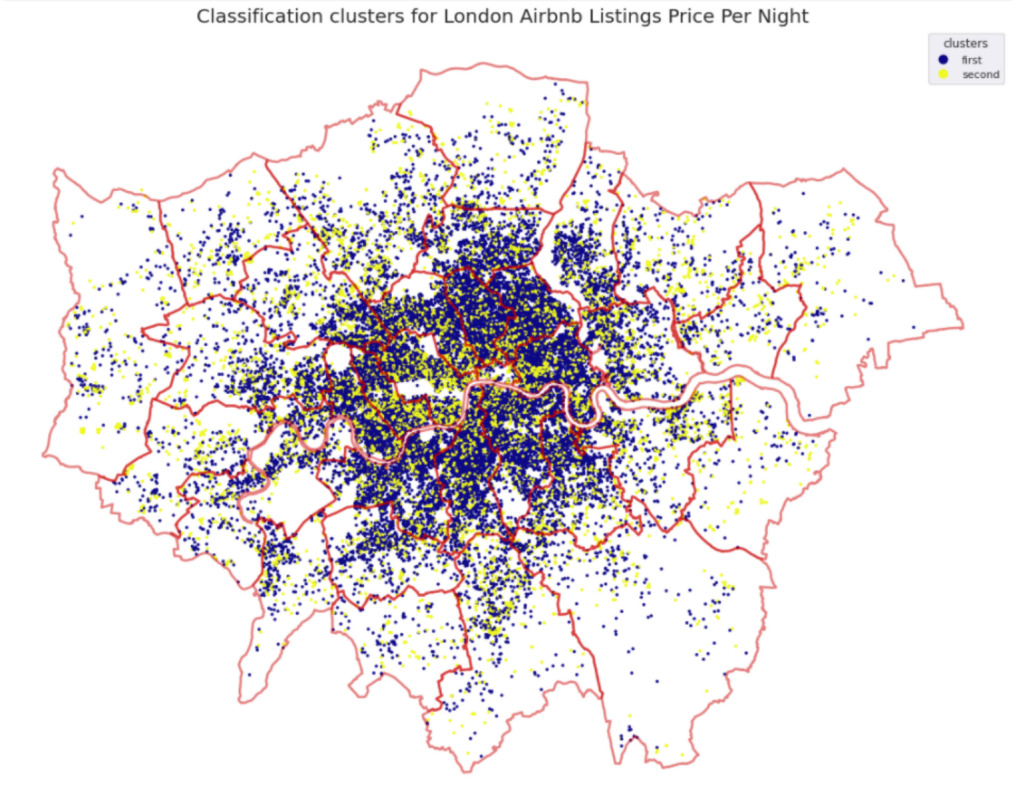
Figure 6. Classification clusters for London Airbnb listings price per night
3.6 Geospatial visualization
Mapping the distribution of Airbnb rental prices alongside the clustering results highlights that higher prices are concentrated in central areas (the City of London). As the distance from the center increases, prices generally decrease.
The first cluster, representing hosts with lower annual availability, is predominantly located in boroughs close to the City of London. The second cluster, representing hosts with higher annual availability, is mainly situated within the City of London. Both clusters show similar distributions in suburban areas.
4 Conclusion
This study successfully classifies Airbnb hosts in London into two distinct clusters through the application of K-Means Clustering and Principal Component Analysis. The clear separation of clusters, supported by a silhouette score of 0.64, indicates a reliable clustering model. The findings suggest that Airbnb rental prices tend to increase as hosts are situated closer to the central areas of London. The primary distinction between the two clusters lies in the number of available rental days per year, with other attributes having a lesser impact on the classification.
Hosts with lower availability are primarily located in mid-level areas surrounding central London, indicating a preference for short-term rentals, possibly due to transient lifestyles. In contrast, hosts in the city center are more inclined towards long-term rentals (over six months), suggesting a focus on maximizing rental income through more stable and extended leasing periods.
These classifications provide valuable insights for the government, enhancing the understanding of host behaviors and resident lifestyles. The geographical distribution of Airbnb house prices can inform policy development, aiding in better management and control of the housing market in London. Renters can also leverage this study to identify suitable accommodations within different areas of London.
However, the study has certain limitations. The limited relationship between potential attributes and price suggests that additional or alternative data attributes may be necessary for a more comprehensive analysis. Future research could incorporate more data sources, including textual data such as hosts’ and houses’ reviews, to enable more detailed and nuanced analyses through textual analysis. Additionally, employing other analytical methods, such as classical regression models or advanced neural network models, could further explore and elucidate the relationships between unique attributes and Airbnb rental prices.
References
[1]. En.wikipedia.org. 2021. Airbnb - Wikipedia. [online] Available at: https://en.wikipedia.org/wiki/Airbnb.
[2]. Shabrina, Z., Arcaute, E. and Batty, M., (2021). Airbnb and its potential impact on the London housing market. Urban Studies, [online] 59(1), pp.197-221. Available at: https://journals.sagepub.com/doi/pdf/10.1177/0042098020970865.
[3]. Li, X., Liao, J. and Gao, T., (2021). Airbnb (Air Bed and Breakfast) Listing Analysis Through Machine Learning Techniques. Biomedical and Business Applications Using Artificial Neural Networks and Machine Learning, [online] 5-7, pp.209-232.
[4]. Sigala, M., (2017). Market Formation in the Sharing Economy: Findings and Implications from the Sub-economies of Airbnb. Social Dynamics in a Systems Perspective, [online] 4-9, pp.159-174. Available at: https://link.springer.com/chapter/10.1007/978-3-319-61967-5_9.
[5]. Kuo, Y. H., Leung, J. M., & Yan, Y. (2023). Public transport for smart cities: Recent innovations and future challenges. European Journal of Operational Research, 306(3), 1001-1026.
[6]. Liu, T., & Meidani, H. (2024). End-to-end heterogeneous graph neural networks for traffic assignment. Transportation Research Part C: Emerging Technologies, 165, 104695.
[7]. Liu, T., & Meidani, H. (2024). Graph Neural Network Surrogate for Seismic Reliability Analysis of Highway Bridge Systems. Journal of Infrastructure Systems, 30(4), 05024004.
[8]. Liu, T., & Meidani, H. (2024). Heterogeneous Graph Sequence Neural Networks for Dynamic Traffic Assignment. arXiv preprint arXiv:2408.04131.
[9]. Liu, T., & Meidani, H. (2024). Neural network surrogate models for aerodynamic analysis in truck platoons: Implications on autonomous freight delivery. International Journal of Transportation Science and Technology.
[10]. Liu, T., & Meidani, H. (2023).Optimizing seismic retrofit of bridges: integrating efficient graph neural network surrogates and transportation equity. Proceedings of Cyber-Physical Systems and Internet of Things Week 2023, 367-372.
[11]. Zhang, J., Zheng, Y., & Qi, D. (2017, February). Deep spatio-temporal residual networks for citywide crowd flows prediction. In Proceedings of the AAAI conference on artificial intelligence (Vol. 31, No. 1).
[12]. Yan, Y., Cui, S., Liu, J., Zhao, Y., Zhou, B., & Kuo, Y. H. (2024). Multimodal fusion for large-scale traffic prediction with heterogeneous retentive networks. Information Fusion, 102695.
[13]. Kulkarni, K., & Vijaya, P. A. (2022). Measuring urban sprawl using machine learning. Fundamentals and methods of machine and deep learning: algorithms, tools and applications, 327-340.
[14]. Rey-Blanco, D., Zofío, J. L., & González-Arias, J. (2024). Improving hedonic housing price models by integrating optimal accessibility indices into regression and random forest analyses. Expert Systems with Applications, 235, 121059.
[15]. Goodchild, M. F., & Janelle, D. G. (2010). Spatially Integrated Social Science. Oxford University Press.
[16]. Petruzzi, M. A., Marques, G. S., do Carmo, M., & Correia, A. (2020). Airbnb and neighbourhoods: an exploratory study. International Journal of Tourism Cities, 6(1), 72-89.
Cite this article
Che,C.;Tian,J. (2024). Analyzing patterns in Airbnb listing prices and their classification in London through geospatial distribution analysis. Advances in Engineering Innovation,12,53-59.
Data availability
The datasets used and/or analyzed during the current study will be available from the authors upon reasonable request.
Disclaimer/Publisher's Note
The statements, opinions and data contained in all publications are solely those of the individual author(s) and contributor(s) and not of EWA Publishing and/or the editor(s). EWA Publishing and/or the editor(s) disclaim responsibility for any injury to people or property resulting from any ideas, methods, instructions or products referred to in the content.
About volume
Journal:Advances in Engineering Innovation
© 2024 by the author(s). Licensee EWA Publishing, Oxford, UK. This article is an open access article distributed under the terms and
conditions of the Creative Commons Attribution (CC BY) license. Authors who
publish this series agree to the following terms:
1. Authors retain copyright and grant the series right of first publication with the work simultaneously licensed under a Creative Commons
Attribution License that allows others to share the work with an acknowledgment of the work's authorship and initial publication in this
series.
2. Authors are able to enter into separate, additional contractual arrangements for the non-exclusive distribution of the series's published
version of the work (e.g., post it to an institutional repository or publish it in a book), with an acknowledgment of its initial
publication in this series.
3. Authors are permitted and encouraged to post their work online (e.g., in institutional repositories or on their website) prior to and
during the submission process, as it can lead to productive exchanges, as well as earlier and greater citation of published work (See
Open access policy for details).
References
[1]. En.wikipedia.org. 2021. Airbnb - Wikipedia. [online] Available at: https://en.wikipedia.org/wiki/Airbnb.
[2]. Shabrina, Z., Arcaute, E. and Batty, M., (2021). Airbnb and its potential impact on the London housing market. Urban Studies, [online] 59(1), pp.197-221. Available at: https://journals.sagepub.com/doi/pdf/10.1177/0042098020970865.
[3]. Li, X., Liao, J. and Gao, T., (2021). Airbnb (Air Bed and Breakfast) Listing Analysis Through Machine Learning Techniques. Biomedical and Business Applications Using Artificial Neural Networks and Machine Learning, [online] 5-7, pp.209-232.
[4]. Sigala, M., (2017). Market Formation in the Sharing Economy: Findings and Implications from the Sub-economies of Airbnb. Social Dynamics in a Systems Perspective, [online] 4-9, pp.159-174. Available at: https://link.springer.com/chapter/10.1007/978-3-319-61967-5_9.
[5]. Kuo, Y. H., Leung, J. M., & Yan, Y. (2023). Public transport for smart cities: Recent innovations and future challenges. European Journal of Operational Research, 306(3), 1001-1026.
[6]. Liu, T., & Meidani, H. (2024). End-to-end heterogeneous graph neural networks for traffic assignment. Transportation Research Part C: Emerging Technologies, 165, 104695.
[7]. Liu, T., & Meidani, H. (2024). Graph Neural Network Surrogate for Seismic Reliability Analysis of Highway Bridge Systems. Journal of Infrastructure Systems, 30(4), 05024004.
[8]. Liu, T., & Meidani, H. (2024). Heterogeneous Graph Sequence Neural Networks for Dynamic Traffic Assignment. arXiv preprint arXiv:2408.04131.
[9]. Liu, T., & Meidani, H. (2024). Neural network surrogate models for aerodynamic analysis in truck platoons: Implications on autonomous freight delivery. International Journal of Transportation Science and Technology.
[10]. Liu, T., & Meidani, H. (2023).Optimizing seismic retrofit of bridges: integrating efficient graph neural network surrogates and transportation equity. Proceedings of Cyber-Physical Systems and Internet of Things Week 2023, 367-372.
[11]. Zhang, J., Zheng, Y., & Qi, D. (2017, February). Deep spatio-temporal residual networks for citywide crowd flows prediction. In Proceedings of the AAAI conference on artificial intelligence (Vol. 31, No. 1).
[12]. Yan, Y., Cui, S., Liu, J., Zhao, Y., Zhou, B., & Kuo, Y. H. (2024). Multimodal fusion for large-scale traffic prediction with heterogeneous retentive networks. Information Fusion, 102695.
[13]. Kulkarni, K., & Vijaya, P. A. (2022). Measuring urban sprawl using machine learning. Fundamentals and methods of machine and deep learning: algorithms, tools and applications, 327-340.
[14]. Rey-Blanco, D., Zofío, J. L., & González-Arias, J. (2024). Improving hedonic housing price models by integrating optimal accessibility indices into regression and random forest analyses. Expert Systems with Applications, 235, 121059.
[15]. Goodchild, M. F., & Janelle, D. G. (2010). Spatially Integrated Social Science. Oxford University Press.
[16]. Petruzzi, M. A., Marques, G. S., do Carmo, M., & Correia, A. (2020). Airbnb and neighbourhoods: an exploratory study. International Journal of Tourism Cities, 6(1), 72-89.