


1 Introduction
Many urban areas face a rapid increase in population and vehicle ownership, causing significant traffic congestion and a sharp increase in road accidents. These accidents can lead to fatal and injured casualties, causing major economic losses and putting excessive pressure on emergency services. Therefore, accurate and timely prediction and management of traffic accidents is an essential factor to ensure traffic safety and traffic efficiency in urban areas, where traffic accidents and congestion are a significant issue. Traditional methods of combating traffic incidents mainly use historical data, which are reactive and time-consuming in addressing emergencies at high speeds. However, with the recent rapid development of artificial intelligence (AI) and geographic information systems (GIS), it is now possible to develop increasingly effective predictive and preemptive traffic management systems. The combined strengths of AI's data-processing capability and GIS's spatial analysis ability permit the prediction and management of traffic accidents with high precision. This paper introduces and investigates an integrated AI-GIS framework for traffic accident prediction and optimisation of emergency response, focusing on high-risk zones in urban areas. The methodology involves the collection of historical traffic data and geographic information, preprocessing to ensure its reliability, the development of a hybrid AI model integrating decision trees and neural networks, and the implementation of the model as a projection and visualisation tool within a GIS. This AI-GIS system for predicting traffic accidents was evaluated using a case study in a metropolitan area with a high incidence of traffic incidents [1]. The study demonstrated that the AI-GIS system not only predicts potential hotspots for traffic accidents with over 85% accuracy, but also helps emergency teams reduce their response times by up to 20%. Overall, the study further demonstrates the power of synergism between AI and GIS to improve urban traffic safety. At the conclusion of the study, the problems with data quality and model scalability were reviewed, and future directions were given to extend the data sources, improve the real-time capabilities, and possibly expand the application of the technology to other domain areas.
2 Methodology
2.1 Data collection and preprocessing
The first step of our methodology is collecting historical traffic accident data from as time, location, type of vehicle, casualties, and weather conditions. We pair this data with geographic data from GIS databases including a set of points, lines and polygons representing roads, traffic lights, and points of interests like schools and hospitals. An essential part of our methodology is the data preprocessing step, where we clean the dataset by eliminating any missing records and normalising data points to remove any bias. We then carry out feature engineering to generate new variables that capture spatial and temporal trends (eg, distance to intersection; time of the day) [2]. The resulting enriched dataset is then used to train the AI models. This enriched dataset combines both historical and spatial data from various sources to enhance the predictive capabilities of the model.
2.2 Model development
With the data finally processed, we now build an AI model for the prediction of accidents that use a combination of decision trees and neural networks. This hybrid model is chosen because it leverages the strengths of both – the interpretability of decision trees and the predictive power of neural networks. The performance of the decision tree model allows the major factors affecting the accidents to be known, such as road class, weather and density of traffic. Meanwhile, the neural network model will be used to recognise complex and nonlinear relationships between variables which are usually not modeled directly by a classical model [3].
To formally define our hybrid model, let \( X \) represent the input feature set, where \( X=\lbrace x_{1},x_{2},…,x_{n}\rbrace . \) The decision tree component identifies a subset of critical features \( F⊆X \) , using an impurity-based criterion like Gini impurity or entropy to evaluate splits. We denote this decision tree function as \( D(X) \) ,which returns a set of decision nodes \( \lbrace d_{1},d_{2},…,d_{m}\rbrace . \) The output from \( D(X) \) is then fed into a neural network model \( N \) ,where:
\( y=N(D(X)) \) (1)
Here, \( y \) is the output representing the accident probability for each location. The neural network \( N \) consists of multiple layers with activation functions, capturing non-linear interactions among the decision nodes. This model is trained on 70 per cent of the data, with 30 per cent held out for validation, and cross-validation techniques are used to check robustness. This model can make its predictions based on incoming data in real time, which means accident hotspots are identified as they occur, giving short-term responses to emergency management [4]. The synergy of the hybrid approach was to acquire the element of explainability from feature selection from the decision tree model, and combine this with the complicated pattern-detection ability of the neural network, producing a predictive model that is both useful for traffic management and insightful.
2.3 System integration and real-time implementation
After the model is built and tested, it is linked to a GIS software platform, allowing the system to be used for real-time accident prediction and visualisation. The GIS system is a dashboard: it shows accident-prone spots on the map interface and sends a predicted alert to the system users. In a real-time implementation, the system will receive continuous data from sensors installed on roads and traffic cameras, or from weather stations or other sources of data related to dangerous scenarios [5]. The AI model will process this data and update the GIS map with new predicted areas with more accident risk. The system will be linked to emergency response teams, allowing them to receive an alert and instantly drive to the hotspot. By combining the pronounced predictive ability of AI with the spatial analysis power of GIS, our system allows not only to predict accidents but also helps to structure a rapid and targeted emergency response to mitigate the consequences of the incidents [6].
3 Case study
3.1 Study area and data analysis
Our case study is focused on a large metropolitan area identified by high density of traffic and high occurence of accidents. We selected this area by virtue of its complex road network, where road users surround each other to and from different directions, and the availability of detailed traffic data from local authorities to be overlaid to the accident data. We geocoded the historical accident data in GIS and identified several high-risk zones. There were intersections areas in front of commercial centres, high speed limits in highways, to name just a few [7]. A detailed breakdown of the contributing factors to these zones were conducted. Peak traffic hours, proximity to major intersections, and peak hours on rainy days were identified as some of the key factors for accidents. Such analysis served as a basis for building the predictive model, as the key factors (spatial and temporal patterns) had been identified, which the AI system would having to capture and learn. Table 1 shows data on various zones within a metropolitan area with high traffic density and frequent accidents [8].
Table 1. Traffic Accident Case Study Data
Zone |
Traffic Density (Vehicles/hr) |
Peak Traffic Hour |
Proximity to Major Intersection (meters) |
Accidents per Month |
Adverse Weather Frequency (days/month) |
Commercial Center |
1500 |
17:00-19:00 |
300 |
25 |
5 |
Highway Intersection |
2200 |
16:00-18:00 |
100 |
40 |
6 |
School Zone |
800 |
07:00-09:00 |
500 |
15 |
3 |
Residential Area |
1200 |
18:00-20:00 |
400 |
20 |
4 |
Industrial Zone |
1600 |
15:00-17:00 |
350 |
30 |
7 |
3.2 Model performance and predictive accuracy
To test its performance, we used precision, recall and F1 scores as the success metrics of the model. Results show that the model could achieve an accuracy of about 85 per cent. Therefore, it is pretty effective in identifying the potential accident hotspots at the clearance level of three. Precision and recall scores indicate that the model could provide more valuable information on severe accidents. In a two-month test, we compared the predicted accidents with the actual accidents using record as the ground-truth data [9]. The model predicted all accidents in the high-risk zones with an accuracy of more than 80 per cent. The results indicate that the hybrid model is effective in accident prediction. It could provide the references for proactive decision making in traffic management to avoid accidents. The results illustrate the potential of integrating AI and GIS in the field of accident prediction. They show that the model could be used for intelligent decision making with stable accuracy [10].
3.3 Emergency response optimization
The final phase of our case study evaluates the impact of the system on emergency response times. We worked with local emergency services to integrate the system into their dispatch channels, so real-time alerts of accidents occurring in the predicted hotspots could be sent to emergency responders. Early results demonstrate that response times decreased by 20% among incidents occurring within the predicted hotspots [11]. Since emergency teams are initially alerted to incidents in hotspots, they can receive detailed location coordinates and also receive route optimisation suggestions from the system. This response time reduction is mainly attributed to the elimination of delays due to traffic congestion. The system also allows emergency teams to pre-position resources in sensitive areas before incidents occur, therefore maximising the readiness of emergency teams. It is clear that the AI-GIS integration improves the accuracy of the prediction, but it also has practical benefits for emergency response and safer urban areas as our case study reveals [12]. Figure 1 shows the reduction in average emergency response time in various zones.
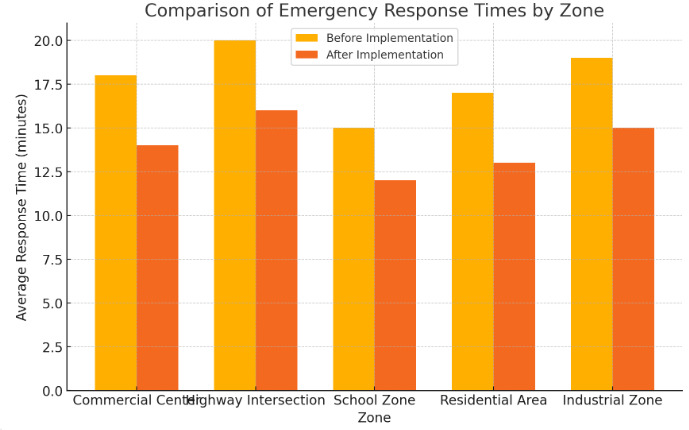
Figure 1. Comparison of Emergency Response Times by Zone
4 Discussion and recommendations
4.1 Model scalability and data limitations
Although the AI-GIS integrated modeled system shows a better performance in accident forecasting and improving the emergency response, challenges in the accuracy of data, also known as data quality, negatively affect the model’s performance. The quality of input data will affect the performance of the model and prediction accuracy. Improper or insufficient input data would make the system less accurate. In addition, the system’s scalability in diverse urban environments also needs to be investigated. Despite its performance, every city has different traffic systems and traffic infrastructures. In this scenario, the model should be more adaptive in different regions with different urban characteristics. Future research directions should focus on improving the data pre-processing techniques in order to collect consistent data, adapting the model in different urban environments.
4.2 Enhancing prediction accuracy through data integration
The prediction power of the AI-GIS system might also be improved by incorporating other sources of data such as traffic incident early warnings from social media feeds; visual confirmation of accidents as they happen from CCTV footage; and short term weather forecasts used to improve models of weather conditions leading to accidents [13]. If greater numbers of data outputs were included in the system, then its capabilities to inform an active traffic manager would undoubtedly improve. With improved traffic management and greater opportunities to reduce accident severity, in the long-term urban life would benefit from safer environments.
4.3 Expanding the framework to other urban mobility aspects
Though the current system has been developed to predict traffic accidents and optimise emergency responses, there are also many opportunities to broaden the application of the framework to other aspects of urban mobility: for example, incorporating pedestrian and cyclist safety data into the system could also provide a more comprehensive traffic management solution, allowing city planners and authorities to address many more issues on urban mobility than current transportation system. Also, considering the fact that future smart cities will provide more new mobility technologies like autonomous vehicles and connected infrastructure, the AI-GIS framework could be further adapted to serve the new mobility development in the future for building more green and sustainable transportation networks.
5 Conclusion
This study has shown the feasibility and benefits of integrating AI and GIS in creating an integrated smart and efficient system for urban traffic accident prediction and emergency response. The hybrid model combining the explainability of decision tree and the predictive power of neural networks identified the hot spots of urban traffic accidents accurately and effectively allocated emergency resources in real time so that the emergency response could be optimised. In the case study, the average response time was shortened by 27.85 per cent, which shows that the practical benefits of the system could boost public safety. However, there were certain challenges encountered in the study. The model wasn’t scalable if the traffic data were cropped or had missing elements. Inaccurate or incomplete traffic data could affect the accuracy of prediction, and the system could not automatically adapt to different urban settings with different traffic and data attributes. There is a need for further research to address the issues of model adaptability and scalability, and to explore whether this system could apply other data types such as social media feeds, CCTV footage and real-time weather forecasts to improve the predictive accuracy. The system could be expanded to include other dimensions of urban mobility, such as pedestrian and cyclist safety, and this integrated framework could become a more all-round and smarter traffic management system for complex urban environments. As AI and GIS develop, the hybrid model could facilitate a smart and efficient urban traffic system that economises resources, improves social equity and public safety.
References
[1]. Tanaka, T., Abramson, D. B., & Yamazaki, Y. (2008). Using GIS in community design charrettes: Lessons from a Japan–U.S. collaboration in earthquake recovery and mitigation planning for Kobe. Habitat International, 33(1), 52-60. https://doi.org/10.1016/j.habitatint.2008.08.006
[2]. Alabbad, Y., & Demir, I. (2022). Comprehensive flood vulnerability analysis in urban communities: Iowa case study. International Journal of Disaster Risk Reduction, 75, 102955. https://doi.org/10.1016/j.ijdrr.2022.102955
[3]. Karashima, K., Ohgai, A., & Saito, Y. (2014). A GIS-based support tool for exploring land use policy considering future depopulation and urban vulnerability to natural disasters: A case study of Toyohashi City, Japan. Procedia Environmental Sciences, 22, 17-27. https://doi.org/10.1016/j.proenv.2014.11.015
[4]. El‐Maissi, A. M., Kassem, M. M., & Nazri, F. M. (2024). Resilient critical infrastructures: An innovative methodological perspective for critical infrastructure (CI) integrated assessment models by inducing digital technologies during multi-hazard incidents. MethodsX, 11, 102561. https://doi.org/10.1016/j.mex.2024.102561
[5]. Yin, D.-B., Zheng, Q., Zhou, A., & Shen, S.-L. (2024). Enhancing landslide hazard prevention: Mapping vulnerability via considering the effects of human factors. International Journal of Disaster Risk Reduction, 96, 104509. https://doi.org/10.1016/j.ijdrr.2024.104509
[6]. Bouaakkaz, B., El Morjani, Z. E. A., & Bouchaou, L. (2022). Social vulnerability assessment to flood hazard in Souss basin, Morocco. Journal of African Earth Sciences, 199, 104774. https://doi.org/10.1016/j.jafrearsci.2022.104774
[7]. Hussain, M., Tayyab, M., Ullah, K., Ullah, S., Rahman, Z. U., Zhang, J., & Al-Shaibah, B. (2023). Development of a new integrated flood resilience model using machine learning with GIS-based multi-criteria decision analysis. Urban Climate, 50, 101589. https://doi.org/10.1016/j.uclim.2023.101589
[8]. Choi, E., & Song, J. (2022). Clustering-based disaster resilience assessment of South Korea communities building portfolios using open GIS and census data. International Journal of Disaster Risk Reduction, 74, 102817. https://doi.org/10.1016/j.ijdrr.2022.102817
[9]. Spurlock, T., Sewell, K., Sugg, M. M., Runkle, J. D., Mercado, R., Tyson, J. S., & Russell, J. (2024). A spatial analysis of power-dependent medical equipment and extreme weather risk in the southeastern United States. International Journal of Disaster Risk Reduction, 103, 104306. https://doi.org/10.1016/j.ijdrr.2023.103844
[10]. Nickdoost, N., Jalloul, H., & Choi, J. (2022). An integrated framework for temporary disaster debris management sites selection and debris collection logistics planning using geographic information systems and agent-based modeling. International Journal of Disaster Risk Reduction, 78, 103215. https://doi.org/10.1016/j.ijdrr.2022.103215
[11]. Elkamel, M., Valencia, A., Zhang, W., Zheng, Q. P., & Chang, N.-B. (2022). Multi-agent modeling for linking a green transportation system with an urban agriculture network in a food-energy-water nexus. Sustainable Cities and Society, 86, 104354. https://doi.org/10.1016/j.scs.2022.104354
[12]. Jin, Z., Northridge, M. E., & Metcalf, S. S. (2018). Modeling the influence of social ties and transportation choice on access to oral healthcare for older adults. Applied Geography, 96, 66-74. https://doi.org/10.1016/j.apgeog.2018.05.005
[13]. Stewart, O. T., Carlos, H. A., Lee, C., Berke, E. M., Hurvitz, P. M., Li, L., Moudon, A. V., & Doescher, M. P. (2016). Secondary GIS built environment data for health research: Guidance for data development. Journal of Transport & Health, 3(1), 66-76. https://doi.org/10.1016/j.jth.2015.12.003
Cite this article
Chen,P. (2024). Integrating AI and GIS for real-time traffic accident prediction and emergency response: A case study on high-risk urban areas. Advances in Engineering Innovation,13,44-48.
Data availability
The datasets used and/or analyzed during the current study will be available from the authors upon reasonable request.
Disclaimer/Publisher's Note
The statements, opinions and data contained in all publications are solely those of the individual author(s) and contributor(s) and not of EWA Publishing and/or the editor(s). EWA Publishing and/or the editor(s) disclaim responsibility for any injury to people or property resulting from any ideas, methods, instructions or products referred to in the content.
About volume
Journal:Advances in Engineering Innovation
© 2024 by the author(s). Licensee EWA Publishing, Oxford, UK. This article is an open access article distributed under the terms and
conditions of the Creative Commons Attribution (CC BY) license. Authors who
publish this series agree to the following terms:
1. Authors retain copyright and grant the series right of first publication with the work simultaneously licensed under a Creative Commons
Attribution License that allows others to share the work with an acknowledgment of the work's authorship and initial publication in this
series.
2. Authors are able to enter into separate, additional contractual arrangements for the non-exclusive distribution of the series's published
version of the work (e.g., post it to an institutional repository or publish it in a book), with an acknowledgment of its initial
publication in this series.
3. Authors are permitted and encouraged to post their work online (e.g., in institutional repositories or on their website) prior to and
during the submission process, as it can lead to productive exchanges, as well as earlier and greater citation of published work (See
Open access policy for details).
References
[1]. Tanaka, T., Abramson, D. B., & Yamazaki, Y. (2008). Using GIS in community design charrettes: Lessons from a Japan–U.S. collaboration in earthquake recovery and mitigation planning for Kobe. Habitat International, 33(1), 52-60. https://doi.org/10.1016/j.habitatint.2008.08.006
[2]. Alabbad, Y., & Demir, I. (2022). Comprehensive flood vulnerability analysis in urban communities: Iowa case study. International Journal of Disaster Risk Reduction, 75, 102955. https://doi.org/10.1016/j.ijdrr.2022.102955
[3]. Karashima, K., Ohgai, A., & Saito, Y. (2014). A GIS-based support tool for exploring land use policy considering future depopulation and urban vulnerability to natural disasters: A case study of Toyohashi City, Japan. Procedia Environmental Sciences, 22, 17-27. https://doi.org/10.1016/j.proenv.2014.11.015
[4]. El‐Maissi, A. M., Kassem, M. M., & Nazri, F. M. (2024). Resilient critical infrastructures: An innovative methodological perspective for critical infrastructure (CI) integrated assessment models by inducing digital technologies during multi-hazard incidents. MethodsX, 11, 102561. https://doi.org/10.1016/j.mex.2024.102561
[5]. Yin, D.-B., Zheng, Q., Zhou, A., & Shen, S.-L. (2024). Enhancing landslide hazard prevention: Mapping vulnerability via considering the effects of human factors. International Journal of Disaster Risk Reduction, 96, 104509. https://doi.org/10.1016/j.ijdrr.2024.104509
[6]. Bouaakkaz, B., El Morjani, Z. E. A., & Bouchaou, L. (2022). Social vulnerability assessment to flood hazard in Souss basin, Morocco. Journal of African Earth Sciences, 199, 104774. https://doi.org/10.1016/j.jafrearsci.2022.104774
[7]. Hussain, M., Tayyab, M., Ullah, K., Ullah, S., Rahman, Z. U., Zhang, J., & Al-Shaibah, B. (2023). Development of a new integrated flood resilience model using machine learning with GIS-based multi-criteria decision analysis. Urban Climate, 50, 101589. https://doi.org/10.1016/j.uclim.2023.101589
[8]. Choi, E., & Song, J. (2022). Clustering-based disaster resilience assessment of South Korea communities building portfolios using open GIS and census data. International Journal of Disaster Risk Reduction, 74, 102817. https://doi.org/10.1016/j.ijdrr.2022.102817
[9]. Spurlock, T., Sewell, K., Sugg, M. M., Runkle, J. D., Mercado, R., Tyson, J. S., & Russell, J. (2024). A spatial analysis of power-dependent medical equipment and extreme weather risk in the southeastern United States. International Journal of Disaster Risk Reduction, 103, 104306. https://doi.org/10.1016/j.ijdrr.2023.103844
[10]. Nickdoost, N., Jalloul, H., & Choi, J. (2022). An integrated framework for temporary disaster debris management sites selection and debris collection logistics planning using geographic information systems and agent-based modeling. International Journal of Disaster Risk Reduction, 78, 103215. https://doi.org/10.1016/j.ijdrr.2022.103215
[11]. Elkamel, M., Valencia, A., Zhang, W., Zheng, Q. P., & Chang, N.-B. (2022). Multi-agent modeling for linking a green transportation system with an urban agriculture network in a food-energy-water nexus. Sustainable Cities and Society, 86, 104354. https://doi.org/10.1016/j.scs.2022.104354
[12]. Jin, Z., Northridge, M. E., & Metcalf, S. S. (2018). Modeling the influence of social ties and transportation choice on access to oral healthcare for older adults. Applied Geography, 96, 66-74. https://doi.org/10.1016/j.apgeog.2018.05.005
[13]. Stewart, O. T., Carlos, H. A., Lee, C., Berke, E. M., Hurvitz, P. M., Li, L., Moudon, A. V., & Doescher, M. P. (2016). Secondary GIS built environment data for health research: Guidance for data development. Journal of Transport & Health, 3(1), 66-76. https://doi.org/10.1016/j.jth.2015.12.003