


1. Introduction
With the advancement of the times and the progress of society, the demand for higher accuracy and efficiency in color matching continues to grow. Traditional methods, such as manual color matching [1] and fixed color matching retrieval [2], rely heavily on the operator's experience and are easily affected by human and environmental factors, making it difficult to ensure color consistency and stability in actual production. Although computer-aided color matching methods—such as the tristimulus value method [3] and spectral matching method [4]—have improved matching efficiency and accuracy to some extent, the former is prone to metamerism, while the latter involves complex calculations and cumbersome operations, limiting their application in industrial settings. Therefore, under the demands of high-precision and large-scale production, these methods are no longer sufficient, and more intelligent and efficient techniques are required.
This study proposes an ink color matching model, CTNet, which combines Convolutional Neural Networks (CNN) [5] and Transformer models [6]. Using spectral reflectance data from object surfaces as input, the model leverages CNN's strong local feature extraction capability and the Transformer's self-attention mechanism and powerful sequence modeling ability to predict both color space and ink formulation. This approach enables the model to automatically learn the complex mapping between color and spectral reflectance, breaking away from the constraints of fixed rules in traditional formulation. It ensures high-precision color consistency in large-scale production and effectively addresses the limitations of traditional methods in complex manufacturing environments.
1.1. Dataset preparation
To construct a comprehensive and representative dataset, this experiment adheres to the international standard ISO 12642-2. Si Lian brand ink was chosen as the dye, with white paper as the printing substrate. Five types of sample combinations, ranging from single-color to four-color mixtures, were designed to comprehensively capture the spectral reflectance data of CMYK inks under different combinations, thereby enhancing the model's generalization capability in practical applications.
A total of 1,553 color patches were produced. The single-color samples include the four primary colors—cyan (C), magenta (M), yellow (Y), and black (K)—with dot area percentages varying in 5% intervals, forming a complete gradient for each base color. The two-color samples include overlapping combinations such as CM, CY, and MY, with dot area percentages varied in 10% intervals to evaluate the spectral response of two-color mixtures. The three-color samples are based on different three-color combinations, with dot area percentages varied in 15% intervals, allowing for the analysis of the characteristics of three-color overprinting. The four-color samples represent the complete CMYK combination, with dot area percentages for the C, M, and Y channels varied in 20% intervals, and the K channel in 50% intervals, fully reflecting the color interaction effects under complex four-color overprinting conditions.
Through this design, the dataset covers ink combinations ranging from simple to complex, enabling a comprehensive evaluation of color performance under various printing and dyeing scenarios. The detailed composition is shown in Table 1.
Table 1. Sample color patch combinations
Sample Type | Total |
White paper substrate | 1 |
Single-color samples | 84 |
Two-color samples | 600 |
Three-color samples | 436 |
Four-color samples | 432 |
1.2. Data collection
In this experiment, spectral measurements were conducted using the X-Rite Ci6X spectrophotometer, with parameters configured to include a small aperture, specular reflection, 100% UV, D65 light source, and specified observation angle. To ensure the standardization and consistency of the measurement results, the samples were systematically measured under controlled environmental conditions. During the measurement process, a white board, similar in color to the white paper substrate, was placed beneath the samples, and several sheets of identical white paper were used to standardize the background reflection conditions.
Considering the potential issues of uneven color distribution or localized defects on the dyed sample surfaces, measurements were taken from regions with uniform ink layer distribution and smooth surfaces. Each color patch was measured three times, and the average value was recorded to enhance the accuracy and representativeness of the data.
The spectral range collected in the experiment spanned from 400 nm to 700 nm, with sampling intervals of 10 nm. The spectral reflectance for each patch, along with the corresponding CMYK dot area percentages, was recorded and used as the foundational data for subsequent model training and performance evaluation.
1.3. Normalization process
Due to the numerical variations in spectral reflectance across different wavelengths, this study applies a min-max normalization to the spectral data to facilitate subsequent processing and model training. The normalization is performed using the following formula:
\( {x_{*}}=\frac{X-{X_{max}}}{{Xmin_{max}}} \) (1)
In the equation, \( X \) denotes the original spectral reflectance, \( {X_{min}} \) and \( { X_{max}} \) represent the minimum and maximum values of all samples at the corresponding wavelength, respectively, and \( {x_{*}} \) is the normalized data. This normalization process effectively eliminates scale differences across wavelengths, which facilitates faster model convergence and improves both model stability and prediction accuracy.
2. Model development
2.1. Construction of the CNN
Spectral reflectance, as a key physical parameter characterizing an object's color, can accurately describe its reflective properties across different wavelengths, thereby reflecting its color characteristics. As shown in Figure 1, the curves illustrate the spectral reflectance distributions of CMYK inks at 100% dot coverage on a white paper substrate.
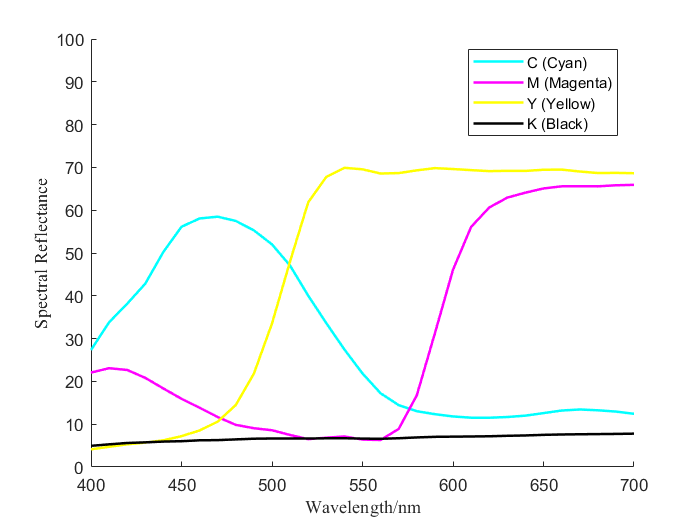
Figure 1. Spectral reflectance distribution chart
As shown in the figure, the spectral reflectance of different colors exhibits unique variation trends and reflective characteristics across different wavelength bands. Therefore, this study utilizes CNN to extract effective local features from the 31-dimensional spectral reflectance data. Each sample consists of spectral reflectance values at 31 different wavelengths, with a data shape of (batch_size, 31), where batch_size is the number of samples in each batch. CNN extracts local features from the spectral data through convolution and pooling operations and progressively captures more complex cross-band information layer by layer. To further enhance the model's expressive power, a layer-by-layer design is employed, allowing the model to capture multi-scale features at different levels.
The CNN structure includes three convolutional layers, one fully connected layer, and one pooling layer, as shown in Figure 2. The first convolutional layer performs a convolution operation on the input data using a 1D convolution kernel of size 3 to extract local features. A ReLU activation function is applied to introduce non-linearity and enhance the network's ability to process complex patterns and relationships. The second convolutional layer continues to use a convolution operation with a kernel size of 3 to extract more complex cross-band features, and applies the ReLU activation function again. This layer further reduces the dimensionality of the feature space through pooling operations, while preserving the most important feature information. The third convolutional layer uses a convolution operation with a kernel size of 3 to extract high-level features, enabling the model to capture more abstract feature representations. Finally, the output from the convolutional layers is flattened and passed into the fully connected layer, mapping the data to a 64-dimensional feature space to provide optimized feature representations for subsequent prediction tasks.
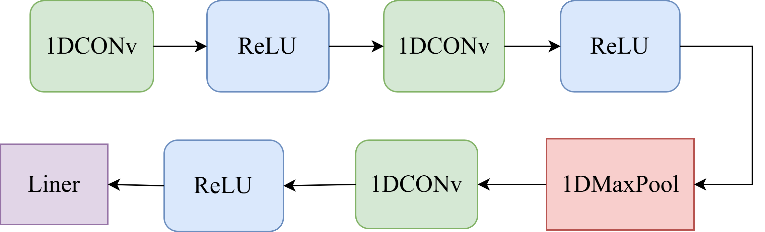
Figure 2. CNN model structure
2.2. Combination of CNN and transformer models
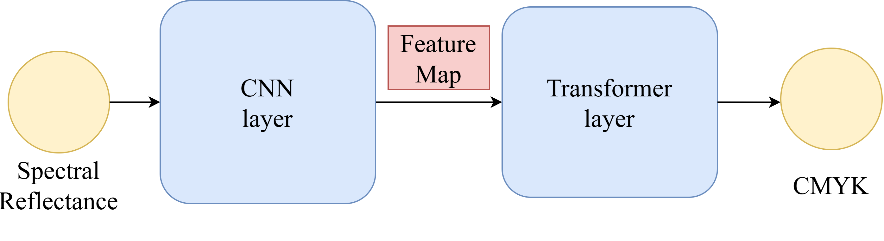
Figure 3. CNN-transformer model flowchart
The CTNet model uses CNN as the first stage to extract local features from the input spectral data, and then passes the resulting feature vectors to the Transformer structure. The Transformer captures the relationships between different wavelength bands through the self-attention mechanism and utilizes multi-head attention to explore the multi-dependencies of features across multiple subspaces, thereby obtaining a richer global feature representation. This ultimately enables an effective mapping from spectral reflectance to color space, producing the corresponding CMYK predictions. The overall model flow is illustrated in the Figure 3.
3. Results and analysis
3.1. Experimental parameters and evaluation metrics
To ensure the reliability of the results, all experiments were conducted on the same platform. The specific configuration is shown in Table 2.
Table 2. Experimental environment parameters
Parameters | Parameter Values |
GPU | MIX250 |
Processor | i5-8265U |
Hard Drive | 1TB |
Operating System | Windows10 64位 |
Memory | 16G |
Parameters | Parameter Values |
In the experiments, spectral reflectance was used as the input data and CMYK dot area percentages were used as the predicted output. 80% of the dataset was used as the training set, while the remaining 20% was used as the test set. The Adam optimizer was adopted, with a unified batch size, and an adaptive learning rate decay strategy combined with an early stopping mechanism [7] was employed to enhance the effectiveness and stability of model training.
The evaluation metric is Mean Absolute Error (MAE), which is used to measure the magnitude of the difference between the predicted values and the actual values. The calculation formula is as follows:
\( MAE=\frac{1}{N}\sum _{i=1}^{N}|{Y_{j}}-{Y_{i}}| \) (2)
Where \( {Y_{i}} \) is the actual CMYK value, \( {Y_{j}} \) is the predicted CMYK value, and \( N \) is the number of samples.
3.2. Hyperparameter optimization for transformer
In the training process of deep learning models, the selection of hyperparameters is crucial to model performance. However, due to the large search space of hyperparameters, methods such as grid search [8] or random search [9] are often time-consuming and inefficient. Therefore, this study adopts the Bayesian Optimization algorithm [10] to explore the optimal hyperparameter combination and enhance the predictive performance of the Transformer model.
When tuning the Transformer model, key hyperparameters include the model's embedding dimension (D_model), the number of attention heads (N_head), the number of encoder and decoder layers (Num_layers), and the hidden layer dimension of the feedforward neural network (Dim_feedforward). These hyperparameters directly impact the training efficiency and performance of the Transformer model. Therefore, in the experiment, a reasonable hyperparameter space for Bayesian optimization search was constructed based on the structural characteristics of the Transformer model and the dimensions of the fabric sample reflectance data, as shown in Table 3.
Table 3. Hyperparameter space
Hyperparameter Name | D_model | N_head | Num_layers | Dim_feedforward |
Search Range | [32,128] | [1,6] | [1,6] | [128,512] |
In the Table 3, the step size for D_model is set to 32, and the step size for Dim_feedforward is set to 128. In the experiment, the Bayesian optimization algorithm is used to perform 15 rounds of hyperparameter search. Random sampling is applied to determine the hyperparameter space, and in each round of the search, 30 random hyperparameter training runs for the Transformer model are conducted. Each subsequent round of search prioritizes sampling the parameters that are more likely to improve the model performance, based on the acquisition function. During the optimization process, the MAE value is used as the optimization objective, and the set of hyperparameters with the lowest MAE value in the training set is selected as the final hyperparameter combination for the model. The final results are: D_model = 64, N_head = 4, Num_layers = 1, Dim_feedforward = 256.
3.3. Comparison with typical models
To validate the effectiveness of the CTNet model, this study selects several representative prediction models—CNN, RNN [11], DNN [12], BP [13], LSTM [14], and Transformer—for comparative experiments under the same dataset conditions. The test results of each model are shown in Table 4.
Table 4. Evaluation results of each prediction model
Network Model | CNN | RNN | DNN | BP | LSTM | Transformer | CTNet |
MAE(%) | 15.32 | 11.08 | 10.03 | 9.85 | 12.31 | 9.42 | 7.89 |
As can be clearly seen from the table, CTNet outperforms the other models in the color matching prediction task, and compared to the Transformer model, the MAE value is reduced by 1.53%. To provide a more intuitive comparison of the performance differences among the models, the comparison results are shown in Figure 4.
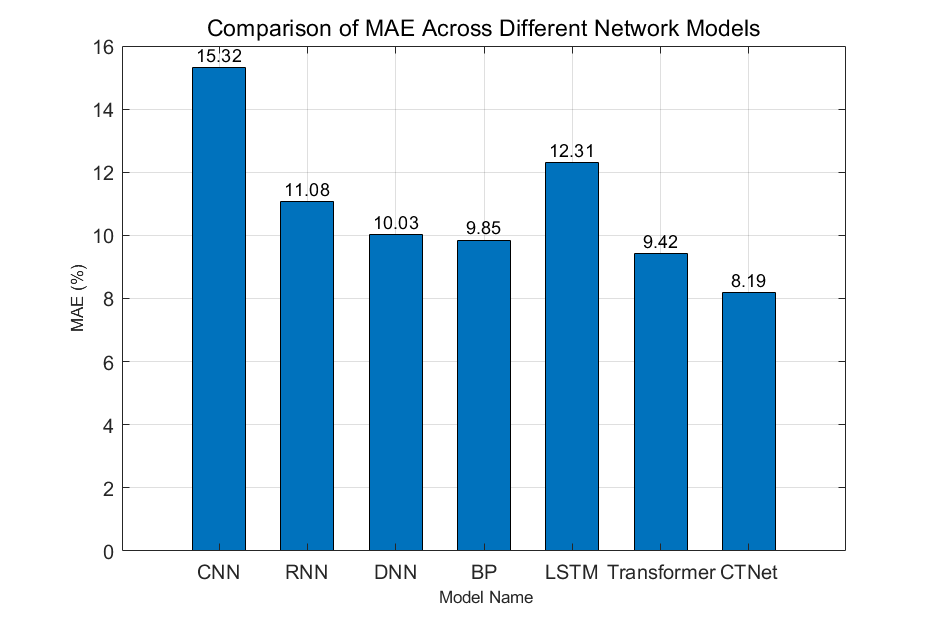
Figure 4. MAE values of each model
These results indicate that the CTNet model performs the best, validating the effectiveness of the proposed method in the ink color matching prediction task.
4. Conclusion
This paper presents the CTNet model, which combines CNN and Transformer models for ink color matching. The model leverages the strong local feature extraction ability of CNNs and the powerful long-sequence modeling capability of Transformers for the color matching prediction task. Additionally, the Bayesian optimization algorithm is employed for hyperparameter optimization of the Transformer, ensuring the model is in its optimal state. Experimental results show that, compared to the original Transformer model and other typical predictive neural networks, the CTNet model is optimal, with the MAE value reduced to 7.89, validating the effectiveness of the proposed method. In future work, further research can explore how to extend this model to different materials and ink types to enhance its application potential in the practical color matching industry.
References
[1]. Fu, J., & Caulfield, J. H. (2006). Designing spectral sensitivity curves for use with Artificial Color. Pattern Recognition, 40(8), 2251-2260.
[2]. Wang, Y., Tang, Y. L., Lee, C. H., & Kan, C. W. (2019). A Computer Color-Matching Study of Reverse Micellar Dyeing of Wool with Reactive Dyes. Polymers, 11(1), 132. https://doi.org/10.3390/polym11010132
[3]. Zhang, B., & Liu, H. (2008). Research on Application for Color Matching in Textile Dyeing Based on Numerical Analysis. IEEE International Conference on Computer Science and Software Engineering, 16(9), 357-360.
[4]. Li, X., Lv, X., Wang, J., Yang, G., & Jiang, X. (2013). The research of spectrophotometric color matching based on multi-peaks Gaussian fit. Society of Photo-Optical Instrumentation Engineers (SPIE) Conference Series, 8910(5), 1-7.
[5]. Raikwar, S., & Vemula, M. R. A. (2025). Self-attention-based 1DCNN model for multiclass EEG emotion classification. The Journal of Supercomputing, 81(4), 520-520.
[6]. Fernandez-Bermejo, J., Martinez-Del-Rincon, J., Dorado, J., Toro, X. D., Santofimia, M. J., & Lopez, J. C. (2024). Edge computing transformers for fall detection in older adults. International Journal of Neural Systems, 34(5), 2450026. https://doi.org/10.1142/S0129065724500266
[7]. Prechelt, L. (1998). Early stopping—but when? In Neural Networks: Tricks of the Trade (pp. 55-69). Springer, Berlin, Heidelberg.
[8]. Zong, Y., Nian, Y., Zhang, C., Tang, X., Wang, L., & Zhang, L. (2025). Hybrid Grid Search and Bayesian optimization-based random forest regression for predicting material compression pressure in manufacturing processes. Engineering Applications of Artificial Intelligence, 141(6), 109580.
[9]. Pérez-Padilla, N. A., Garcia-Sanchez, R., Avalos, O., Gálvez, J., Bian, M., Yu, L., Shu, Y., Feng, M., & Yelian, F. D. (2024). Optimizing trigger timing in minimal ovarian stimulation for In Vitro fertilization using machine learning models with random search hyperparameter tuning. Computers in biology and medicine, 179, 108856. https://doi.org/10.1016/j.compbiomed.2024.108856
[10]. Shahriari, B., Swersky, K., Wang, Z., Adams, R. P., & Freitas, N. D. (2015). Taking the human out of the loop: A review of Bayesian optimization. Proceedings of the IEEE, 104(1), 148-175.
[11]. Mukesh, R., Dass, S. C., Vijay, M., Kiruthiga, S., Praveenkumar, M., & Prashanth, M. (2024). Analysis of TEC variations and prediction of TEC by RNN during Indonesian earthquakes between 2004 – 2024 and comparison with IRI-2020 model. Advances in Space Research, 74(10), 4865-4905. https://doi.org/10.1016/j.asr.2024.07.055
[12]. Sanjib, S., & Debashis, N. (2024). LM-DNN: pre-trained DNN with LSTM and cross Fold validation for detecting viral pneumonia from chest CT. Computer Methods in Biomechanics and Biomedical Engineering: Imaging & Visualization, 11(7), 365-369.
[13]. Wang, J., Song, Y. J., & Tang, Q. A. (2012). The Use of BP Neural Network in Evaluation about the Appearance of the Garments. Advanced Materials Research, 1566(433-440), 4320-4323.
[14]. Chen, T., Zheng, J., Peng, C., Zhang, S., Jing, Z., & Wang, Z. (2024). Tapping process fault identification by LSTM neural network based on torque signal singularity feature. Journal of Mechanical Science and Technology, 38(3), 1123-1133.
Cite this article
Lei,Y. (2025). Research on ink color matching method based on CNN-Transformer model. Advances in Engineering Innovation,16(4),106-111.
Data availability
The datasets used and/or analyzed during the current study will be available from the authors upon reasonable request.
Disclaimer/Publisher's Note
The statements, opinions and data contained in all publications are solely those of the individual author(s) and contributor(s) and not of EWA Publishing and/or the editor(s). EWA Publishing and/or the editor(s) disclaim responsibility for any injury to people or property resulting from any ideas, methods, instructions or products referred to in the content.
About volume
Journal:Advances in Engineering Innovation
© 2024 by the author(s). Licensee EWA Publishing, Oxford, UK. This article is an open access article distributed under the terms and
conditions of the Creative Commons Attribution (CC BY) license. Authors who
publish this series agree to the following terms:
1. Authors retain copyright and grant the series right of first publication with the work simultaneously licensed under a Creative Commons
Attribution License that allows others to share the work with an acknowledgment of the work's authorship and initial publication in this
series.
2. Authors are able to enter into separate, additional contractual arrangements for the non-exclusive distribution of the series's published
version of the work (e.g., post it to an institutional repository or publish it in a book), with an acknowledgment of its initial
publication in this series.
3. Authors are permitted and encouraged to post their work online (e.g., in institutional repositories or on their website) prior to and
during the submission process, as it can lead to productive exchanges, as well as earlier and greater citation of published work (See
Open access policy for details).
References
[1]. Fu, J., & Caulfield, J. H. (2006). Designing spectral sensitivity curves for use with Artificial Color. Pattern Recognition, 40(8), 2251-2260.
[2]. Wang, Y., Tang, Y. L., Lee, C. H., & Kan, C. W. (2019). A Computer Color-Matching Study of Reverse Micellar Dyeing of Wool with Reactive Dyes. Polymers, 11(1), 132. https://doi.org/10.3390/polym11010132
[3]. Zhang, B., & Liu, H. (2008). Research on Application for Color Matching in Textile Dyeing Based on Numerical Analysis. IEEE International Conference on Computer Science and Software Engineering, 16(9), 357-360.
[4]. Li, X., Lv, X., Wang, J., Yang, G., & Jiang, X. (2013). The research of spectrophotometric color matching based on multi-peaks Gaussian fit. Society of Photo-Optical Instrumentation Engineers (SPIE) Conference Series, 8910(5), 1-7.
[5]. Raikwar, S., & Vemula, M. R. A. (2025). Self-attention-based 1DCNN model for multiclass EEG emotion classification. The Journal of Supercomputing, 81(4), 520-520.
[6]. Fernandez-Bermejo, J., Martinez-Del-Rincon, J., Dorado, J., Toro, X. D., Santofimia, M. J., & Lopez, J. C. (2024). Edge computing transformers for fall detection in older adults. International Journal of Neural Systems, 34(5), 2450026. https://doi.org/10.1142/S0129065724500266
[7]. Prechelt, L. (1998). Early stopping—but when? In Neural Networks: Tricks of the Trade (pp. 55-69). Springer, Berlin, Heidelberg.
[8]. Zong, Y., Nian, Y., Zhang, C., Tang, X., Wang, L., & Zhang, L. (2025). Hybrid Grid Search and Bayesian optimization-based random forest regression for predicting material compression pressure in manufacturing processes. Engineering Applications of Artificial Intelligence, 141(6), 109580.
[9]. Pérez-Padilla, N. A., Garcia-Sanchez, R., Avalos, O., Gálvez, J., Bian, M., Yu, L., Shu, Y., Feng, M., & Yelian, F. D. (2024). Optimizing trigger timing in minimal ovarian stimulation for In Vitro fertilization using machine learning models with random search hyperparameter tuning. Computers in biology and medicine, 179, 108856. https://doi.org/10.1016/j.compbiomed.2024.108856
[10]. Shahriari, B., Swersky, K., Wang, Z., Adams, R. P., & Freitas, N. D. (2015). Taking the human out of the loop: A review of Bayesian optimization. Proceedings of the IEEE, 104(1), 148-175.
[11]. Mukesh, R., Dass, S. C., Vijay, M., Kiruthiga, S., Praveenkumar, M., & Prashanth, M. (2024). Analysis of TEC variations and prediction of TEC by RNN during Indonesian earthquakes between 2004 – 2024 and comparison with IRI-2020 model. Advances in Space Research, 74(10), 4865-4905. https://doi.org/10.1016/j.asr.2024.07.055
[12]. Sanjib, S., & Debashis, N. (2024). LM-DNN: pre-trained DNN with LSTM and cross Fold validation for detecting viral pneumonia from chest CT. Computer Methods in Biomechanics and Biomedical Engineering: Imaging & Visualization, 11(7), 365-369.
[13]. Wang, J., Song, Y. J., & Tang, Q. A. (2012). The Use of BP Neural Network in Evaluation about the Appearance of the Garments. Advanced Materials Research, 1566(433-440), 4320-4323.
[14]. Chen, T., Zheng, J., Peng, C., Zhang, S., Jing, Z., & Wang, Z. (2024). Tapping process fault identification by LSTM neural network based on torque signal singularity feature. Journal of Mechanical Science and Technology, 38(3), 1123-1133.