


1. Introduction
Stroke is the second leading cause of death globally and the primary cause of long-term disability among adults. Its high disability rate and complex sequelae not only lead to a severe decline in patients' quality of life but also impose a substantial medical and economic burden on families and society. According to the latest data from the World Health Organization and the Global Burden of Disease Study, there are approximately 110 million stroke survivors worldwide, with around 13.7 million new cases annually. Moreover, with the accelerating pace of population aging and the increasing burden of metabolic diseases, the global incidence of stroke is projected to rise by 34% by 2030, presenting a daunting challenge for prevention and control [1]. Therefore, achieving accurate detection of stroke is of great significance for early prevention and timely treatment.
Traditional stroke detection methods primarily include electroencephalogram (EEG) [2], neurological function assessment [3], and ultrasound examination [4]. EEG utilizes multi-angle X-ray beams to penetrate the skull and reconstruct cross-sectional images through computer processing, enabling rapid differentiation between cerebral hemorrhage (high-density shadows) and ischemic infarction (low-density lesions). However, this method has limited resolution in detecting small infarcts or posterior fossa lesions and poses a risk of radiation exposure. Neurological function assessment employs the National Institutes of Health Stroke Scale (NIHSS), which quantifies stroke severity through 11 clinical evaluations (such as consciousness, visual fields, facial palsy, and limb motor function). Nonetheless, its accuracy is highly dependent on physicians’ expertise and is less sensitive to posterior circulation strokes. Ultrasound examination detects carotid plaques, stenosis, and changes in intracranial hemodynamics via ultrasound waves to assess stroke risk. However, this approach is highly operator-dependent and has limited capacity to visualize distal vascular lesions. To address the limitations of these methods, this study adopts a medical image-based approach for stroke detection. Compared with traditional techniques, medical imaging offers significant advantages in objectivity, resolution, and lesion visualization. Unlike EEG, which has limited spatial resolution and only indirect correlations with brain function, medical imaging can directly localize structural abnormalities. Compared with the subjectivity and delayed symptom presentation of neurological assessments, image analysis can reveal subtle pathological changes at early stages. Furthermore, in contrast to the acoustic window limitations and operator dependence of ultrasound, multimodal imaging technologies—such as perfusion imaging—can comprehensively quantify cerebral hemodynamic parameters. When combined with artificial intelligence algorithms, these technologies enable rapid, accurate, and automated diagnosis, providing highly reliable and visualized evidence to support clinical decision-making [5].
In recent years, deep learning models have been widely applied in the field of medical image classification. Examples include Convolutional Neural Networks (CNN) [6], Residual Networks with Convolutional Block Attention Modules (ResNet-CBAM) [7], Vision Transformers (ViT) [8], and Visual Geometry Group Networks (VGG) [9], among others. For instance, Gautam et al. proposed a method combining image fusion and CNN. By employing multi-focus image fusion as a preprocessing step to enhance the quality of CT images, they conducted two experiments on different datasets to validate the approach. The results showed classification accuracies of 98.33% on Dataset 1 and 98.77% in the second experiment [10]. However, this method demonstrates several limitations in medical image processing, including strong dependence on data, limited generalization capability, and a lack of interpretability. Tahyudin et al. proposed the ResNet-CBAM model, which integrates a residual network architecture with a convolutional block attention module to enhance the detection of critical features in CT images. The results indicated that the model achieved a classification accuracy of 95% for distinguishing normal from stroke images, with precision, recall, and F1 scores all exceeding 93% for stroke and non-stroke categories [11]. While ResNet-CBAM improves feature detection performance, the introduction of attention modules increases computational cost and necessitates a larger volume of training data; otherwise, the model is prone to overfitting under small-sample conditions. Yopiangga et al. employed CT scan images and the ViT method. By preprocessing patient CT images and segmenting them to localize key regions, classification efficiency was improved. Based on the pretrained Vision Transformer Base-16 model and after parameter optimization, the approach achieved a test accuracy of 91% on the stroke classification task [12]. Nevertheless, the method’s heavy reliance on large-scale labeled datasets, high computational complexity resulting in substantial resource consumption, and lack of prior knowledge of local features may lead to omission of subtle lesion details in medical image analysis. Sakinah et al. proposed a method based on the VGGNet-16 architecture. After enhancing CT image quality during preprocessing, a CNN model based on the VGGNet-16 structure achieved a training accuracy of 99.62% and a test accuracy of 99.5% in stroke classification, following parameter optimization. However, this method faces issues such as high computational cost, risk of overfitting, and insufficient sensitivity of deep networks to subtle lesions in medical images, making it difficult to adaptively optimize the expression of local features [13].
To address the limitations of the aforementioned methods, this study proposes the use of a Wavelet Scattering Network (WSN) for the classification of stroke CT images. Compared with traditional deep learning models such as CNN, ResNet-CBAM, ViT, and VGG, WSN exhibits distinct advantages in medical image classification. Its predefined filter bank based on wavelet transforms enables multi-scale and multi-directional geometric feature extraction, significantly reducing dependence on large-scale annotated datasets and mitigating the risk of overfitting caused by redundant parameters in CNN and VGG models. In contrast to the computational complexity introduced by the attention mechanisms in ResNet-CBAM, WSN achieves rotational and translational invariance through mathematically modeled hierarchical scattering paths, allowing it to stably characterize morphological features of lesions even in the presence of noise interference [14]. Furthermore, unlike ViT, which requires massive datasets to support global modeling via self-attention, WSN is capable of efficiently capturing subtle pathological changes—such as early ischemic diffusion abnormalities—even under limited sample conditions, as is common in small-scale stroke datasets. In addition, WSN offers theoretical interpretability, making it a robust, low-cost, and tuning-free solution for medical image classification.
2. Dataset
2.1. Stroke dataset
The dataset used in this study was compiled from the clinical Picture Archiving and Communication System (PACS) records of three institutions: Stanford University (Palo Alto, California, USA), the Federal University of São Paulo (São Paulo, Brazil), and Thomas Jefferson University Hospital (Philadelphia, Pennsylvania, USA) [15]. It includes annotated head CT scans representing five common subtypes of intracranial hemorrhage: subarachnoid hemorrhage, intraventricular hemorrhage, subdural hemorrhage, epidural hemorrhage, and intraparenchymal hemorrhage. The total number of images amounts to 874,035. The dataset was curated using label distributions from each contributing site to standardize exam distributions in the merged testing and validation sets. Data from each institution was partitioned into cohorts of 500 examinations, with the last 100 examinations from each cohort selected for the testing and validation sets. These were independently reviewed by two additional neuroradiologists. Fifteen percent of the triple-reviewed examinations were used for the final test set, while the remaining 5% were used for validation. Each series in the final dataset contains between 20 and 60 axial images with slice thicknesses ranging from 3 to 5 mm. After the curation process, the final dataset comprised 25,312 examinations, of which 21,784 were used for training and validation, and 3,528 for testing. Although this use case successfully captures the intended complexity and heterogeneity, it required a substantial amount of expert manual annotation. The dataset is publicly available on RSNA under the CC-BY-NC 4.0 license. Users must sign a data usage agreement and provide proper citation.Dataset access link: http://pubs.rsna.org/doi/full/10.1148/ryai.2020190211
2.2. Teknofest-2021 stroke dataset
This dataset originates from the Teknofest-2021 Medical Artificial Intelligence Competition: Stroke Dataset, which contains anonymized head computed tomography (CT) images [16]. The dataset was curated, compiled, and annotated by seven radiologists. For the planned training and testing datasets, data recorded during 2019 and 2020 were centrally filtered using various codes and selection criteria from the e-Pulse system and the Remote Radiology System of the Ministry of Health of the Republic of Türkiye. To construct the dataset, a total of 877 CT and 230 MRI studies were collected from 819 unique cases. The final training dataset consists of 6,651 images: 4,427 images show no evidence of stroke, chronic ischemic findings, or contain only normal findings; 1,131 images exhibit hyperacute/acute ischemic stroke findings; and 1,093 images show hemorrhagic stroke findings. The dataset preparation was organized by the Ministry of Health of the Republic of Türkiye. This study received ethical approval from the Ministry, and informed consent was waived due to the retrospective analysis of anonymized data from the national health database. Dataset access link: https://pmc.ncbi.nlm.nih.gov/articles/PMC9797774/
3. Method
3.1. Wavelet scattering transform
The wavelet transform involves convolving a signal with a set of wavelet families obtained by rotating and scaling a mother wavelet, thereby generating wavelet feature coefficients [17]. Specifically, let
In Equation (1),
Wavelet scattering applies a modulus operation to the wavelet transform coefficients primarily because the mean of the wavelet coefficients is zero. After linear transformation, the mean remains zero; therefore, by applying a nonlinear operation (taking the modulus), a non-zero wavelet coefficient is obtained, enabling it to carry meaningful information.
The modulus of the wavelet transform is defined as Equation (2):
At this stage, the wavelet features, which have undergone nonlinear operations, are convolved with the scaling function for averaging (low-pass filtering) to obtain wavelet features that possess both translation invariance and stability to local deformations, as shown in Equation (3):
Equation (3) is also referred to as the wavelet scattering transform.
3.2. Wavelet scattering representation
After the signal undergoes the wavelet scattering transform, the averaging operation makes the wavelet feature coefficients relatively stable; however, it also suppresses high-frequency components, resulting in some information loss and reducing the discriminative power of the wavelet feature coefficients. To recover high-frequency information, the wavelet modulus can be further decomposed at relatively larger scales (which must be smaller than the maximum scale). Nevertheless, these features still lack translation invariance, so further modulus operations and averaging (low-pass filtering) are required to achieve stability of the feature coefficients. This process is illustrated in Equation (4):
In Equation (4), where
Each averaging of features is accompanied by the loss of high-frequency information. Therefore, to ensure energy conservation, it is necessary to iteratively apply the wavelet scattering transform to the coefficients from the previous layer. Consequently, the obtained wavelet scattering feature coefficients are expressed as shown in Equation (5):
In Equation (5), where
This process can be illustrated as shown in Figure 1:
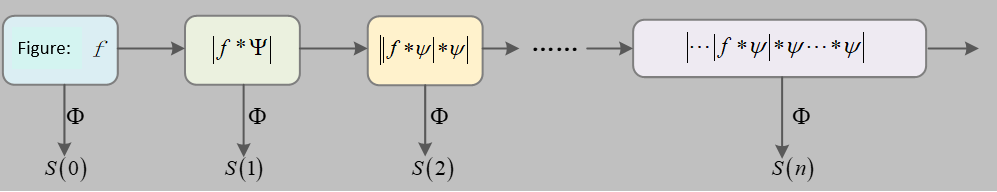
The propagation process begins with the input signal
Equation (6) is also referred to as the wavelet scattering propagation operator.
The signal is iteratively processed layer by layer, resulting in a series of scattering coefficient features
3.3. Wavelet scattering algorithm
3.3.1. Wavelet scattering network structure
Wavelet scattering can be described as the process where the original signal is filtered by wavelet filters to obtain high-frequency and low-frequency information. The low-frequency information corresponds to the desired features, but these features require nonlinear and stationary transformations to ensure invariance to signal deformations [18]. Meanwhile, the high-frequency information can be further processed to extract additional features. This process of wavelet transform followed by nonlinear transformation is repeated iteratively, continuously extracting features from the original signal.
Let the scattering path be
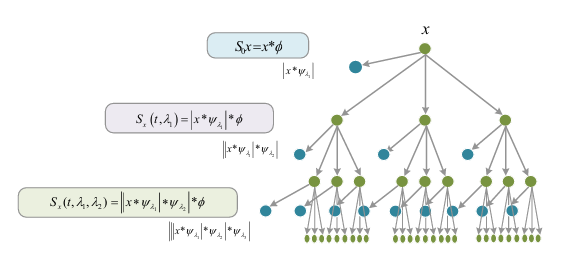
The network structure of wavelet scattering is shown in the figure above. The output of each layer in the network corresponds to the extracted features, referred to as the wavelet scattering transform. The feature coefficients can be expressed by Equation (7):
Its network structure is similar to that of deep Convolutional Neural Networks (CNNs), as both obtain features of the original input through convolution kernels (linear transformations) followed by nonlinear transformations (modulus operation) layer by layer. However, there are key differences:
(1) The convolution kernels in wavelet scattering use predefined wavelet filters, which extract optimal features by rotating and scaling the mother wavelet. Therefore, the network contains no trainable weights, significantly reducing computational complexity. In contrast, deep CNNs require learning convolution kernels through feedback-based iterative computations, resulting in higher computational costs.
(2) In WSN, each layer produces feature outputs, and the final feature representation is formed by concatenating the outputs from all layers. Conversely, in deep CNNs, only the final layer’s output serves as the feature descriptor for the object.
3.3.2. Wavelet scattering algorithm procedure
Based on the aforementioned WSN structure, the pseudo-code for the wavelet scattering transform algorithm is presented in Table 1 below:
|
Step 1: |
Input the image f. |
|
Step 2: |
Design the wavelet kernels according to the image size, then sequentially convolve the modulus output from the previous layer. |
|
Let |
|
|
for m = 1: |
|
|
For j = 1: J – 1 and |
|
|
end for |
|
|
end for |
|
|
Step 3: |
Obtain the final feature set according to the wavelet scattering results: |
3.4. Evaluation metrics
This study selects accuracy, precision, recall, and F1 score as the evaluation metrics for the WSN. The definitions of these four metrics are as follows [19]:
(1) Accuracy is the proportion of correctly predicted samples to the total number of samples, as shown in Equation (8):
(2) Precision is the proportion of true positive samples among those predicted as positive by the model, as shown in Equation (9):
(3) Recall is the proportion of true positive samples correctly predicted by the model among all actual positive samples, as shown in Equation (10):
(4) The F1 score is the harmonic mean of precision and recall, providing a comprehensive evaluation of model performance, as shown in Equation (11):
In the above Equations (8) to (11), True Positives (TP) refer to samples predicted as positive that are actually positive. False Positives (FP) are samples predicted as positive but are actually negative. False Negatives (FN) are samples predicted as negative but are actually positive. True Negatives (TN) refer to samples predicted as negative that are actually negative.
4. Results
4.1. Classification results on dataset 1
This study selected stroke CT images provided by three institutions (Stanford University, Federal University of São Paulo, and Thomas Jefferson University). The images were annotated with five types of hemorrhagic symptoms: subarachnoid hemorrhage, intraventricular hemorrhage, subdural hemorrhage, epidural hemorrhage, and intracerebral hemorrhage. The dataset comprises a total of 874,035 images. The experiment was implemented using MATLAB 2020, with R as the programming language. The number of wavelet layers was set to 2, and the Marr wavelet was selected. The training and testing datasets were split at a ratio of 7:3. Classification was performed using a Support Vector Machine (SVM). The classification results are shown in Figure 3.
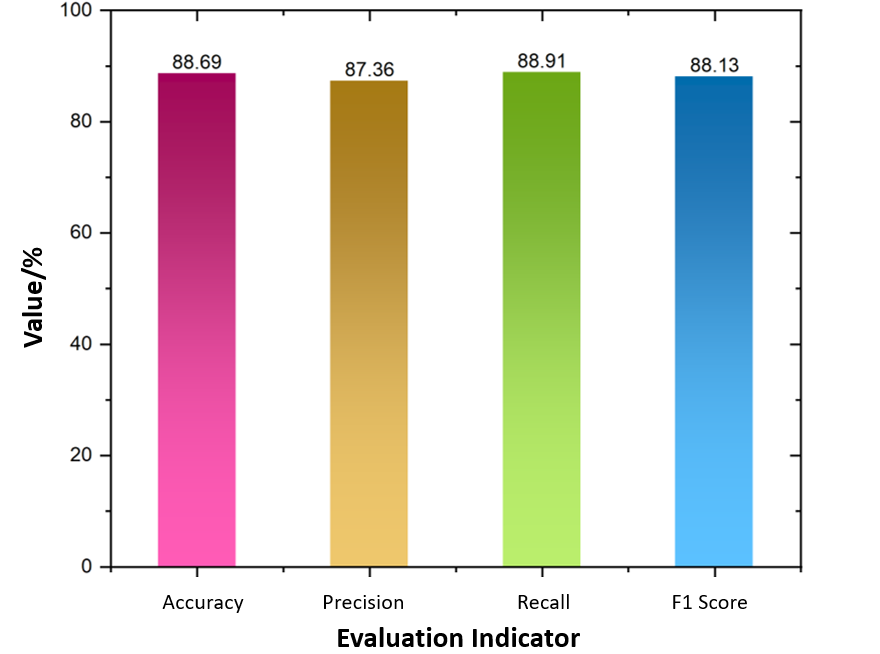
As shown in Figure 3, the WSN method proposed in this study achieved an accuracy of 88.69%, precision of 87.36%, recall of 88.91%, and an F1 score of 88.13% in classifying the five types of stroke-related symptoms. The values of these metrics are relatively close, collectively indicating that the classification model performs well on this dataset.
4.2. Classification results on dataset 2
The stroke dataset consists of axial head Computed Tomography (CT) images, including a total of 6,653 brain CT slices. Among these, 4,428 images belong to the non-stroke category, 1,131 images to the ischemic stroke category, and 1,094 images to the hemorrhagic stroke category. In this study, the training and testing sets were divided at a ratio of 8:2. The implementation was carried out using MATLAB 2020, with R as the programming language. The classification results are presented in Table 2.
|
Evaluation Metric |
Accuracy |
Precision |
Recall |
F1 Score |
|
Overall Value (%) |
93.75 |
92.16 |
92.87 |
92.51 |
Table 2 presents the classification results of stroke recognition on Dataset 2 using the WSN method. The accuracy reached 93.75%, precision was 92.16%, recall was 92.87%, and the F1 score was 92.51%. These metrics demonstrate the strong performance of the proposed method in the task of stroke disease recognition.
5. Discussion
5.1. Comparison with other methods
To demonstrate the significant advantages of the proposed method in terms of accuracy and computational complexity, this study conducted a comparison on Dataset 1 using other traditional image classification methods, such as Convolutional Neural Networks (CNN) and Long Short-Term Memory networks (LSTM). The comparison results are presented in Table 3.
|
Method |
Accuracy |
Testing Time (ms) |
|
CNN |
77.36 |
86 |
|
long short-term memory, LSTM [20] |
81.79 |
74 |
|
Graph neural network GCN [21] |
84.72 |
67 |
|
Capsule Neural Network, CapsNet [22] |
86.88 |
46 |
|
WSN (This study) |
88.69 |
41 |
As shown in Table 3, when classifying stroke CT images using CNN, LSTM, GCN, CapsNet, and the proposed WSN method, WSN achieved the best performance with an accuracy of 88.69% and a testing time of 41 ms. This was followed by CapsNet with an accuracy of 86.88%. The accuracies of GCN, LSTM, and CNN were 84.72%, 81.79%, and 77.36%, respectively.
WSN possesses unique advantages in medical image classification. Its filters are predefined wavelet filters that do not require parameter learning from training samples, thus eliminating reliance on large-scale datasets and enabling strong performance even with small sample sizes [23]. Through semi-discrete wavelet transform and nonlinear modulus operations, WSN extracts signal features with desirable properties such as translation invariance and deformation stability. These properties are rigorously proven mathematically, addressing the theoretical gaps present in CNNs [24]. Moreover, compared to Long Short-Term Memory networks (LSTMs), which are primarily designed for sequence data and are less specialized in image classification, WSN focuses more directly on image feature extraction and classification. Compared to Graph Neural Networks (GCNs), WSN benefits from more mature theories and methods for fundamental image feature extraction. Relative to Capsule Networks (CapsNets), WSN avoids issues such as slow training and difficulties in recognizing certain scenarios, enabling more stable and efficient feature extraction and classification in medical image tasks.
5.2. Limitations and future prospects
Although WSN demonstrates significant advantages in overcoming the limitations of traditional methods in stroke medical image classification, certain limitations remain. For example, it may be less flexible and efficient than some deep neural networks in finely capturing complex lesion details and in multimodal data fusion. Additionally, there is room for further improvement in computational efficiency and real-time applicability of the model. Future research could explore deeper integration of WSN with other deep learning models, such as LSTM, to leverage complementary strengths and enhance the capacity for processing complex medical images. Investigations into optimizing network architectures to improve computational efficiency and better suit real-time dynamic monitoring scenarios are also warranted. Furthermore, enhancing the fusion of multimodal medical data combined with more clinical information could further improve classification accuracy and clinical utility, thereby providing stronger technical support for precise diagnosis and treatment of stroke.
6. Conclusion
This study proposes the application of the Wavelet Scattering Network (WSN) for the classification of stroke CT images, successfully overcoming the shortcomings of traditional detection methods, such as reduced sensitivity to early subtle lesions and high misdiagnosis rates. On a multicenter dataset containing five hemorrhage subtypes, WSN achieved an accuracy of 88.69% (precision 87.36%, recall 88.91%). On a three-class dataset (ischemic/hemorrhagic/normal, n=6653), the accuracy improved to 93.75% (F1 score 92.51%). Compared with benchmark models such as CNN and LSTM, WSN significantly improved accuracy by 7.33–11.33%, with a detection speed of 41 ms per case. Compared to other methods, including CNN and LSTM, this approach offers stronger theoretical robustness, higher efficiency with small samples, and clinical interpretability, providing a novel solution for stroke disease detection.
References
[1]. El-Hajj, M., Salameh, P., Rachidi, S., & Hosseini, H. (2016). The epidemiology of stroke in the Middle East.European Stroke Journal, 1(3), 180–198.
[2]. Wu, J., Srinivasan, R., Quinlan, E. B., Solodkin, A., Small, S. L., & Cramer, S. C. (2016). Utility of EEG measures of brain function in patients with acute stroke.Journal of Neurophysiology, 115(5), 2399–2405.
[3]. Nakling, A. E., Aarsland, D., Næss, H., Wollschlaeger, D., Fladby, T., Hofstad, H., & Wehling, E. (2017). Cognitive deficits in chronic stroke patients: Neuropsychological assessment, depression, and self-reports.Dementia and Geriatric Cognitive Disorders Extra, 7(2), 283–296.
[4]. Herzberg, M., Boy, S., Hölscher, T., Ertl, M., Zimmermann, M., Ittner, K. P., Pemmerl, J., Pels, H., Bogdahn, U., & Schlachetzki, F. (2014). Prehospital stroke diagnostics based on neurological examination and transcranial ultrasound.Critical Ultrasound Journal, 6, 1–13.
[5]. Mayya, V., Tummala, V., Reddy, C. U., Mishra, P., Boddu, R., Olivia, D., & Kamath, S. S. (2023). Applications of machine learning in diabetic foot ulcer diagnosis using multimodal images: A review.IAENG International Journal of Applied Mathematics, 53(3).
[6]. Gautam, A., & Raman, B. (2021). Towards effective classification of brain hemorrhagic and ischemic stroke using CNN.Biomedical Signal Processing and Control, 63, 102178.
[7]. Xiao, Y., Yin, H., Wang, S. H., Zhang, Y. D., Yang, J., Liu, C., Zhang, Y., Wang, Q., & Zhang, B. (2021). TReC: Transferred ResNet and CBAM for detecting brain diseases.Frontiers in Neuroinformatics, 15, 781551.
[8]. Alam, A. M., Ahad, A., & Ahmed, S. (2024). Comparative analysis of brain stroke prediction using various pretrained CNN and ViT models. In 2024 IEEE International Conference on Computing, Applications and Systems (COMPAS)(pp. 1–6). IEEE.
[9]. Lai, Y. L., Wu, Y. D., Yeh, H. J., Lee, C. Y., Wang, J. J., & Chiu, H. Y. (2022). Using convolutional neural network to analyze brain MRI images for predicting functional outcomes of stroke.Medical & Biological Engineering & Computing, 60(10), 2841–2849.
[10]. Gautam, A., & Raman, B. (2021). Towards effective classification of brain hemorrhagic and ischemic stroke using CNN.Biomedical Signal Processing and Control, 63, 102178.
[11]. Tahyudin, I., Prabuwono, A. S., Dianingrum, M., Pandega, D. M., Winarto, E., Nazwan, Rozak, R. A., Lestari, P., & Tikaningsih, A. (2024). ResNet-CBAM in medical imaging: A high-accuracy tool for stroke detection from CT scans. In2024 8th International Conference on Information Technology, Information Systems and Electrical Engineering(ICITISEE) (pp. 551–556). IEEE.
[12]. Yopiangga, A. P., Badriyah, T., Syarif, I., & Sakinah, N. (2024). Stroke disease classification using CT scan image with vision transformer method. In2024 International Electronics Symposium (IES)(pp. 436–441). IEEE.
[13]. Sakinah, N., Subhan, M., Saputri, T. B. B., Badriah, T., & Syarif, I. (2024). VGGNet-16 convolutional neural network for classification of stroke based on CT scan images.International Conference on Applied Science and Technology on Engineering Science 2023 (iCAST-ES 2023)(pp. 1138–1150). Atlantis Press.
[14]. Agboola, H. A., & Zaccheus, J. E. (2023). Wavelet image scattering based glaucoma detection.BMC Biomedical Engineering, 5(1), 1.
[15]. Flanders, A. E., Prevedello, L. M., Shih, G., Halabi, S. S., Kalpathy-Cramer, J., Ball, R., Mongan, J. T., Stein, A., Kitamura, F. C., Lungren, M. P., Choudhary, G., Cala, L., Coelho, L., Mogensen, M., Morón, F., Miller, E., Ikuta, I., Zohrabian, V., McDonnell, O., Lincoln, C., Shah, L., Joyner, D., Agarwal, A., Lee, R. K., Nath, J., & RSNA-ASNR 2019 Brain Hemorrhage CT Annotators. (2020). Construction of a machine learning dataset through collaboration: The RSNA 2019 brain CT hemorrhage challenge.Radiology: Artificial Intelligence, 2(3), e190211.
[16]. Koç, U., Akçapınar Sezer, E., Alper Özkaya, Y., et al. (2022). Artificial intelligence in healthcare competition (TEKNOFEST-2021): Stroke data set.Eurasian Journal of Medicine, 54(3), 248–258.
[17]. Lin, C.-L. (2010). A tutorial of the wavelet transform.NTUEE, Taiwan, 21(22), 2.
[18]. Liu, Z., Yao, G., Zhang, Q., Zhang, J., & Zeng, X. (2020). Wavelet scattering transform for ECG beat classification.Computational and Mathematical Methods in Medicine, 2020(1), 3215681.
[19]. Islam, M. M., Akter, S., Rokunojjaman, M., Rony, J. H., & Amin, A. (2021). Stroke prediction analysis using machine learning classifiers and feature technique.International Journal of Electronics and Communications Systems, 1(2), 17–22.
[20]. Yu, Y., Parsi, B., Speier, W., Arnold, C., Lou, M., & Scalzo, F. (2019). LSTM network for prediction of hemorrhagic transformation in acute stroke. InInternational Conference on Medical Image Computing and Computer-Assisted Intervention(pp. 177–185). Cham: Springer International Publishing.
[21]. Huang, Z., & Yu, S. (2024). Intelligent diagnosis and treatment model of hemorrhagic stroke based on graph convolutional neural network. InProceedings of the 2024 International Conference on Smart Healthcare and Wearable Intelligent Devices(pp. 108–114).
[22]. Maya, B. S., & Asha, T. (2017). Segmentation and classification of brain hemorrhage using U-net and CapsNet.Journal of Seybold Report ISSN NO, 2017(1533), 9211.
[23]. Shi, J., Zhao, Y., Xiang, W., Monga, V., Liu, X., & Tao, R. (2021). Deep scattering network with fractional wavelet transform.IEEE Transactions on Signal Processing, 69, 4740–4757.
[24]. Bruna, J., & Mallat, S. (2013). Invariant scattering convolution networks.IEEE Transactions on Pattern Analysis and Machine Intelligence, 35(8), 1872–1886.
Cite this article
Pei,Z.;Pei,Z. (2025). Research on stroke medical image classification based on Wavelet Scattering Network. Advances in Engineering Innovation,16(7),74-82.
Data availability
The datasets used and/or analyzed during the current study will be available from the authors upon reasonable request.
Disclaimer/Publisher's Note
The statements, opinions and data contained in all publications are solely those of the individual author(s) and contributor(s) and not of EWA Publishing and/or the editor(s). EWA Publishing and/or the editor(s) disclaim responsibility for any injury to people or property resulting from any ideas, methods, instructions or products referred to in the content.
About volume
Journal:Advances in Engineering Innovation
© 2024 by the author(s). Licensee EWA Publishing, Oxford, UK. This article is an open access article distributed under the terms and
conditions of the Creative Commons Attribution (CC BY) license. Authors who
publish this series agree to the following terms:
1. Authors retain copyright and grant the series right of first publication with the work simultaneously licensed under a Creative Commons
Attribution License that allows others to share the work with an acknowledgment of the work's authorship and initial publication in this
series.
2. Authors are able to enter into separate, additional contractual arrangements for the non-exclusive distribution of the series's published
version of the work (e.g., post it to an institutional repository or publish it in a book), with an acknowledgment of its initial
publication in this series.
3. Authors are permitted and encouraged to post their work online (e.g., in institutional repositories or on their website) prior to and
during the submission process, as it can lead to productive exchanges, as well as earlier and greater citation of published work (See
Open access policy for details).
References
[1]. El-Hajj, M., Salameh, P., Rachidi, S., & Hosseini, H. (2016). The epidemiology of stroke in the Middle East.European Stroke Journal, 1(3), 180–198.
[2]. Wu, J., Srinivasan, R., Quinlan, E. B., Solodkin, A., Small, S. L., & Cramer, S. C. (2016). Utility of EEG measures of brain function in patients with acute stroke.Journal of Neurophysiology, 115(5), 2399–2405.
[3]. Nakling, A. E., Aarsland, D., Næss, H., Wollschlaeger, D., Fladby, T., Hofstad, H., & Wehling, E. (2017). Cognitive deficits in chronic stroke patients: Neuropsychological assessment, depression, and self-reports.Dementia and Geriatric Cognitive Disorders Extra, 7(2), 283–296.
[4]. Herzberg, M., Boy, S., Hölscher, T., Ertl, M., Zimmermann, M., Ittner, K. P., Pemmerl, J., Pels, H., Bogdahn, U., & Schlachetzki, F. (2014). Prehospital stroke diagnostics based on neurological examination and transcranial ultrasound.Critical Ultrasound Journal, 6, 1–13.
[5]. Mayya, V., Tummala, V., Reddy, C. U., Mishra, P., Boddu, R., Olivia, D., & Kamath, S. S. (2023). Applications of machine learning in diabetic foot ulcer diagnosis using multimodal images: A review.IAENG International Journal of Applied Mathematics, 53(3).
[6]. Gautam, A., & Raman, B. (2021). Towards effective classification of brain hemorrhagic and ischemic stroke using CNN.Biomedical Signal Processing and Control, 63, 102178.
[7]. Xiao, Y., Yin, H., Wang, S. H., Zhang, Y. D., Yang, J., Liu, C., Zhang, Y., Wang, Q., & Zhang, B. (2021). TReC: Transferred ResNet and CBAM for detecting brain diseases.Frontiers in Neuroinformatics, 15, 781551.
[8]. Alam, A. M., Ahad, A., & Ahmed, S. (2024). Comparative analysis of brain stroke prediction using various pretrained CNN and ViT models. In 2024 IEEE International Conference on Computing, Applications and Systems (COMPAS)(pp. 1–6). IEEE.
[9]. Lai, Y. L., Wu, Y. D., Yeh, H. J., Lee, C. Y., Wang, J. J., & Chiu, H. Y. (2022). Using convolutional neural network to analyze brain MRI images for predicting functional outcomes of stroke.Medical & Biological Engineering & Computing, 60(10), 2841–2849.
[10]. Gautam, A., & Raman, B. (2021). Towards effective classification of brain hemorrhagic and ischemic stroke using CNN.Biomedical Signal Processing and Control, 63, 102178.
[11]. Tahyudin, I., Prabuwono, A. S., Dianingrum, M., Pandega, D. M., Winarto, E., Nazwan, Rozak, R. A., Lestari, P., & Tikaningsih, A. (2024). ResNet-CBAM in medical imaging: A high-accuracy tool for stroke detection from CT scans. In2024 8th International Conference on Information Technology, Information Systems and Electrical Engineering(ICITISEE) (pp. 551–556). IEEE.
[12]. Yopiangga, A. P., Badriyah, T., Syarif, I., & Sakinah, N. (2024). Stroke disease classification using CT scan image with vision transformer method. In2024 International Electronics Symposium (IES)(pp. 436–441). IEEE.
[13]. Sakinah, N., Subhan, M., Saputri, T. B. B., Badriah, T., & Syarif, I. (2024). VGGNet-16 convolutional neural network for classification of stroke based on CT scan images.International Conference on Applied Science and Technology on Engineering Science 2023 (iCAST-ES 2023)(pp. 1138–1150). Atlantis Press.
[14]. Agboola, H. A., & Zaccheus, J. E. (2023). Wavelet image scattering based glaucoma detection.BMC Biomedical Engineering, 5(1), 1.
[15]. Flanders, A. E., Prevedello, L. M., Shih, G., Halabi, S. S., Kalpathy-Cramer, J., Ball, R., Mongan, J. T., Stein, A., Kitamura, F. C., Lungren, M. P., Choudhary, G., Cala, L., Coelho, L., Mogensen, M., Morón, F., Miller, E., Ikuta, I., Zohrabian, V., McDonnell, O., Lincoln, C., Shah, L., Joyner, D., Agarwal, A., Lee, R. K., Nath, J., & RSNA-ASNR 2019 Brain Hemorrhage CT Annotators. (2020). Construction of a machine learning dataset through collaboration: The RSNA 2019 brain CT hemorrhage challenge.Radiology: Artificial Intelligence, 2(3), e190211.
[16]. Koç, U., Akçapınar Sezer, E., Alper Özkaya, Y., et al. (2022). Artificial intelligence in healthcare competition (TEKNOFEST-2021): Stroke data set.Eurasian Journal of Medicine, 54(3), 248–258.
[17]. Lin, C.-L. (2010). A tutorial of the wavelet transform.NTUEE, Taiwan, 21(22), 2.
[18]. Liu, Z., Yao, G., Zhang, Q., Zhang, J., & Zeng, X. (2020). Wavelet scattering transform for ECG beat classification.Computational and Mathematical Methods in Medicine, 2020(1), 3215681.
[19]. Islam, M. M., Akter, S., Rokunojjaman, M., Rony, J. H., & Amin, A. (2021). Stroke prediction analysis using machine learning classifiers and feature technique.International Journal of Electronics and Communications Systems, 1(2), 17–22.
[20]. Yu, Y., Parsi, B., Speier, W., Arnold, C., Lou, M., & Scalzo, F. (2019). LSTM network for prediction of hemorrhagic transformation in acute stroke. InInternational Conference on Medical Image Computing and Computer-Assisted Intervention(pp. 177–185). Cham: Springer International Publishing.
[21]. Huang, Z., & Yu, S. (2024). Intelligent diagnosis and treatment model of hemorrhagic stroke based on graph convolutional neural network. InProceedings of the 2024 International Conference on Smart Healthcare and Wearable Intelligent Devices(pp. 108–114).
[22]. Maya, B. S., & Asha, T. (2017). Segmentation and classification of brain hemorrhage using U-net and CapsNet.Journal of Seybold Report ISSN NO, 2017(1533), 9211.
[23]. Shi, J., Zhao, Y., Xiang, W., Monga, V., Liu, X., & Tao, R. (2021). Deep scattering network with fractional wavelet transform.IEEE Transactions on Signal Processing, 69, 4740–4757.
[24]. Bruna, J., & Mallat, S. (2013). Invariant scattering convolution networks.IEEE Transactions on Pattern Analysis and Machine Intelligence, 35(8), 1872–1886.