


1. Introduction
Driving fatigue poses a serious threat, as it significantly impairs a driver’s reaction time, judgment, and attention, thereby greatly increasing the risk of major traffic accidents and endangering both road safety and the lives of vehicle occupants [1]. According to research data, in China alone, more than 12,000 fatalities occur each year due to fatigue-related traffic accidents, accounting for 21.3% of all traffic-related deaths [2]. Accurate detection of driving fatigue is therefore of critical importance for improving road safety and reducing casualties. Effective detection of fatigue not only helps prevent traffic accidents and mitigate associated social and economic losses, but also provides key technological support for intelligent driving systems, thereby promoting the development of smart transportation and fostering a safer and more efficient travel environment.
Traditional methods for detecting driving fatigue include facial features [3], eye movement characteristics [4], Electrocardiogram (ECG) signals [5], and vehicle motion trajectories [6]. Facial feature-based methods assess fatigue levels by monitoring indicators such as blinking frequency and pupil dilation. However, these methods are highly sensitive to changes in ambient lighting and are easily affected by external environmental factors [7]. Eye movement-based methods detect fatigue by tracking eye motion and blink frequency, but these are easily influenced by the driver’s visual condition and may cause discomfort during prolonged monitoring, potentially impairing driving performance [8]. ECG-based approaches evaluate fatigue by analyzing heart rate variability and changes in inter-beat intervals. However, these methods require the driver to wear sensors, which may affect comfort, and individual physiological differences can lead to misjudgments [9]. Vehicle trajectory-based methods infer the driver’s fatigue state by monitoring driving behaviors such as lane departures or sudden braking. However, such behaviors may not accurately reflect the driver’s true fatigue level and are often influenced by road conditions and external environments [10]. In recent years, Electroencephalogram (EEG)-based fatigue detection has gained significant attention and application. Compared with facial features, eye movements, ECG signals, and vehicle trajectory methods, EEG signals offer distinct advantages in fatigue detection. Firstly, EEG signals directly reflect brain activity and are closely associated with physiological changes related to fatigue, thereby offering higher accuracy. Secondly, EEG signals are not affected by external factors such as lighting conditions or visual health, providing more stable and reliable fatigue assessment. In addition, EEG-based monitoring can capture the driver’s fatigue state in real time and provide timely feedback, offering strong real-time performance and effectiveness. Given these advantages, this study adopts EEG signals for detecting driving fatigue.
In recent years, research on EEG-based driving fatigue detection has made significant progress. Traditional approaches primarily include Sample Entropy (SampEn), Multifractal Detrended Fluctuation Analysis (MF-DFA), complexity analysis, and brain network analysis. Zhang et al. investigated the performance of various kernel-based algorithms using SampEn features to classify fatigued and non-fatigued subjects solely based on non-invasive scalp EEG signals. The results demonstrated that combining SampEn features with a Support Vector Machine (SVM) classifier achieved the highest classification accuracy of 97.2% [11]. In addition, Wang et al. proposed an MF-DFA method to detect fatigue caused by prolonged driving by extracting EEG signals in the θ (4–7 Hz) and β (14–32 Hz) frequency bands. The results indicated that with increased driving duration, multifractal spectrum features of EEG signals—such as Hurst exponent width, spectral width, and symmetry—changed significantly [12]. Han et al. developed a simulated driving experimental platform based on Unity3D software to design experiments for simulating fatigue driving. The results showed that under fatigue conditions, the randomness of neuronal activity significantly decreased, and the complexity of brain activity was reduced, as evidenced by the marked weakening of β waves in the frontal and central regions [13]. Qin et al. proposed a directional brain network method based on EEG source signals to investigate the impact of driving fatigue on the brain’s information processing capacity. The experiments revealed that as driving time increased, both the average clustering coefficient and average path length grew, while the global efficiency of most EEG rhythms declined [14]. However, EEG-based fatigue detection methods using SampEn have limited sensitivity in capturing subtle variations in EEG signals and are susceptible to noise interference, which undermines classification accuracy. MF-DFA-based methods, while effective, involve complex multiscale segmentation and detrending operations, resulting in high computational cost and difficulty in meeting the real-time demands of actual driving scenarios. Complexity analysis methods are highly sensitive to physiological noise such as eye movements and electromyographic signals, which interfere with the calculation of complexity metrics and compromise both accuracy and reliability. Brain network analysis methods also face challenges due to significant inter-individual differences in EEG frequency, amplitude, and brain activity patterns. These variations in fatigue expression among drivers make it difficult to establish a universal detection model, necessitating individual-specific optimization, which increases implementation complexity.
In recent years, deep learning methods have been increasingly applied in the field of driving fatigue detection. For example, Xiang et al. proposed a fatigue detection system based on a three-dimensional Convolutional Neural Network (CNN) combined with a channel attention mechanism. Experimental results showed that the system achieved a classification accuracy of 95% on the FDF dataset, indicating its effectiveness for fatigue detection in driving scenarios [15]. Quddus et al. used Long Short-Term Memory (LSTM) cells to simulate eye movements, employing two types of LSTM: a one-dimensional LSTM (R-LSTM) as the baseline, and a convolutional LSTM (C-LSTM) designed to directly process two-dimensional image inputs. Results demonstrated high system effectiveness, with the R-LSTM-based approach achieving approximately 82% accuracy, and the C-LSTM-based method achieving between 95% and 97% accuracy [16]. Ed-Doughmi et al. proposed a method for analyzing and predicting driver drowsiness by applying a Recurrent Neural Network (RNN) to sequential frames of the driver’s facial images. The system achieved an accuracy of approximately 92%, demonstrating the potential for real-time driver monitoring systems aimed at reducing road accidents [17]. However, EEG-based fatigue detection methods using CNN face significant challenges. EEG signals are highly susceptible to artifacts caused by eye movements and environmental noise, requiring complex preprocessing and noise suppression techniques to ensure detection accuracy and stability. EEG-based fatigue detection methods using LSTM also encounter difficulties, as they demand large volumes of well-annotated EEG data. In real driving scenarios, it is difficult to obtain sufficient and accurately labeled data, which can lead to unstable model performance or overfitting. Similarly, when applying RNN to EEG-based fatigue detection, the presence of substantial noise and artifacts in EEG signals impairs the network’s ability to extract meaningful features, resulting in suboptimal performance in filtering noise and capturing effective signal patterns.
In light of the limitations of the aforementioned methods, this study adopts an improved dense connection network for detecting driver fatigue. The improved dense connection network significantly enhances feature reuse and gradient propagation efficiency through a unique cross-layer dense connectivity mechanism. Instead of simple summation, each layer receives as input a concatenation of the feature maps from all preceding layers, resulting in multi-scale feature fusion. This approach effectively reduces parameter redundancy while enhancing the model’s representational capacity. In addition, the use of short-path gradient propagation alleviates the vanishing gradient problem in deep networks. The incorporation of modular dense blocks and transition layers further ensures a balance between computational efficiency and model depth.
2. Dataset
2.1. SEED-VIG dataset
The experimental data used in this study are drawn from the SEED-VIG fatigue database established by the Center for Brain-like Computing and Machine Intelligence, Department of Computer Science and Engineering, Shanghai Jiao Tong University. During the experiment, the research team developed a simulated driving system to collect EEG signals and employed an eye tracker (SMI Eye-Tracking Glasses) to record the percentage of eyelid closure (Perclos), which was then used to annotate the EEG data [18]. The simulated driving scenario primarily featured straight and monotonous roads, which are more likely to induce driver fatigue. Perclos is an indicator used to measure the level of driver fatigue. It is defined as the ratio of the time during which the eyelids are closed to the total time within a given time window. When a person is awake and alert, the eyelid closure frequency is relatively low; however, as fatigue increases, the frequency and duration of eyelid closure tend to rise. The Perclos value ranges between 0 and 1, with higher values indicating greater fatigue. Therefore, monitoring the driver’s eyelid closure level provides an effective means of estimating their fatigue state.
Perclos is evaluated by detecting the driver’s eyelid status using cameras or sensors, and then calculating the percentage of eyelid closure [19]. The calculation of Perclos is expressed by Equation (1), which is the ratio of eyelid closure time to the total time within a given time window.
Generally, when the Perclos value reaches 70%, the driver can be considered to be in a state of fatigue and should take a rest or make adjustments accordingly. Therefore, Perclos serves as an effective indicator to help drivers detect fatigue in a timely manner, thereby enhancing road safety.
2.2. Fatigue dataset
The public dataset used in this experiment was proposed by Cao et al. in 2018. They conducted a total of 62 driving simulator experiments, each lasting 90 minutes, collecting 32-channel EEG data from 27 different subjects [20]. The experiment simulated a nighttime four-lane highway driving environment, where subjects were instructed to keep the vehicle centered within the lane. Random lane departure events were introduced, causing the vehicle to drift either left or right from the original cruising path. The subjects were required to respond immediately by steering the wheel to return the vehicle to its initial cruising lane. To avoid interference from other factors during driving, subjects were prohibited from controlling the accelerator or brake pedals, with only steering wheel operation allowed. Each lane departure event comprised three phases: vehicle drift onset, driver reaction initiation, and driver correction. The experiment recorded the timestamp of each event, and the difference between reaction initiation time and drift onset time was defined as the reaction time (RT). EEG signals were simultaneously recorded. Typically, the next lane departure event would begin 5 to 10 seconds after the completion of the previous event. If a subject fell asleep, no feedback was provided to prompt continuation of the experiment. EEG data were recorded using 32 Ag/AgCl electrodes, positioned according to the international 10-20 system, including Fp1, Fp2, F7, F3, FZ, F4, F8, FT7, FC3, FCZ, FC4, FT8, T3, C3, CZ, C4, T4, TP7, CP3, CPZ, CP4, TP8, A1, T5, P3, PZ, P4, T6, A2, O1, OZ, and O2. Electrodes A1 and A2 served as reference electrodes. The EEG signals were sampled at a frequency of 500 Hz.
3. Method
3.1. Fundamental theory
3.1.1. Convolutional Neural Network
A typical Convolutional Neural Network (CNN) consists of convolutional layers, pooling layers, fully connected layers, Batch Normalization (BN) layers, and activation layers [21]. The convolutional layers perform convolution operations by sliding convolutional kernels across the input, sequentially extracting features that contain localized information. Each convolutional kernel outputs a specific type of feature extracted from the input. The shared parameter weights of convolutional kernels confer an advantage, as CNNs require fewer parameters compared to fully connected neural networks, thereby reducing the risk of model overfitting. The convolution operation can be mathematically expressed as:
In the equation:
Pooling layers are typically added after convolutional layers. The feature maps output by the convolutional layers are input to the pooling layers for downsampling, which reduces the data dimensionality. Max pooling and average pooling are commonly used pooling operations. Max pooling outputs the maximum value within the pooling region, while average pooling outputs the average value of all values within the pooling region. Both operations achieve downsampling and perform a limited amount of feature extraction.
The batch normalization (BN) layer normalizes the data by computing the mean and variance, ensuring that the data follows a consistent distribution and becomes more stable. This accelerates the network training process and enables the model to converge faster. The BN operation can be expressed as:
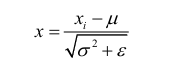 (3)
(3)
In Equation (3):
Activation functions enhance the model's nonlinear representation capability. The activation functions used in this study include ReLU6 and h-swish, which are defined as follows:
3.1.2. Dense connection convolutional network
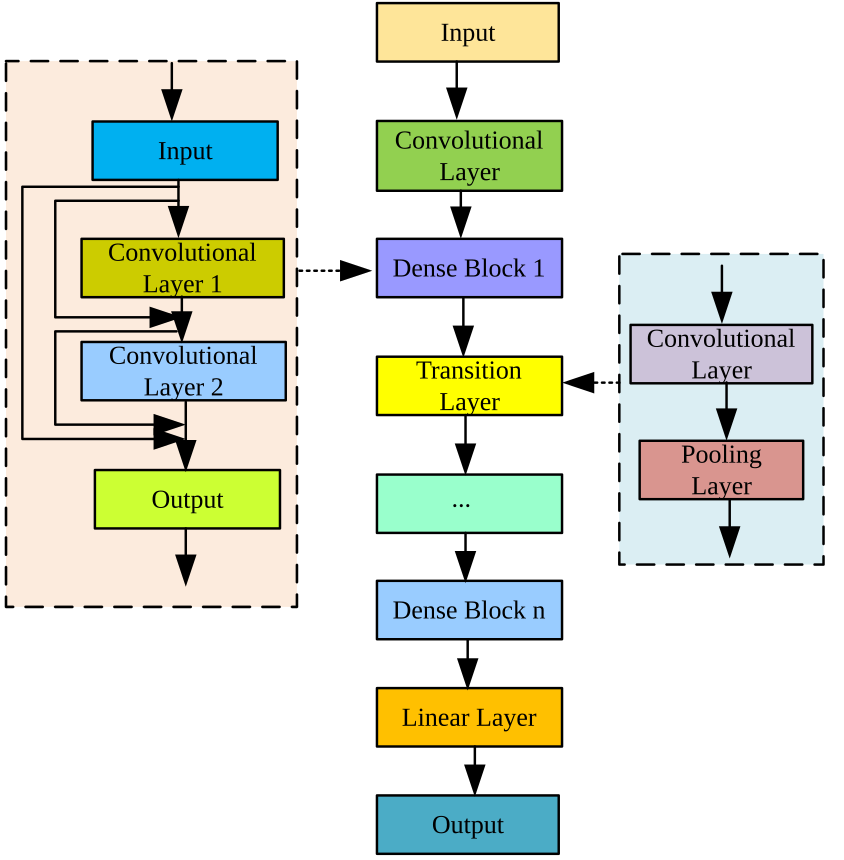
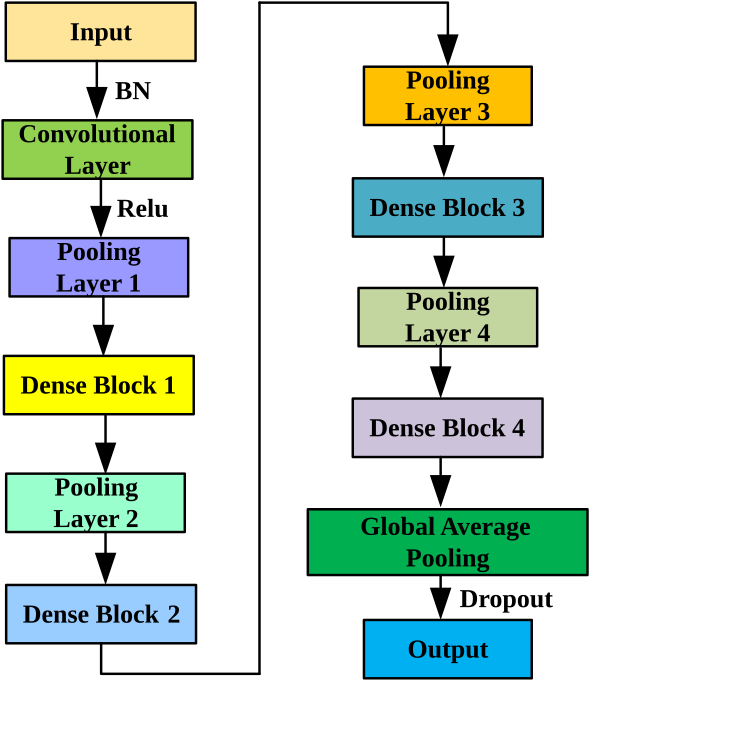
As shown in Figure 1, the dense connection convolutional network, currently one of the most advanced CNN architectures, further enhances information flow between layers based on the residual network, alleviating gradient degradation and suppressing overfitting. The dense connection convolutional network consists of dense blocks and transition layers. Dense blocks employ a novel connectivity pattern in which the outputs of all preceding layers are used as inputs to the current layer, and the output of the current layer is passed on as input to all subsequent layers [22]. While residual blocks in residual networks include two convolutional layers and skip connections, dense blocks build upon this by adding additional inter-layer connections beyond the two convolutional layers and skip connections. These additional connections enable repeated reuse of input features, ensuring maximal information flow. Transition layers consist of convolutional layers and pooling layers, primarily serving to reduce the spatial dimensions of feature maps. In the improved dense connection convolutional network, the transition layer contains only a max pooling layer.
3.1.3. Attention mechanism
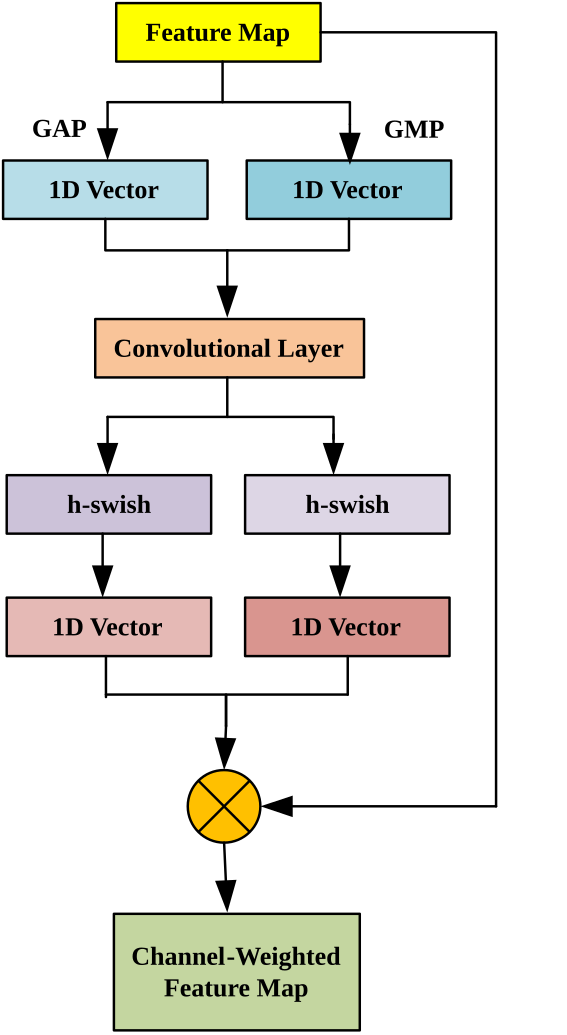
The attention mechanism is inspired by the physiological behavior of human vision. When observing objects, humans tend to focus their attention on the most salient features. Accordingly, a channel attention mechanism is introduced to weight the feature map channels produced by multi-scale convolution operations within dense blocks, thereby enhancing the model’s representational capacity. Typical channel attention mechanisms, such as SENet, apply Global Average Pooling (GAP) to the input feature maps to obtain a one-dimensional vector (where each feature map is downsampled to a single value). This vector is then passed through fully connected layers, and a Softmax classifier outputs a one-dimensional vector whose dimension equals the number of feature map channels. This vector is used to weight each channel of the feature map. However, the use of fully connected layers involves multiple dimensional transformations, which increases the number of model parameters and can result in the loss of useful information to some extent. Therefore, this study adopts the Efficient Channel Attention (ECA) module, a local cross-channel attention mechanism that avoids dimensionality reduction. Furthermore, based on the original ECA module, Global Max Pooling (GMP) is incorporated to extract more comprehensive features than single pooling alone.
As shown in Figure 2, channel features are extracted through two pooling methods, producing two one-dimensional vectors with dimensions equal to the number of channels. These vectors are then processed by convolution operations using a shared convolution kernel of size 1×3, generating two distinct one-dimensional representations. After fusing these representations into a single one-dimensional vector, it is used to weight the input feature maps. Experimental results demonstrate that the introduction of the improved ECA attention module contributes to enhancing the model’s robustness in fault diagnosis under varying working conditions.
3.2. Fault diagnosis based on improved dense connection convolutional network
3.2.1. Dense block construction
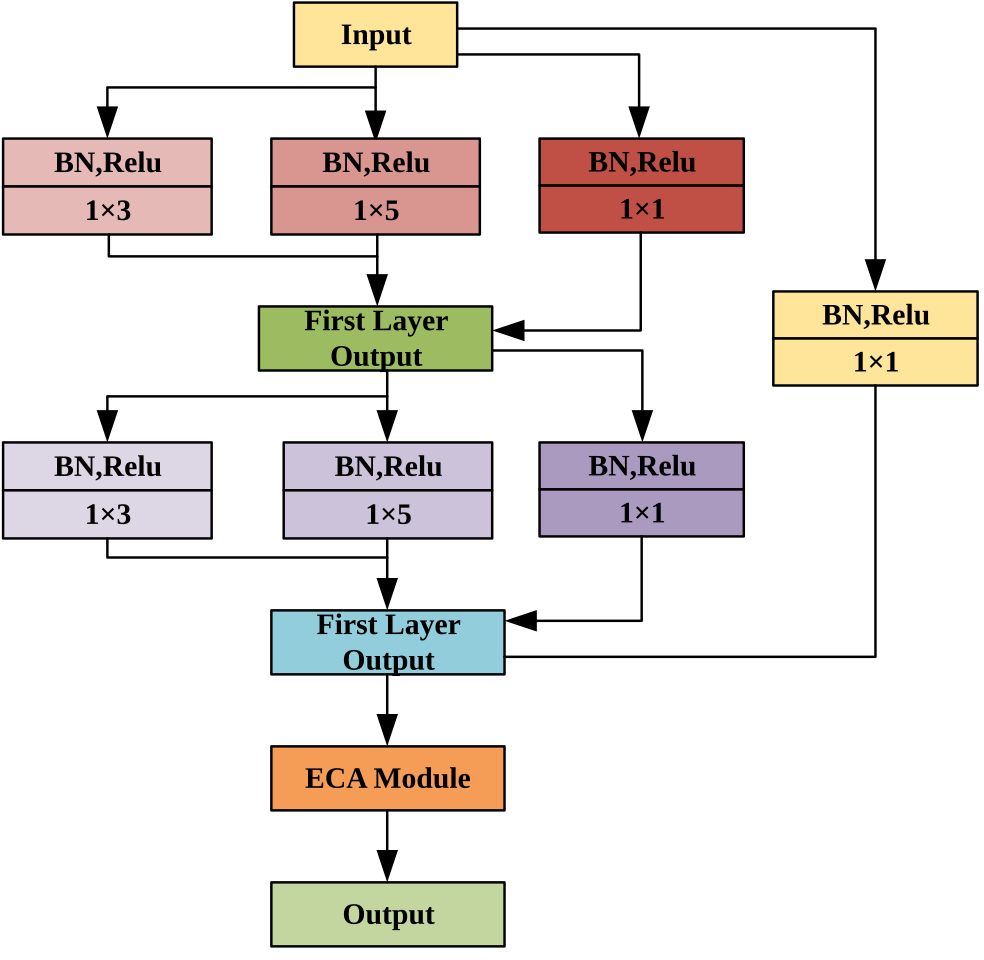
The constructed dense block is illustrated in Figure 3. Each convolutional layer contains two types of convolution kernels, 1×5 and 1×3, enabling multi-scale feature extraction. The features extracted by these two kernels at different scales are stacked and then fused with the input features through a concatenation connection. To ensure dimensional consistency, a 1×1 convolution kernel is applied on the concatenation path to increase the feature dimension. The fused features are then adjusted by the improved ECA attention module to reweight the channels and enhance the expressive capability. The number of convolution kernels used in all dense blocks of the improved dense connection convolutional network is listed in Table 1. All convolution strides are set to 1, and all network layers adopt a pre-activation scheme (Batch Normalization → ReLU → Convolutional Layer) to reduce model complexity and accelerate convergence.
|
Dense Block |
Convolutional Layer |
Kernel Size |
||
|
1×5 |
1×3 |
1×1 |
||
|
Dense Block 1 |
Convolutional Layer 1 |
32 |
32 |
64 |
|
Convolutional Layer 2 |
32 |
32 |
64 |
|
|
Dense Block 2 |
Convolutional Layer 1 |
32 |
32 |
64 |
|
Convolutional Layer 2 |
32 |
32 |
64 |
|
|
Dense Block 3 |
Convolutional Layer 1 |
64 |
64 |
128 |
|
Convolutional Layer 2 |
64 |
64 |
128 |
|
|
Dense Block 4 |
Convolutional Layer 1 |
64 |
64 |
128 |
|
Convolutional Layer 2 |
64 |
64 |
128 |
|
3.2.2. Improved dense connection convolutional network structure
The structure of the improved dense connection convolutional network is illustrated in Figure 4. The first layer employs 32 large-scale convolution kernels of size 1×64 with a stride of 16. Using large-scale convolution kernels increases the receptive field without deepening the network, enabling the extraction of more information, noise suppression, and dimensionality reduction. This is followed by a max pooling layer that reduces the size of the feature maps, thereby decreasing the number of parameters input to the dense blocks. Pooling layers mainly serve to reduce dimensionality. To minimize data loss during downsampling, all max pooling layers are set to a size of 1×2. After the first pooling layer, the main feature extraction part of the network consists of alternating dense blocks and max pooling layers of size 1×2. Given that the input data are one-dimensional EEG signals, and considering that EEG signals are more sensitive to the maximum values within a region, max pooling is selected for downsampling. The network comprises a total of four dense blocks and three max pooling layers. Following the final dense block, a global average pooling layer replaces the fully connected layer. Dropout is introduced to suppress overfitting. After feature extraction is complete, a Softmax classifier performs the classification task. The raw one-dimensional EEG signal is directly used as the model input without any data preprocessing, enabling an end-to-end fault diagnosis task. The related parameter settings are as follows: batch size is 32; the loss function is cross-entropy; dropout rate is 0.5; a learning rate decay strategy is applied, starting at 0.01 and decaying by a factor of 10 every 50 epochs; the optimizer used is Adam; and the total number of training epochs is 200.
3.3. Evaluation metrics
In machine learning classification tasks, accuracy, precision, recall, and F1 score are commonly used evaluation metrics [23].
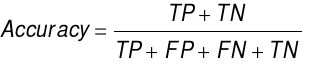
(1) Accuracy measures the overall proportion of correct predictions made by the model and is calculated by the formula:
 (6)
(6)
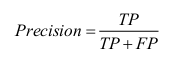
(2) Precision focuses on the proportion of samples predicted as positive that are actually positive, reflecting the reliability of the predictions. The formula is:
 (7)
(7)
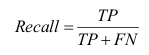
(3) Recall reflects the proportion of actual positive samples that are correctly predicted, indicating the model’s coverage capability. The formula is:
 (8)
(8)
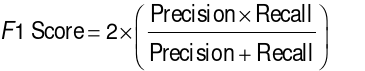
(4) The F1 score is the harmonic mean of precision and recall, used to balance both metrics, and is especially suitable for scenarios with class imbalance. The formula is:
 (9)
(9)
These metrics evaluate model performance from different perspectives: accuracy is suitable for balanced datasets, while precision and recall focus more on the quality of positive class predictions, and the F1 score provides a comprehensive balance between the two.
Among these, TP (True Positive) refers to the number of samples correctly predicted as positive by the model, i.e., samples that are actually positive and predicted as positive. TN (True Negative) refers to the number of samples correctly predicted as negative by the model, i.e., samples that are actually negative and predicted as negative. FP (False Positive) refers to samples that are incorrectly predicted as positive, also known as “false alarms.” FN (False Negative) refers to samples that are incorrectly predicted as negative, i.e., missed detections. These four metrics form the core of the confusion matrix, which is used to calculate performance metrics such as accuracy, precision, and recall.
4. Results
4.1. SEED-VIG dataset detection results
This study selected the SEED-VIG dataset for detection. The dataset contains data from a total of 23 subjects. From this dataset, 800 EEG data samples were selected, with 400 samples representing the awake state and 400 samples representing the fatigue state. The training-to-testing split ratio was set to 8:2. The deep learning model was implemented in Python and executed in the PyTorch environment, with 500 training iterations. The classification results on this dataset are shown in Table 2.
|
Evaluation Metric |
Accuracy |
Precision |
Recall |
F1 Score |
|
Value (%) |
97.32 |
96.43 |
95.78 |
96.10 |
As shown in Table 2, the model demonstrates outstanding performance. An accuracy of 97.32% indicates a very high overall correctness in the model’s predictions. A precision of 96.43% signifies that among the samples predicted as positive, a high proportion are truly positive, with relatively few False Positives (FP). The recall rate of 95.78% shows that the model effectively captures actual positive samples, resulting in a low number of False Negatives (FN). The F1 score of 96.10%, which integrates precision and recall, further validates the model’s balance and robustness in classifying both positive and negative samples. Overall, these metrics indicate that the classification model possesses high reliability and generalization ability on the SEED-VIG dataset.
4.2. Fatigue dataset detection results
This study analyzed EEG signals from the O1, O2, C3, and C4 channels. EEG signals were segmented into 5-second intervals, with a total of 800 segments selected—400 representing the awake state and 400 representing the fatigue state. The training-to-testing split ratio was set to 7:3. The classification results are shown in the figure below.
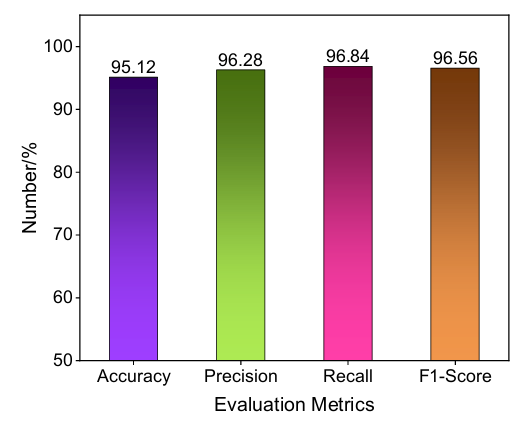
As shown in Figure 5, the model demonstrates excellent performance on the fatigue dataset. The accuracy reaches 95.12%, indicating strong overall classification performance. The precision is 96.28%, suggesting that the model has a very low false positive rate when predicting samples as fatigued. The recall is as high as 96.84%, reflecting the model’s strong ability to capture true fatigue states with a low miss rate. The F1 score of 96.56% further confirms the balance between precision and recall. Overall, the model exhibits high accuracy and strong robustness in fatigue state detection tasks, making it well-suited for EEG-based fatigue classification applications.
5. Discussion
5.1. Result comparison
To demonstrate the advantages of the method proposed in this study for driving fatigue detection, several traditional approaches—including Convolutional Neural Network (CNN), Long Short-Term Memory (LSTM), and Deep Belief Networks (DBN)—were employed to classify the SEED-VIG dataset. The classification results are presented in Table 3.
|
Method |
Accuracy (%) |
|
CNN [24] |
92.18 |
|
LSTM [25] |
93.87 |
|
DBN [26] |
94.21 |
|
ecurrent neural network, RNN [27] |
95.50 |
|
Graph neural network, GNN [28] |
95.89 |
|
Improved Dense Connection Convolutional Network |
97.32 |
As shown in Table 3, the proposed improved dense connection convolutional network significantly outperforms other methods in terms of accuracy, achieving the highest performance of 97.32%. Traditional CNN and LSTM models yielded lower accuracies of 92.18% and 93.87%, respectively. DBN and RNN performed slightly better, with accuracies of 94.21% and 95.50%, while GNN ranked second with an accuracy of 95.89%. This comparison demonstrates the clear advantage of the improved dense connection convolutional network in classification tasks. The performance improvement can be attributed to the optimized network architecture, which enables more effective feature extraction. Overall, the proposed method surpasses existing mainstream models in accuracy, showcasing its strong potential for practical applications.
In EEG-based driving fatigue detection tasks, compared to methods such as CNN, LSTM, DBN, RNN, and GNN, the improved dense connection convolutional network (such as the modified DenseNet) offers core advantages in its superior feature reuse capability, parameter efficiency, and ability to mitigate gradient vanishing. These strengths make it particularly well-suited for processing EEG data, which often features weak signal characteristics, important spatial topological relationships, and limited data volume. The proposed method has the following advantages:
(1) Preservation and Enhancement of Subtle Features: Subtle fatigue-related features extracted in the early layers—such as slight changes in specific frequency band energy—can be seamlessly propagated to deeper layers and fused with more complex features extracted later. This prevents the loss of critical information that may occur in traditional CNNs.
(2) High Parameter Efficiency: Through feature reuse, the network avoids relearning redundant features at each layer, significantly reducing the number of model parameters. This is especially important for EEG datasets, which are typically small in scale, as it lowers the risk of overfitting and enhances the model’s generalization capability.
(3) Optimized Information Flow and Mitigation of Gradient Vanishing: The dense cross-layer connections provide abundant short-path gradient backpropagation, significantly alleviating the gradient vanishing problem often encountered in training deep networks. This enables the construction and training of deeper and more powerful networks, allowing for the learning of more complex EEG fatigue representation patterns [29].
(4) Inherent Integration of Spatial Information: The convolutional operations of CNNs effectively capture the spatial topological relationships between EEG channels—an area where GNNs excel, though GNNs are more complex in design. The improved DenseNet architecture, with the incorporation of attention mechanisms or specialized modules, further enhances the integration of spatial features and the temporal dynamics of EEG signals—typically the strength of LSTM/RNN. This approach avoids the high computational cost and gradient issues associated with long sequences in LSTM/RNN models, as well as the structural complexity and training challenges of DBNs [30].
5.2. Limitations and future directions
Although the proposed improved dense connection convolutional network demonstrates superior performance in driving fatigue detection, several limitations remain. For example, EEG signals are susceptible to physiological noise such as eye movements and Electromyographic (EMG) interference. This study did not quantitatively analyze the model’s robustness under strong noise conditions, which may lead to performance degradation due to signal quality fluctuations in practical applications. Furthermore, this study relies solely on Perclos as the fatigue label, without integrating other physiological indicators (e.g., heart rate variability, galvanic skin response), potentially overlooking the multifaceted nature of fatigue. To address these limitations, future research may proceed along the following directions: First, multimodal data fusion can be explored by combining eye-tracking, ECG, functional Near-Infrared Spectroscopy (fNIRS), and other heterogeneous data sources to develop cross-modal fatigue detection models, thereby enhancing the comprehensiveness and reliability of fatigue assessment. Second, efforts can be made to enhance cross-scenario generalization by collecting EEG data in real-world driving environments (e.g., long-haul trucking, taxi driving) and applying transfer learning techniques to improve the model’s adaptability to complex and varied scenarios.
6. Conclusion
This study proposed an EEG signal classification method for driving fatigue detection based on an improved dense connection convolutional network and validated its effectiveness on the SEED-VIG dataset. Experimental results demonstrate that the proposed method significantly outperforms traditional approaches such as CNN, LSTM, DBN, RNN, and GNN, achieving an accuracy of 97.32%, precision of 96.43%, recall of 95.78%, and an F1 score of 96.10%. These results highlight the method’s excellent classification performance and strong generalization capability.
The core contributions and innovations of this study can be summarized as follows:
(1) End-to-End Feature Extraction and Classification: The model directly uses raw EEG signals as input, avoiding the limitations of traditional methods that rely on complex preprocessing and manual feature engineering, thereby improving the model’s applicability and computational efficiency.
(2) Improved Dense Connection Architecture: By utilizing dense cross-layer connections and multi-scale convolutional layer design, the model enhances feature reuse, reduces parameter redundancy, and mitigates the gradient vanishing problem in deep networks, enabling more effective capture of subtle fatigue-related features in EEG signals.
(3) Optimization of the Attention Mechanism: The introduction of an improved ECA attention module, combining global average pooling and global max pooling, enables dynamic weighting of multi-scale feature channels, further enhancing the model’s sensitivity to key fatigue-related features.
(4) Robustness and Generalization: The model maintains high accuracy and stability in EEG data characterized by significant noise interference and individual variability, outperforming traditional methods such as CNNs, which are sensitive to noise; LSTMs, which require large amounts of data; and RNNs, which have poor noise resistance.
References
[1]. Aravinth, S. S., Nagamani, G., Kumar, C. K., Lasisi, A., Naveed, Q. N., Bhowmik, A., & Khan, W. A. (2025). Dynamic cross-domain transfer learning for driver fatigue monitoring: Multi-modal sensor fusion with adaptive real-time personalizations.Scientific Reports, 15(1), 1–20.
[2]. Yogarayan, S., Razak, S. F. A., Mogan, J. N., Azman, A., & Sivaprakasam, A. (2025). Alertness analytics: AI-enhanced detection of driver fatigue and intoxication. InThe smart life revolution(pp. 21–44). CRC Press.
[3]. Li, D., Zhang, X., Liu, X., Ma, Z., & Zhang, B. (2023). Driver fatigue detection based on comprehensive facial features and gated recurrent unit.Journal of Real-Time Image Processing, 20(2), 19.
[4]. Li, Q. (2024). Advancements in driver fatigue detection: A comprehensive analysis of eye movement and facial feature approaches.Applied and Computational Engineering, 65, 75–80.
[5]. Ekinci, E., Kahraman, K., & Oturakci, M. (2025). Enhancing driver safety: Integrating ECG and CAN-Bus data for accurate drowsiness detection.Traitement du Signal, 42(2), 1057.
[6]. Chang, H., & Park, D. (2020). Potentialities of vehicle trajectory big data for monitoring potentially fatigued drivers and explaining vehicle crashes on motorway sections.Sustainability, 12(15), 5877.
[7]. Li, W. (2024). Driver fatigue detection method based on facial features using deep learning.Applied and Computational Engineering, 57, 190–199.
[8]. Kassem, H. A., Chowdhury, M., & Abawajy, J. H. (2021). Drivers fatigue level prediction using facial and head behavior information.IEEE Access, 9, 121686–121697.
[9]. Wang, J., Cai, M., Zhu, Z., Ding, H., Yi, J., & Du, A. (2025). VTD: Visual and tactile dataset for driver state and behavior detection.IEEE Robotics and Automation Letters.
[10]. Pan, Y., Dong, Y., Wang, D., Cao, S., & Chen, A. (2024). Comparative study on fatigue evaluation of suspenders by introducing actual vehicle trajectory data.Scientific Reports, 14(1), 5165.
[11]. Zhang, T., Chen, J., He, E., & Wang, H. (2021). Sample-entropy-based method for real driving fatigue detection with multichannel electroencephalogram.Applied Sciences, 11(21), 10279.
[12]. Wang, F., Wang, H., Zhou, X., & Fu, R. (2022). A driving fatigue feature detection method based on multifractal theory.IEEE Sensors Journal, 22(19), 19046–19059.
[13]. Han, C., Yang, Y., Sun, X., & Qin, Y. (2018, October). Complexity analysis of EEG signals for fatigue driving based on sample entropy. In2018 11th International Congress on Image and Signal Processing, Biomedical Engineering and Informatics (CISP-BMEI)(pp. 1–9). IEEE.
[14]. Qin, Y., Hu, Z., Chen, Y., Liu, J., Jiang, L., Che, Y., & Han, C. (2022). Directed brain network analysis for fatigue driving based on EEG source signals.Entropy, 24(8), 1093.
[15]. Xiang, W., Wu, X., Li, C., Zhang, W., & Li, F. (2022). Driving fatigue detection based on the combination of multi-branch 3D-CNN and attention mechanism.Applied Sciences, 12(9), 4689.
[16]. Quddus, A., Zandi, A. S., Prest, L., & Comeau, F. J. (2021). Using long short term memory and convolutional neural networks for driver drowsiness detection.Accident Analysis & Prevention, 156, 106107.
[17]. Ed-Doughmi, Y., Idrissi, N., & Hbali, Y. (2020). Real-time system for driver fatigue detection based on a recurrent neuronal network.Journal of Imaging, 6(3), 8.
[18]. Zheng, W. L., & Lu, B. L. (2017). A multimodal approach to estimating vigilance using EEG and forehead EOG.Journal of Neural Engineering, 14(2), 026017.
[19]. Zhou, F., Alsaid, A., Blommer, M., Curry, R., Swaminathan, R., Kochhar, D., ... & Lei, B. (2020). Driver fatigue transition prediction in highly automated driving using physiological features.Expert Systems with Applications, 147, 113204.
[20]. Cao, Z., Chuang, C. H., King, J. K., & Lin, C. T. (2019). Multi-channel EEG recordings during a sustained-attention driving task.Scientific Data, 6(1), 19.
[21]. Nanni, L., Lumini, A., Ghidoni, S., & Maguolo, G. (2020). Stochastic selection of activation layers for convolutional neural networks.Sensors, 20(6), 1626.
[22]. Li, G., Zhang, M., Li, J., Lv, F., & Tong, G. (2021). Efficient densely connected convolutional neural networks.Pattern Recognition, 109, 107610.
[23]. Naidu, G., Zuva, T., & Sibanda, E. M. (2023, April). A review of evaluation metrics in machine learning algorithms. InComputer science on-line conference(pp. 15–25). Cham: Springer International Publishing.
[24]. Xiang, W., Wu, X., Li, C., Zhang, W., & Li, F. (2022). Driving fatigue detection based on the combination of multi-branch 3D-CNN and attention mechanism.Applied Sciences, 12(9), 4689.
[25]. Quddus, A., Zandi, A. S., Prest, L., & Comeau, F. J. (2021). Using long short term memory and convolutional neural networks for driver drowsiness detection.Accident Analysis & Prevention, 156, 106107.
[26]. Kır Savaş, B., & Becerikli, Y. (2022). Behavior-based driver fatigue detection system with deep belief network.Neural Computing and Applications, 34(16), 14053–14065.
[27]. Ed-Doughmi, Y., Idrissi, N., & Hbali, Y. (2020). Real-time system for driver fatigue detection based on a recurrent neuronal network.Journal of Imaging, 6(3), 8.
[28]. Zhang, W., Wang, F., Wu, S., Xu, Z., Ping, J., & Jiang, Y. (2020). Partial directed coherence based graph convolutional neural networks for driving fatigue detection.Review of Scientific Instruments, 91(7).
[29]. Tan, Y. S., Lim, K. M., & Lee, C. P. (2021). Hand gesture recognition via enhanced densely connected convolutional neural network.Expert Systems with Applications, 175, 114797.
[30]. Li, G., Zhang, M., Li, J., Lv, F., & Tong, G. (2021). Efficient densely connected convolutional neural networks.Pattern Recognition, 109, 107610.
Cite this article
Zhi,Y.;Li,M. (2025). Research on driving fatigue detection based on improved dense connection convolutional network. Advances in Engineering Innovation,16(7),46-57.
Data availability
The datasets used and/or analyzed during the current study will be available from the authors upon reasonable request.
Disclaimer/Publisher's Note
The statements, opinions and data contained in all publications are solely those of the individual author(s) and contributor(s) and not of EWA Publishing and/or the editor(s). EWA Publishing and/or the editor(s) disclaim responsibility for any injury to people or property resulting from any ideas, methods, instructions or products referred to in the content.
About volume
Journal:Advances in Engineering Innovation
© 2024 by the author(s). Licensee EWA Publishing, Oxford, UK. This article is an open access article distributed under the terms and
conditions of the Creative Commons Attribution (CC BY) license. Authors who
publish this series agree to the following terms:
1. Authors retain copyright and grant the series right of first publication with the work simultaneously licensed under a Creative Commons
Attribution License that allows others to share the work with an acknowledgment of the work's authorship and initial publication in this
series.
2. Authors are able to enter into separate, additional contractual arrangements for the non-exclusive distribution of the series's published
version of the work (e.g., post it to an institutional repository or publish it in a book), with an acknowledgment of its initial
publication in this series.
3. Authors are permitted and encouraged to post their work online (e.g., in institutional repositories or on their website) prior to and
during the submission process, as it can lead to productive exchanges, as well as earlier and greater citation of published work (See
Open access policy for details).
References
[1]. Aravinth, S. S., Nagamani, G., Kumar, C. K., Lasisi, A., Naveed, Q. N., Bhowmik, A., & Khan, W. A. (2025). Dynamic cross-domain transfer learning for driver fatigue monitoring: Multi-modal sensor fusion with adaptive real-time personalizations.Scientific Reports, 15(1), 1–20.
[2]. Yogarayan, S., Razak, S. F. A., Mogan, J. N., Azman, A., & Sivaprakasam, A. (2025). Alertness analytics: AI-enhanced detection of driver fatigue and intoxication. InThe smart life revolution(pp. 21–44). CRC Press.
[3]. Li, D., Zhang, X., Liu, X., Ma, Z., & Zhang, B. (2023). Driver fatigue detection based on comprehensive facial features and gated recurrent unit.Journal of Real-Time Image Processing, 20(2), 19.
[4]. Li, Q. (2024). Advancements in driver fatigue detection: A comprehensive analysis of eye movement and facial feature approaches.Applied and Computational Engineering, 65, 75–80.
[5]. Ekinci, E., Kahraman, K., & Oturakci, M. (2025). Enhancing driver safety: Integrating ECG and CAN-Bus data for accurate drowsiness detection.Traitement du Signal, 42(2), 1057.
[6]. Chang, H., & Park, D. (2020). Potentialities of vehicle trajectory big data for monitoring potentially fatigued drivers and explaining vehicle crashes on motorway sections.Sustainability, 12(15), 5877.
[7]. Li, W. (2024). Driver fatigue detection method based on facial features using deep learning.Applied and Computational Engineering, 57, 190–199.
[8]. Kassem, H. A., Chowdhury, M., & Abawajy, J. H. (2021). Drivers fatigue level prediction using facial and head behavior information.IEEE Access, 9, 121686–121697.
[9]. Wang, J., Cai, M., Zhu, Z., Ding, H., Yi, J., & Du, A. (2025). VTD: Visual and tactile dataset for driver state and behavior detection.IEEE Robotics and Automation Letters.
[10]. Pan, Y., Dong, Y., Wang, D., Cao, S., & Chen, A. (2024). Comparative study on fatigue evaluation of suspenders by introducing actual vehicle trajectory data.Scientific Reports, 14(1), 5165.
[11]. Zhang, T., Chen, J., He, E., & Wang, H. (2021). Sample-entropy-based method for real driving fatigue detection with multichannel electroencephalogram.Applied Sciences, 11(21), 10279.
[12]. Wang, F., Wang, H., Zhou, X., & Fu, R. (2022). A driving fatigue feature detection method based on multifractal theory.IEEE Sensors Journal, 22(19), 19046–19059.
[13]. Han, C., Yang, Y., Sun, X., & Qin, Y. (2018, October). Complexity analysis of EEG signals for fatigue driving based on sample entropy. In2018 11th International Congress on Image and Signal Processing, Biomedical Engineering and Informatics (CISP-BMEI)(pp. 1–9). IEEE.
[14]. Qin, Y., Hu, Z., Chen, Y., Liu, J., Jiang, L., Che, Y., & Han, C. (2022). Directed brain network analysis for fatigue driving based on EEG source signals.Entropy, 24(8), 1093.
[15]. Xiang, W., Wu, X., Li, C., Zhang, W., & Li, F. (2022). Driving fatigue detection based on the combination of multi-branch 3D-CNN and attention mechanism.Applied Sciences, 12(9), 4689.
[16]. Quddus, A., Zandi, A. S., Prest, L., & Comeau, F. J. (2021). Using long short term memory and convolutional neural networks for driver drowsiness detection.Accident Analysis & Prevention, 156, 106107.
[17]. Ed-Doughmi, Y., Idrissi, N., & Hbali, Y. (2020). Real-time system for driver fatigue detection based on a recurrent neuronal network.Journal of Imaging, 6(3), 8.
[18]. Zheng, W. L., & Lu, B. L. (2017). A multimodal approach to estimating vigilance using EEG and forehead EOG.Journal of Neural Engineering, 14(2), 026017.
[19]. Zhou, F., Alsaid, A., Blommer, M., Curry, R., Swaminathan, R., Kochhar, D., ... & Lei, B. (2020). Driver fatigue transition prediction in highly automated driving using physiological features.Expert Systems with Applications, 147, 113204.
[20]. Cao, Z., Chuang, C. H., King, J. K., & Lin, C. T. (2019). Multi-channel EEG recordings during a sustained-attention driving task.Scientific Data, 6(1), 19.
[21]. Nanni, L., Lumini, A., Ghidoni, S., & Maguolo, G. (2020). Stochastic selection of activation layers for convolutional neural networks.Sensors, 20(6), 1626.
[22]. Li, G., Zhang, M., Li, J., Lv, F., & Tong, G. (2021). Efficient densely connected convolutional neural networks.Pattern Recognition, 109, 107610.
[23]. Naidu, G., Zuva, T., & Sibanda, E. M. (2023, April). A review of evaluation metrics in machine learning algorithms. InComputer science on-line conference(pp. 15–25). Cham: Springer International Publishing.
[24]. Xiang, W., Wu, X., Li, C., Zhang, W., & Li, F. (2022). Driving fatigue detection based on the combination of multi-branch 3D-CNN and attention mechanism.Applied Sciences, 12(9), 4689.
[25]. Quddus, A., Zandi, A. S., Prest, L., & Comeau, F. J. (2021). Using long short term memory and convolutional neural networks for driver drowsiness detection.Accident Analysis & Prevention, 156, 106107.
[26]. Kır Savaş, B., & Becerikli, Y. (2022). Behavior-based driver fatigue detection system with deep belief network.Neural Computing and Applications, 34(16), 14053–14065.
[27]. Ed-Doughmi, Y., Idrissi, N., & Hbali, Y. (2020). Real-time system for driver fatigue detection based on a recurrent neuronal network.Journal of Imaging, 6(3), 8.
[28]. Zhang, W., Wang, F., Wu, S., Xu, Z., Ping, J., & Jiang, Y. (2020). Partial directed coherence based graph convolutional neural networks for driving fatigue detection.Review of Scientific Instruments, 91(7).
[29]. Tan, Y. S., Lim, K. M., & Lee, C. P. (2021). Hand gesture recognition via enhanced densely connected convolutional neural network.Expert Systems with Applications, 175, 114797.
[30]. Li, G., Zhang, M., Li, J., Lv, F., & Tong, G. (2021). Efficient densely connected convolutional neural networks.Pattern Recognition, 109, 107610.