


1. Introduction
1.1. Background
With the rapid adoption of Internet technologies and accelerating urbanization, urban transportation systems face increasing challenges. Ride-hailing services have gained widespread popularity due to their flexibility and convenience, yet their rapid growth has also led to traffic congestion, resource inefficiency, environmental impacts, and operational issues such as inaccurate dispatching and difficulty in booking rides. Accurate ride-hailing demand forecasting is therefore crucial for optimizing vehicle allocation, improving operational efficiency, reducing empty mileage, and supporting urban traffic management and policy-making.
Existing research has proposed various Origin-Destination (OD) demand forecasting methods that integrate spatiotemporal features, including spatiotemporal-based dispatching strategies, OD correlation-aware prediction models, higher-order data tensor modeling, and deep attention-based networks [1-3]. These studies demonstrate that incorporating OD spatiotemporal correlations and leveraging large-scale transportation data can significantly enhance predictive accuracy. Recently, Grid-LSTM models have attracted attention for their ability to capture spatiotemporal dependencies, though their applicability in complex real-world traffic scenarios requires further investigation [4-6].
This study builds on Grid-LSTM modeling and employs the April 2015 New York City green taxi dataset, which retains precise latitude—longitude information, unlike later datasets that only provide zone identifiers. The availability of exact coordinates enables higher-resolution OD flow analysis, spatial clustering, and spatiotemporal prediction, enhancing both analytical precision and model interpretability.
1.2. Research objectives and approach
This study utilizes the April 2015 New York City green taxi trip dataset and applies data processing through the Python programming language to forecast taxi Origin-Destination (OD) demand. The research begins with data filtering and preprocessing, followed by an analysis of the spatiotemporal characteristics of ride-hailing demand. The urban traffic zones are then gridded, dividing the city into multiple smaller subareas to enable more precise analysis and prediction of taxi demand within each zone. Based on this spatial division, a single-zone demand forecasting model is developed. Using a one-step-ahead prediction approach, the model forecasts taxi demand in each time interval, where OD demand is defined as the number of orders per unit time interval per unit area. Specifically, the model leverages historical data to predict demand for a future time period (e.g., every 30 minutes), facilitating real-time dispatch and vehicle allocation. Finally, case studies are conducted to verify the model’s effectiveness when applied to real-world data.
2. Data preprocessing
2.1. Handling abnormal orders
When processing taxi order data, we often encounter abnormal situations that may not align with the actual conditions or are caused by technical issues, such as mismatched pickup and drop-off times, erroneous orders, or orders where the pickup or drop-off points are outside the research area, or where the distance between the pickup and drop-off points has no real significance. To address these issues, the first step is to handle the abnormal orders in the data that have already had duplicates removed.
2.1.1. Time data
The time data in the orders includes lpep_pickup_datetime and lpep_dropoff_datetime, which record the passenger's pickup and drop-off times, respectively. First, the start and end times of the orders are converted into Pandas timestamps, and the time span for each order is calculated in seconds. Descriptive statistics of the time span data are then used to determine the threshold for abnormal values. Specifically, it was found that 99% of the orders have a time span below a certain threshold. Based on this observation, orders with a time span shorter than 2 minutes or longer than 2 hours are considered abnormal and are removed [7, 8]. This step helps ensure the accuracy and reliability of the dataset, providing a solid foundation for subsequent analysis.
2.1.2. Spatial data
Distance Data: The trip distance in each order, recorded in the Trip_distance field, represents the travel length of the trip. First, descriptive statistical analysis was conducted on this field to determine the appropriate filtering thresholds. Based on the statistical results, the 3rd percentile and the 99th percentile were selected as the lower and upper bounds, respectively. Specifically, trips with a distance less than 0.07 miles or greater than 15 miles were identified as abnormal and removed from the dataset [9, 10]. This step eliminates exceptional cases and erroneous system records, thereby ensuring the accuracy and reliability of the distance data.
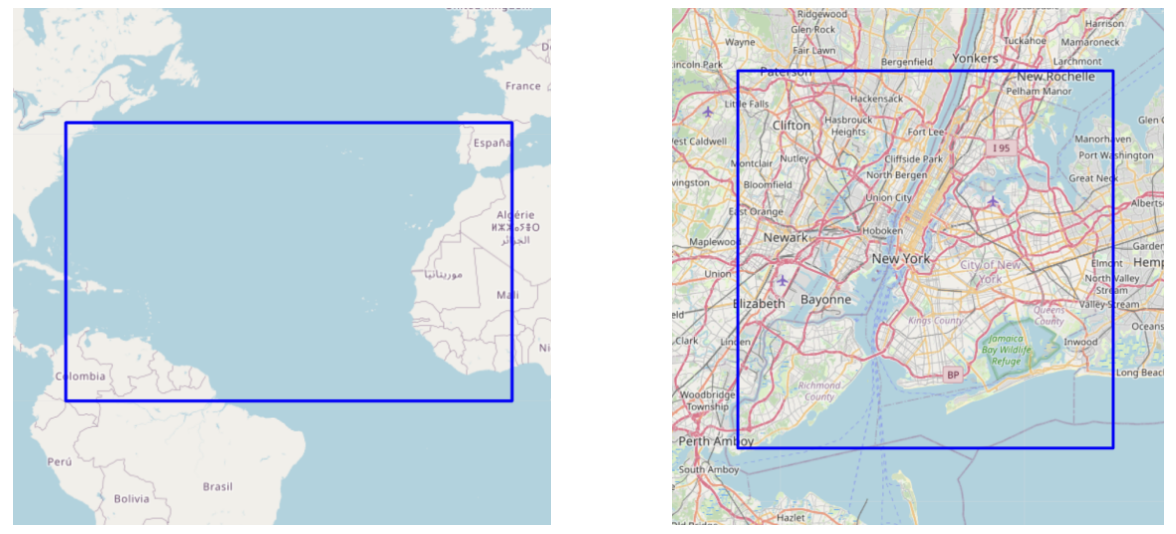
Latitude-Longitude Data: The dataset contains geographic coordinates for pick-up and drop-off locations, recorded in the fields Pickup_longitude, Pickup_latitude, Dropoff_longitude, and Dropoff_latitude. Descriptive statistical analysis was performed, and the coordinates were filtered according to the actual geographic range of New York City (latitude: 40.4774°-40.9176°, longitude: -74.2591° to -73.7004°) to ensure spatial accuracy and consistency. This procedure guarantees that all records fall within the city’s geographic boundaries, focusing the analysis on the study area (see Figure 1).
2.2. Data aggregation
2.2.1. Spatial gridding
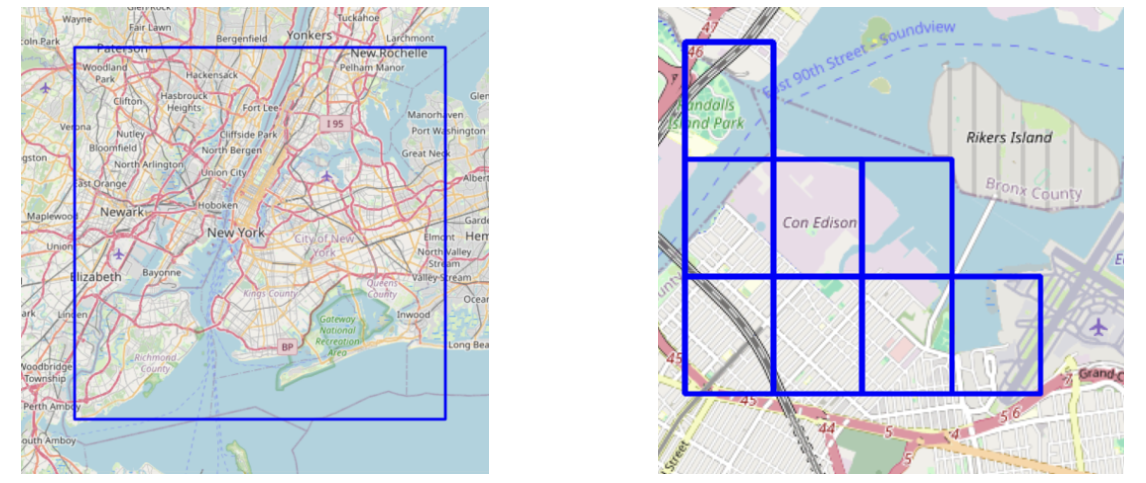
To facilitate the analysis and processing of taxi trip data, the geographic location information was first converted into a grid-based representation. Specifically, latitude–longitude coordinates were transformed into grid indices, with each grid cell measuring 0.01 degrees in both latitude and longitude. This approach converts continuous geographic coordinates into discrete spatial data, making them easier to process and analyze. By mapping the pick-up and drop-off coordinates to grid indices, it becomes possible to efficiently compute the number of taxi trips and trip characteristics within each grid cell, thereby laying the foundation for the development of the subsequent demand forecasting model. A local view of the gridding result is shown in Figure 2.
2.2.2. Temporal aggregation
Taxi trip records were aggregated into fixed 30-minute intervals to calculate the number of pick-ups and drop-offs in each grid cell for each interval. This was achieved by processing the trip timestamps to assign the start and end times of each order to the corresponding half-hour period. The aim of this step is to better capture temporal patterns in taxi activities and demand characteristics, providing a solid data foundation for the forecasting model.
2.2.3. Aggregation of additional features
Date Type—By analyzing the temporal attributes of the trip data, each grid-pair in each 30-minute interval was assigned a date type (weekday or non-weekday). This enables the exploration of variations in travel distances across different areas and times, serving as a reference for taxi dispatch and service scheduling.
Time of Day—Based on the temporal attributes of the trip data, each grid in every 30-minute interval was assigned a corresponding time of day. This feature assists in evaluating traffic congestion levels across different regions at various times, thereby supporting more effective taxi operation planning.
3. Feature engineering
3.1. Temporal feature analysis
Based on the preprocessed valid taxi trip records, mathematical and statistical methods were employed to analyze the variation in taxi order volumes across different date types and different time periods within a day. This allowed us to identify the daily variation patterns of taxi demand in New York City and the variation trends across different time periods within the same date type, thereby determining ride-hailing peak hours [5, 11]. Ultimately, the temporal analysis provides insights into the travel patterns of urban residents using ride-hailing services.
3.1.1. Weekly variation in taxi order volumes
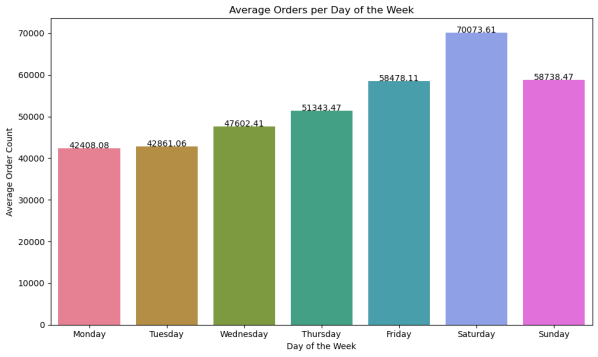
Using the cleaned April 2015 taxi trip dataset for New York City, the total daily demand volume was calculated for the entire month. Figure 3 presents the daily variation in total orders from April 1 to April 30, 2015. From Figure 4, it can be observed that the daily demand for ride-hailing services in April 2015 exhibits a clear periodic pattern, with a noticeable cycle of approximately one week. Within each week, weekend demand is higher than weekday demand, with Saturday recording the highest volume, reaching 70,000 orders. This suggests that Saturdays see increased taxi usage, likely due to greater leisure time and more travel plans. From Monday to Friday, demand gradually increases, peaking on Friday, before sharply decreasing on Sunday. However, Sunday demand still remains higher than that of Friday. This pattern can be explained by the increased travel needs during weekends, leading to higher demand on Friday, Saturday, and Sunday, while demand from Monday to Thursday remains relatively lower.
3.1.2. Daily variation in taxi order volumes
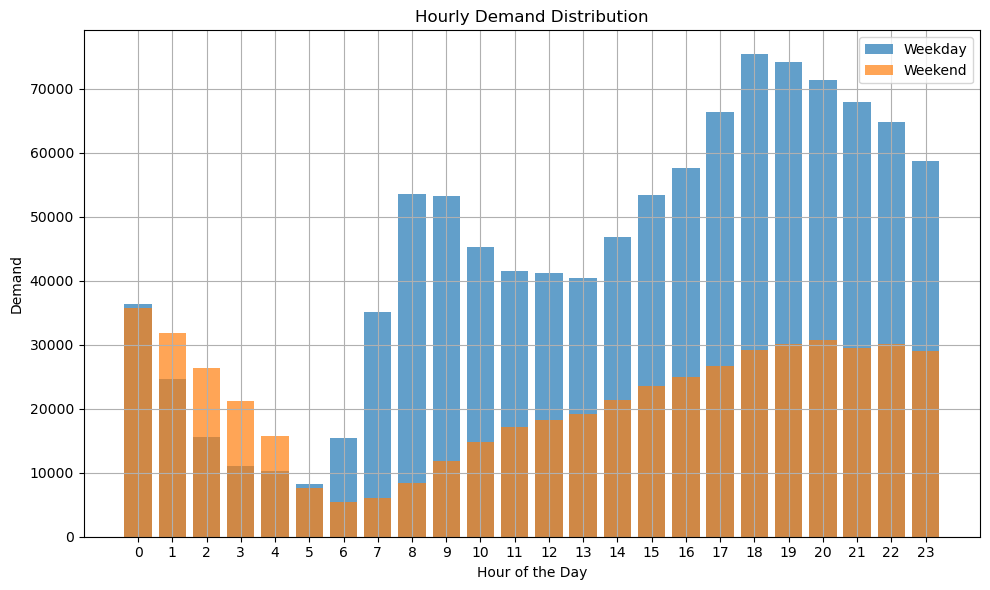
This section analyzes the average hourly demand patterns for different date types (weekday vs. weekend) within a week in April 2015. Here, the demand for a given hour refers to the total number of orders between that hour and the following hour. For example, the demand at 8:00 represents the total orders placed between 8:00 and 9:00. The statistical results are shown in Figure 5.
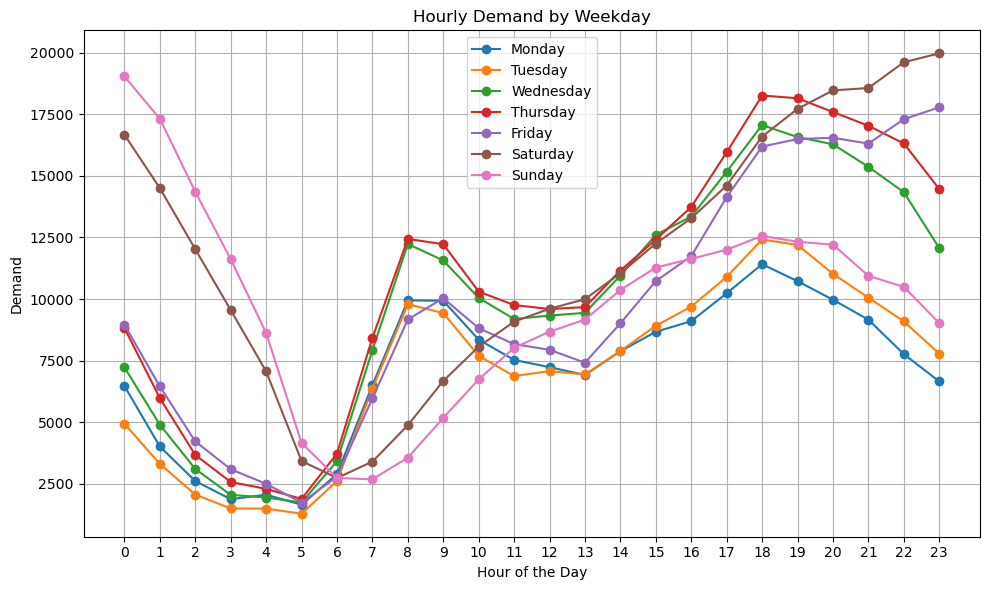
From Figure 5, it can be seen that while there are differences in ride-hailing demand between weekdays and weekends, the overall intra-day trend is relatively consistent. On weekdays (Monday-Friday), demand steadily declines from midnight until around 5:00 or 6:00, reaching an early morning low point—likely due to most residents being asleep at that time. From 5:00 (or 6:00) onward, demand increases sharply, peaking at around 8:00, which is assumed to correspond to the morning commute rush hour. This is followed by a drop to a midday low around 12:00-13:00, likely associated with lunch and rest breaks. Demand then rises again, reaching a second peak at around 18:00, corresponding to the evening commute period.
On weekends, although the specific pattern differs from weekdays (Figure 6), there is still a noticeable low point around 6:00-7:00 and a high point in the evening around 18:00.
3.2. Spatial feature analysis
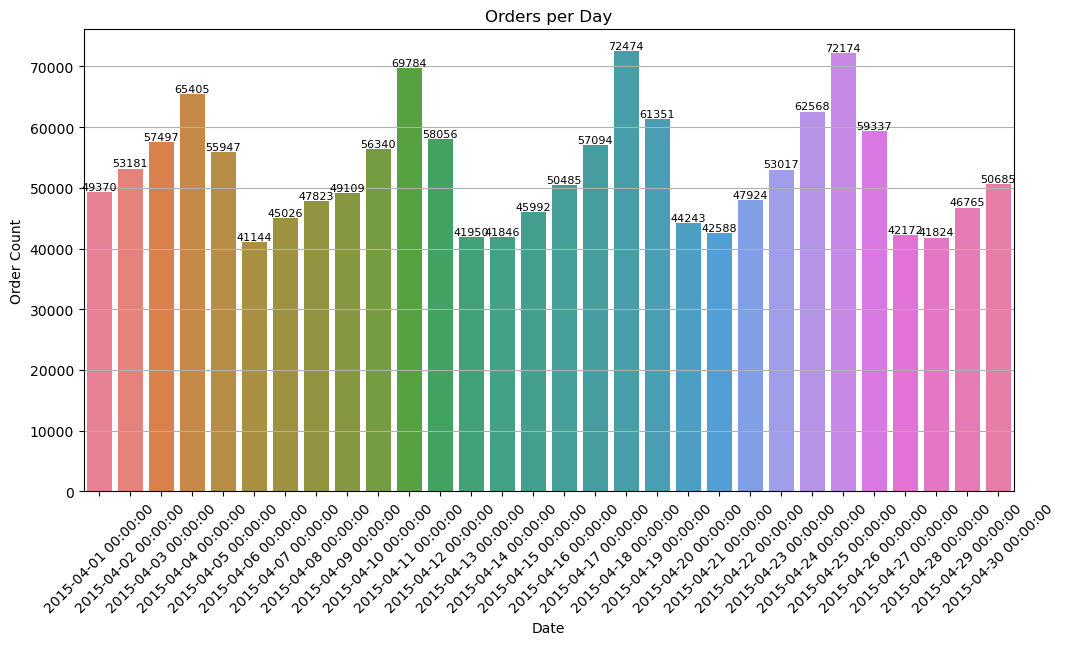
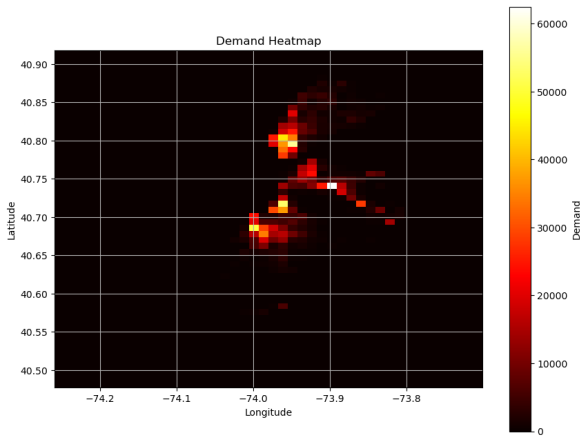
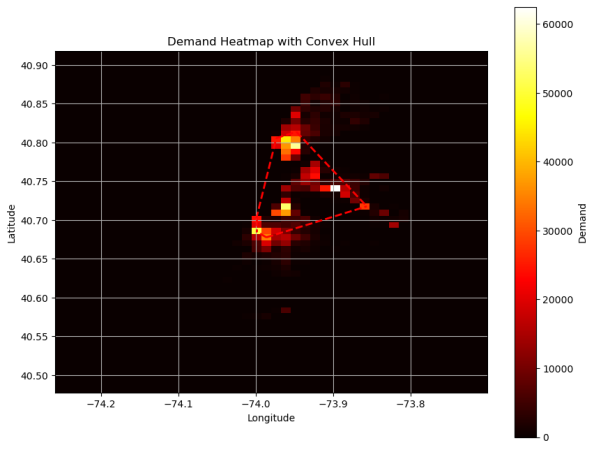
Using the April 2015 New York City taxi trip dataset, the study area was divided into grids (each with dimensions 44 × 56), and the total order demand was aggregated for each grid cell. The spatial distribution of taxi demand is shown in Figure 7. Based on Figure 7, the study area was further narrowed by applying a convex hull to focus on regions with high demand (greater than 20,000 orders). The resulting research area is shown in Figure 8 [12].
4. Grid-LSTM–based single-region OD taxi demand prediction model
The Grid-LSTM-based single-region Origin-Destination (OD) taxi demand prediction model combines grid-based spatial partitioning with a Long Short-Term Memory (LSTM) neural network to accurately predict taxi demand between OD pairs in urban areas. In this approach, the city is divided into spatial grids, and historical passenger flow data for each grid cell is collected. The LSTM network is then trained on these time-series data to capture both long-term and short-term dependencies, thereby improving prediction accuracy. Compared with traditional methods, the Grid-LSTM model better reflects the spatiotemporal variation characteristics of taxi demand, enabling more efficient taxi dispatching and enhancing urban traffic management.
Grid partitioning converts continuous geospatial data into discrete grids, simplifying data processing and making spatial analysis more efficient. LSTM, as a powerful Recurrent Neural Network (RNN) variant, utilizes memory cells and gating mechanisms to effectively capture long-term dependencies in time series, addressing the vanishing gradient problem in traditional RNNs, and is particularly well suited for forecasting tasks.
The novelty of the Grid-LSTM approach lies in replacing traditional latitude–longitude coordinates with grid-based spatial encoding [13]. This not only simplifies data representation and reduces computational costs, but also captures localized spatial features of the city more precisely. Moreover, the use of grid encoding improves model interpretability, as predictions directly correspond to specific spatial regions, which is beneficial for transportation management and decision-making.
5. Experimental design
5.1. Dataset description
The study area is divided into grid cells, each with a spatial resolution of 0.01° in both latitude and longitude. Based on the analysis of ride-hailing demand in the study area, a continuous hotspot region (highlighted in red in Figure 4-6) is selected as the experimental instance for constructing a single-region, single-step demand forecasting model.
A 30-minute temporal granularity is adopted, as it provides a sufficiently detailed description of traffic conditions in the region and allows adequate time for real-time decision-making and operational adjustments. To evaluate the generalization ability of the model, the dataset is split into a training set and a testing set. The data are sourced from green taxi trip records in the selected region between April 1 and April 30, 2015.
The forecasting task is designed with a 2-hour historical window to predict the demand for the next single time step (30 minutes). Thus, the model output is the predicted demand volume for the upcoming 30-minute interval.
5.2. Hardware and software environment
Experiments are conducted on a desktop computer equipped with an Intel Core i7 processor (3.5 GHz), 16 GB RAM, and an NVIDIA GeForce RTX 2080 Ti GPU. The operating system used is Ubuntu 20.04 LTS. For the software environment, Python 3.8.5 is used as the primary programming language. The main machine learning frameworks include TensorFlow 2.4.1, Scikit-learn 0.24.1, and PyTorch 1.8.1. Jupyter Notebook is used as the development and documentation environment.
5.3. Experimental results
5.3.1. Comparative experiments
Five models are employed for comparison: Decision Tree (DT), a decision-tree-based ensemble method Jungle BinData Team (JBDT), Support Vector Machine (SVM), Random Forest (RF), and the proposed Grid-LSTM model. The models are evaluated in four aspects: Mean Squared Error (MSE), Root Mean Squared Error (RMSE), the goodness of fit between predicted and actual values, and computation time (Table 1).
|
Model |
MSE |
RMSE |
Computation time(s) |
|
DT |
0.176 |
0.420 |
6.817 |
|
JBDT |
4.652 |
2.157 |
185.84 |
|
SVM |
232.8 |
- |
304 |
|
RF |
0.139 |
0.372 |
544.35 |
|
LSTM |
2.215 |
1.488 |
- |
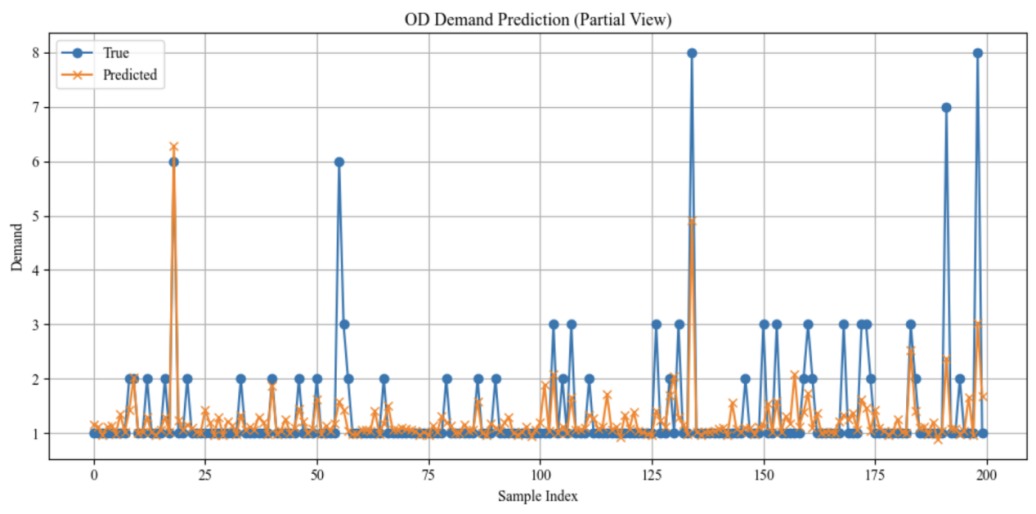
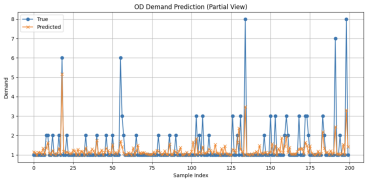
Among the comparison models, the Decision Tree (DT) achieved the highest goodness of fit, with an R2 value of 0.976. However, visualization results indicate that its performance deteriorates when processing smaller feature values. The decision-tree-based ensemble method exhibited a relatively low degree of fit, with an R2 value of approximately 0.35, and its runtime was significantly longer than that of the single Decision Tree. Both the Support Vector Machine (SVM) and Random Forest (RF) models performed poorly in terms of prediction accuracy and required even longer computation times.
In contrast, although the Grid-LSTM model produced a slightly lower R2 value than the Decision Tree, visualization results show that it performs better in handling smaller feature values. Therefore, when considering both accuracy and robustness, the Grid-LSTM model is determined to be the optimal choice (Table 2).
|
DT 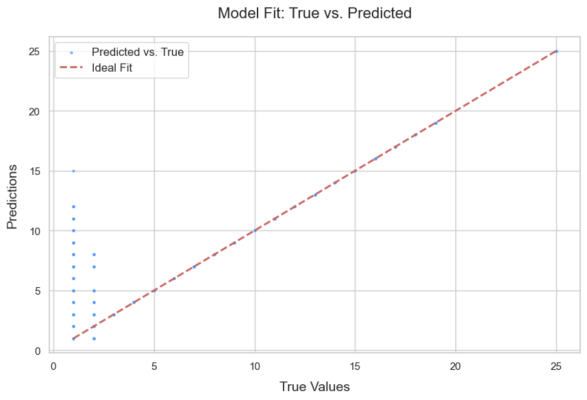 |
JBDT 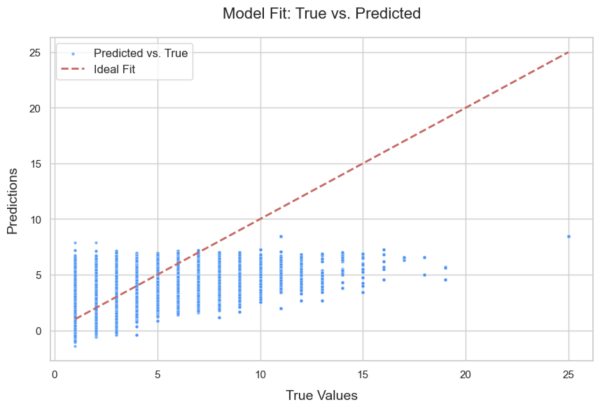 |
|
RF |
SVM |
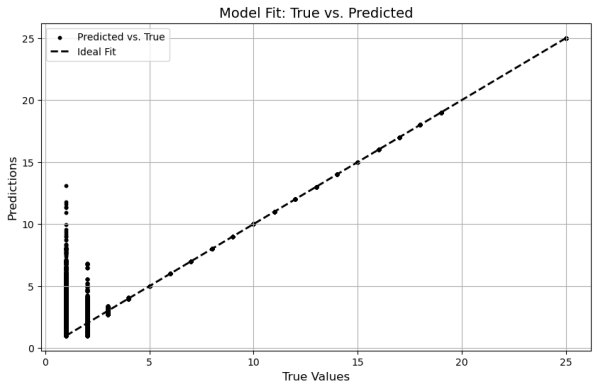 |
 |
|
LSTM |
|
 |
|
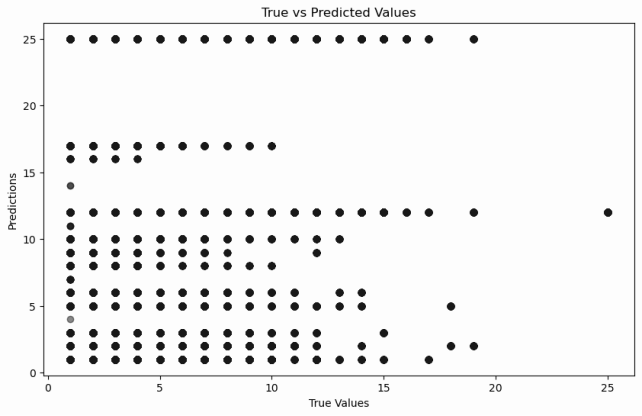
5.3.2. Ablation study
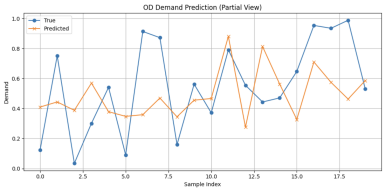
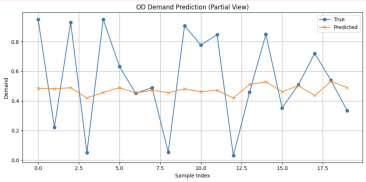
An ablation study was conducted on the Grid-LSTM model to evaluate the contributions of different network components. The results indicate that removing either the LSTM layer or the Dense layer leads to a decrease in RMSE values; however, the overall goodness of fit drops significantly. This demonstrates that both the LSTM layer and the Dense layer have a substantial impact on the model’s predictive accuracy (Table 3).
|
Not to be removed |
Remove the LSTM layer |
Remove the Dense layer |
|
|
True vs Predict |
 |
 |
 |
|
RMSE |
0.6682 |
0.2993 |
0.3033 |
6. Conclusion
Through this study, we successfully constructed a single-region taxi OD demand forecasting model based on LSTM and validated it using the New York City taxi trip dataset from April 2015. In the experiments, we compared the performance of Decision Tree (DT), a decision-tree-based ensemble method (JBDT), Support Vector Machine (SVM), Random Forest (RF), and the grid-based LSTM model, and evaluated them in terms of MSE, RMSE, goodness of fit, and computation time.The results show that the Decision Tree model achieved the best overall fit in predicting taxi demand but performed poorly when dealing with smaller feature values. This may be because Decision Trees are effective at capturing nonlinear relationships in data and can be trained relatively quickly. In contrast, the LSTM-based model demonstrated advantages in capturing temporal dependencies, showing the most stable performance in this experiment with better robustness. Overall, this work provides a new perspective and method for taxi demand forecasting, but it still has some limitations and room for improvement. For example, the dataset used is relatively limited, focusing only on New York City data from April 2015, which restricts cross-period and multi-city validation. Moreover, external factors such as weather conditions, holidays, and unexpected events were not included, which may affect predictive accuracy. In addition, this study only conducted one-step forecasting, while multi-step and long-term demand prediction remain underexplored.
Future research could be expanded in several directions. First, incorporating more external data sources (e.g., weather, traffic incidents, and large-scale events) could enhance the robustness and adaptability of the model. Second, exploring advanced deep learning architectures, such as Graph Neural Networks (GNNs) and Transformer-based models, may further improve the ability to capture complex spatiotemporal dependencies. Third, extending the analysis to multi-region and cross-city datasets could help validate the scalability and generalization ability of the model. Finally, integrating online learning and real-time prediction capabilities would provide stronger support for dynamic dispatching and operational decision-making. In conclusion, this study contributes to optimizing taxi dispatching and improving the efficiency of urban transportation systems, while also offering useful insights for future research in this field.
References
[1]. Geng, X., Li, Y., Wang, L., Zhang, L., Yang, Q., Ye, J., & Liu, Y. (2019). Spatiotemporal Multi-Graph Convolution Network for Ride-Hailing Demand Forecasting.Proceedings of the AAAI Conference on Artificial Intelligence, 33(01), 3656–3663. https: //doi.org/10.1609/aaai.v33i01.33013656
[2]. Jiang, W., & Luo, J. (2022). Graph neural network for traffic forecasting: A survey.Expert Systems with Applications, 207, 117921. https: //doi.org/10.1016/j.eswa.2022.117921
[3]. Li, W. (2024). Research on ride-hailing dispatch strategy based on spatiotemporal demand (Master’s thesis, Zhejiang University of Science and Technology). https: //doi.org/10.27840/d.cnki.gzjkj.2024.000189
[4]. Liu, T. (2023). Data-driven analysis of intercity travel patterns and OD demand forecasting in urban agglomerations (Master’s thesis, Beijing Jiaotong University). https: //doi.org/10.26944/d.cnki.gbfju.2023.000217
[5]. Luo, H., Cai, J., Zhang, K., Xie, R., & Zheng, L. (2021). A multi-task deep learning model for short-term taxi demand forecasting considering spatiotemporal dependences.Journal of Traffic and Transportation Engineering (English Edition), 8(1), 83–94. https: //doi.org/10.1016/j.jtte.2019.07.002
[6]. Peng, D., Huang, M., & Xing, Z. (2023). Taxi origin and destination demand prediction based on deep learning: a review.Digital Transportation and Safety, 2(3), 176–189. https: //doi.org/10.48130/dts-2023-0014
[7]. Shen, H. (2022). Ride-hailing OD demand forecasting based on generative adversarial networks (Master’s thesis, Central South University). https: //doi.org/10.27661/d.cnki.gzhnu.2022.003403
[8]. Su, J. (2022). Data-driven taxi OD demand forecasting and visual analysis system (Master’s thesis, Beijing University of Technology). https: //doi.org/10.26935/d.cnki.gbjgu.2022.000375
[9]. Shen, L. (2023). Short-term subway OD passenger flow forecasting based on deep learning (Master’s thesis, Zhejiang University). https: //doi.org/10.27461/d.cnki.gzjdx.2023.000476
[10]. Tan, X. (2022). OD demand estimation of private cars based on large-scale checkpoint data (Master’s thesis, Southeast University). https: //doi.org/10.27014/d.cnki.gdnau.2022.004517
[11]. Wei, Y. (2023). Inter-regional taxi demand forecasting method integrating OD spatiotemporal correlations (Master’s thesis, Beijing Jiaotong University). https: //doi.org/10.26944/d.cnki.gbfju.2023.003017
[12]. Zhai, Y. (2023). OD demand forecasting method for ride-hailing based on higher-order data tensors (Master’s thesis, Jilin Institute of Chemical Technology). https: //doi.org/10.27911/d.cnki.ghjgx.2023.000113
[13]. Zhou, Z. (2023). Urban traffic OD estimation and forecasting based on deep attention neural networks (Master’s thesis, Yangzhou University). https: //doi.org/10.27441/d.cnki.gyzdu.2023.003204
Cite this article
Ling,M. (2025). Taxi single-region OD demand forecasting model based on Grid-LSTM. Advances in Engineering Innovation,16(8),58-66.
Data availability
The datasets used and/or analyzed during the current study will be available from the authors upon reasonable request.
Disclaimer/Publisher's Note
The statements, opinions and data contained in all publications are solely those of the individual author(s) and contributor(s) and not of EWA Publishing and/or the editor(s). EWA Publishing and/or the editor(s) disclaim responsibility for any injury to people or property resulting from any ideas, methods, instructions or products referred to in the content.
About volume
Journal:Advances in Engineering Innovation
© 2024 by the author(s). Licensee EWA Publishing, Oxford, UK. This article is an open access article distributed under the terms and
conditions of the Creative Commons Attribution (CC BY) license. Authors who
publish this series agree to the following terms:
1. Authors retain copyright and grant the series right of first publication with the work simultaneously licensed under a Creative Commons
Attribution License that allows others to share the work with an acknowledgment of the work's authorship and initial publication in this
series.
2. Authors are able to enter into separate, additional contractual arrangements for the non-exclusive distribution of the series's published
version of the work (e.g., post it to an institutional repository or publish it in a book), with an acknowledgment of its initial
publication in this series.
3. Authors are permitted and encouraged to post their work online (e.g., in institutional repositories or on their website) prior to and
during the submission process, as it can lead to productive exchanges, as well as earlier and greater citation of published work (See
Open access policy for details).
References
[1]. Geng, X., Li, Y., Wang, L., Zhang, L., Yang, Q., Ye, J., & Liu, Y. (2019). Spatiotemporal Multi-Graph Convolution Network for Ride-Hailing Demand Forecasting.Proceedings of the AAAI Conference on Artificial Intelligence, 33(01), 3656–3663. https: //doi.org/10.1609/aaai.v33i01.33013656
[2]. Jiang, W., & Luo, J. (2022). Graph neural network for traffic forecasting: A survey.Expert Systems with Applications, 207, 117921. https: //doi.org/10.1016/j.eswa.2022.117921
[3]. Li, W. (2024). Research on ride-hailing dispatch strategy based on spatiotemporal demand (Master’s thesis, Zhejiang University of Science and Technology). https: //doi.org/10.27840/d.cnki.gzjkj.2024.000189
[4]. Liu, T. (2023). Data-driven analysis of intercity travel patterns and OD demand forecasting in urban agglomerations (Master’s thesis, Beijing Jiaotong University). https: //doi.org/10.26944/d.cnki.gbfju.2023.000217
[5]. Luo, H., Cai, J., Zhang, K., Xie, R., & Zheng, L. (2021). A multi-task deep learning model for short-term taxi demand forecasting considering spatiotemporal dependences.Journal of Traffic and Transportation Engineering (English Edition), 8(1), 83–94. https: //doi.org/10.1016/j.jtte.2019.07.002
[6]. Peng, D., Huang, M., & Xing, Z. (2023). Taxi origin and destination demand prediction based on deep learning: a review.Digital Transportation and Safety, 2(3), 176–189. https: //doi.org/10.48130/dts-2023-0014
[7]. Shen, H. (2022). Ride-hailing OD demand forecasting based on generative adversarial networks (Master’s thesis, Central South University). https: //doi.org/10.27661/d.cnki.gzhnu.2022.003403
[8]. Su, J. (2022). Data-driven taxi OD demand forecasting and visual analysis system (Master’s thesis, Beijing University of Technology). https: //doi.org/10.26935/d.cnki.gbjgu.2022.000375
[9]. Shen, L. (2023). Short-term subway OD passenger flow forecasting based on deep learning (Master’s thesis, Zhejiang University). https: //doi.org/10.27461/d.cnki.gzjdx.2023.000476
[10]. Tan, X. (2022). OD demand estimation of private cars based on large-scale checkpoint data (Master’s thesis, Southeast University). https: //doi.org/10.27014/d.cnki.gdnau.2022.004517
[11]. Wei, Y. (2023). Inter-regional taxi demand forecasting method integrating OD spatiotemporal correlations (Master’s thesis, Beijing Jiaotong University). https: //doi.org/10.26944/d.cnki.gbfju.2023.003017
[12]. Zhai, Y. (2023). OD demand forecasting method for ride-hailing based on higher-order data tensors (Master’s thesis, Jilin Institute of Chemical Technology). https: //doi.org/10.27911/d.cnki.ghjgx.2023.000113
[13]. Zhou, Z. (2023). Urban traffic OD estimation and forecasting based on deep attention neural networks (Master’s thesis, Yangzhou University). https: //doi.org/10.27441/d.cnki.gyzdu.2023.003204