


1. Introduction
Urban areas worldwide are warming faster than their rural surroundings, thanks largely to impervious surfaces, dense building clusters, and waste heat from vehicles and buildings. Urban Heat Island (UHI) effect in urban areas is prevalent in the world [1-3]. UHI is a consequence of the greater absorption of electromagnetic energy and the slow cooling of urbanized surfaces compared to surrounding areas with the presence of vegetation. This phenomenon causes built environments to experience significantly higher temperatures than their rural surroundings. Today, more than half of humanity faces higher heat risks, and in the United States routinely register elevated urban temperatures. Planting street trees and installing cool roofs and pavements are among the ways to reduce local heat islands [4, 5]. Tree canopies can lower both surface and ambient air temperatures on the street and neighborhood scales. Intercepting incoming solar radiation, providing surface shading, and driving evapotranspiration are also beneficial from tree intercept. In addition to cooling, urban trees deliver a range of co‐benefits, including improved air quality, enhanced carbon sequestration, stormwater management, and habitat provision. These all align closely with sustainable development goals. Therefore, strategic tree-planting designs and species choices are beneficial to reduce UHI effect for guiding resilient, low-carbon cities [6-9].
Over the past decade, studies have peeled back layer after layer of how urban trees really work with their cooling effect [10-13]. He et al. [14] provided information about the spatial-temporal features of trees' cooling under varied background temperature to inform the planning of urban trees under changing climate. Zhou et al. [15] quantified the associations between land surface temperature and social and biophysical characteristics for each city and compared the direction and strength of the associations among cities. Wang et al. [16] evaluated the effects of shade trees on the built environment, in terms of radiative cooling, pedestrian thermal comfort, and urban land surface energy balance over the contiguous United States. Konarska et al. [17] quantified the magnitude of daytime and night-time transpiration of common urban tree species in a high latitude city, to analyze the influence of weather conditions and surface permeability on the tree transpiration, and to find out whether tree transpiration contributed to daytime or nocturnal cooling. Rahman et al. [18] compared the performance, stress tolerance and cooling effectiveness of five commonly planted UK street tree species, which had been planted six years previously under similar soil conditions. Tan et al. [19] delineated design strategies for urban greenery to maximize thermal benefits and mitigate the daytime urban heat island effect. Wang et al. [20] investigated the spatial variation of cooling efficiency across biomes in the continental USA, and how it is affected by ecological context. Wang et al. [21] used the remotely sensed data to quantify the cooling capacity of urban trees in major cities of the contiguous U.S. in response to thermal extremes. Yet most simulation efforts lean on brief weather snapshots, and few tie in multi‐seasonal field data. That leaves open questions about year-round performance and resilience. Urban forestry studies have steadily uncovered benefits in terms of carbon dioxide, air pollution, stormwater impacts and energy savings. However, quantitative estimates of these benefits specifically for mitigating urban heat islands remain scarce [22-25]. Pulling these UHI-specific figures with tree beneficial estimation may give planners a concrete playbook for choosing the right trees, spacing, and layouts to maximize both comfort and wider environmental benefits.
In this study, eco-benefits of planting a single street tree at the maximum UHI hotspot in 20 U.S. cities are evaluated. Hotspots are identified using a composite UHI index and per-tree services are estimated for their eco-benefits over the next 30 years (2025 to 2055). The species growth, shading/wind-break energy effects, rainfall interception, and pollutant fluxes are considered and monetized with local utility rates, stormwater fees, the Social Cost of Carbon, and health-valuation factors.
2. Materials and methods
2.1. Urban heat hot spots
The Urban Heat Island (UHI) index is used to quantify the intensity of urban heat. It is a factor that measures the increase of temperature in urban areas compared to its surrounding rural area. The composite UHI, IUHI, proposed by Sangiorgio et al. [26] is used. Four domains (Meteorological variables, Urban-surface characteristics, Anthropogenic heat, and Street-canyon geometry) with eleven diagnostic criteria are considered. Each criterion i is discretized into classes j, each assigned a local contribution weight wij. Global weights vi are initially derived via Analytic Hierarchy Process (AHP) pairwise comparisons and then jointly optimized with the wij through a jackknife-resampling calibration against peak IUHI measurements in the collected urban districts by minimizing prediction error. The index is computed as
Sangiorgio et al. [26] applied the IUHI methodology to over 37,000 census block groups across major U.S. metropolitan areas, which together are home to more than 50 million residents, to identify the neighborhoods with the highest urban heat intensity in each city. In this study, we select the single most heat-intensive census block in each of twenty U.S. cities based on block-level IUHI values. We then evaluate the effects of strategic tree planting in these hotspots by analyzing changes in building–environment interactions and by forecasting the environmental benefits.
2.2. Tree planting benefits estimation
The framework uses four mechanistic sub-models: growth and biomass allocation, energy balance (shading and wind break), hydrological interception, and pollutant flux to translate individual tree and site attributes into quantifiable ecosystem services. Per-tree outputs such as biomass growth, energy conserved, water retained, and pollutants removed are aggregated across the inventory, and the totals are monetized using region-specific unit prices for energy rates, stormwater fees, the social cost of carbon, and pollution externality valuations. By coupling allometric, radiative transfer, hydrological, and pollutant flux models, the framework provides a seamless bridge from tree morphology and local climate to both biophysical services and their economic equivalents.
Tree Diameter at Breast Height (DBH) is forecast year-over-year via species-specific power‐law growth [27, 28]:
where as and bs are fitted to long-term field measurements for species s (USDA Forest Service inventories). Aboveground biomass B (kg) is then estimated by
with αs, βs derived from meta-analyses of oven-dry weight regressions against DBH.
Cooling savings from intercepted solar radiation are computed by integrating instantaneous irradiance over canopy light attenuation [29, 30]:
where Srad(t) is incoming irradiance, LAI represents the leaf area index, and κ is an extinction coefficient calibrated separately for broadleaf and coniferous canopies [31]. Wind-break benefits follow a boundary-layer formulation that reduces heating loads as a function of canopy porosity and building-tree geometry [30].
Annual stormwater retention is modeled via lookup tables based on Xiao et al. [32]:
where cz,s is a retention coefficient specific to climate zone z and species s, Prain the total precipitation, and Acanopy the projected crown area. Coefficients cz,s are weighted averages of monthly field trials.
Removal of airborne pollutants follows:
with rp (g m⁻² yr⁻¹) compiled from urban flux-measurement studies by the U.S. Forest Service and EPA. Avoided emissions from reduced energy use are converted via regional emission factors (EPA eGRID).
All per-tree ecosystem services (biomass increment, energy conserved through shading and wind-break, stormwater retained via canopy interception, and air pollutants removed) are aggregated across the entire tree inventory, and the resulting physical totals are monetized by applying local utility energy rates to quantify heating and cooling savings; municipal stormwater fee schedules to value runoff reduction; the Social Cost of Carbon (e.g. $78.50 per ton of carbon) to convert carbon sequestration and avoidance into economic terms; and health-benefit valuation factors from EPA’s BenMAP and related externality studies to assign dollar values to pollutant removal [32-35]. In this study, i-Tree Design is used to estimate the biophysical and economic benefits of trees.
2.3. Procedure for tree at UHI hotspots
To evaluate the ecological and economic benefits of urban tree planting in heat-intensive environments, a standardized procedure was designed combining publicly available urban heat datasets with simulations conducted in the i-Tree Design platform. The workflow consisted of city and hotspot selection, tree type assignment, model setup, and 30-year benefit estimation for cross-city comparison.
1. Major U.S. cities were selected from the Urban Heat Hot Spots in 65 Cities dataset [36] developed by Climate Central and Brown University.
2. The hottest neighborhoods in each city were identified using the corresponding Urban Heat Island (UHI) maps, and their geographic coordinates were recorded as candidate planting sites.
3. Representative street tree species and typical Diameters at Breast Height (DBH) were obtained from municipal tree inventories and urban forestry databases to reflect common local planting practices.
4. Each hotspot location was entered into the i-Tree Design platform. Simulations assumed optimal growing conditions, including excellent tree health and full sun exposure. Trees were virtually placed along streets or in open areas where canopy growth is expected to yield maximum cooling and ecological benefits.
5. A standardized 30-year growth cycle (2025-2055) was applied across all sites to ensure consistency. Ecological benefits (e.g., carbon sequestration, pollutant removal, stormwater interception) and economic benefits (e.g., energy savings, avoided costs) were extracted from i-Tree outputs and aggregated over the 30-year horizon. Results were then compared across cities to evaluate spatial variation in projected benefits.
3. Results
3.1. Descriptive statistics
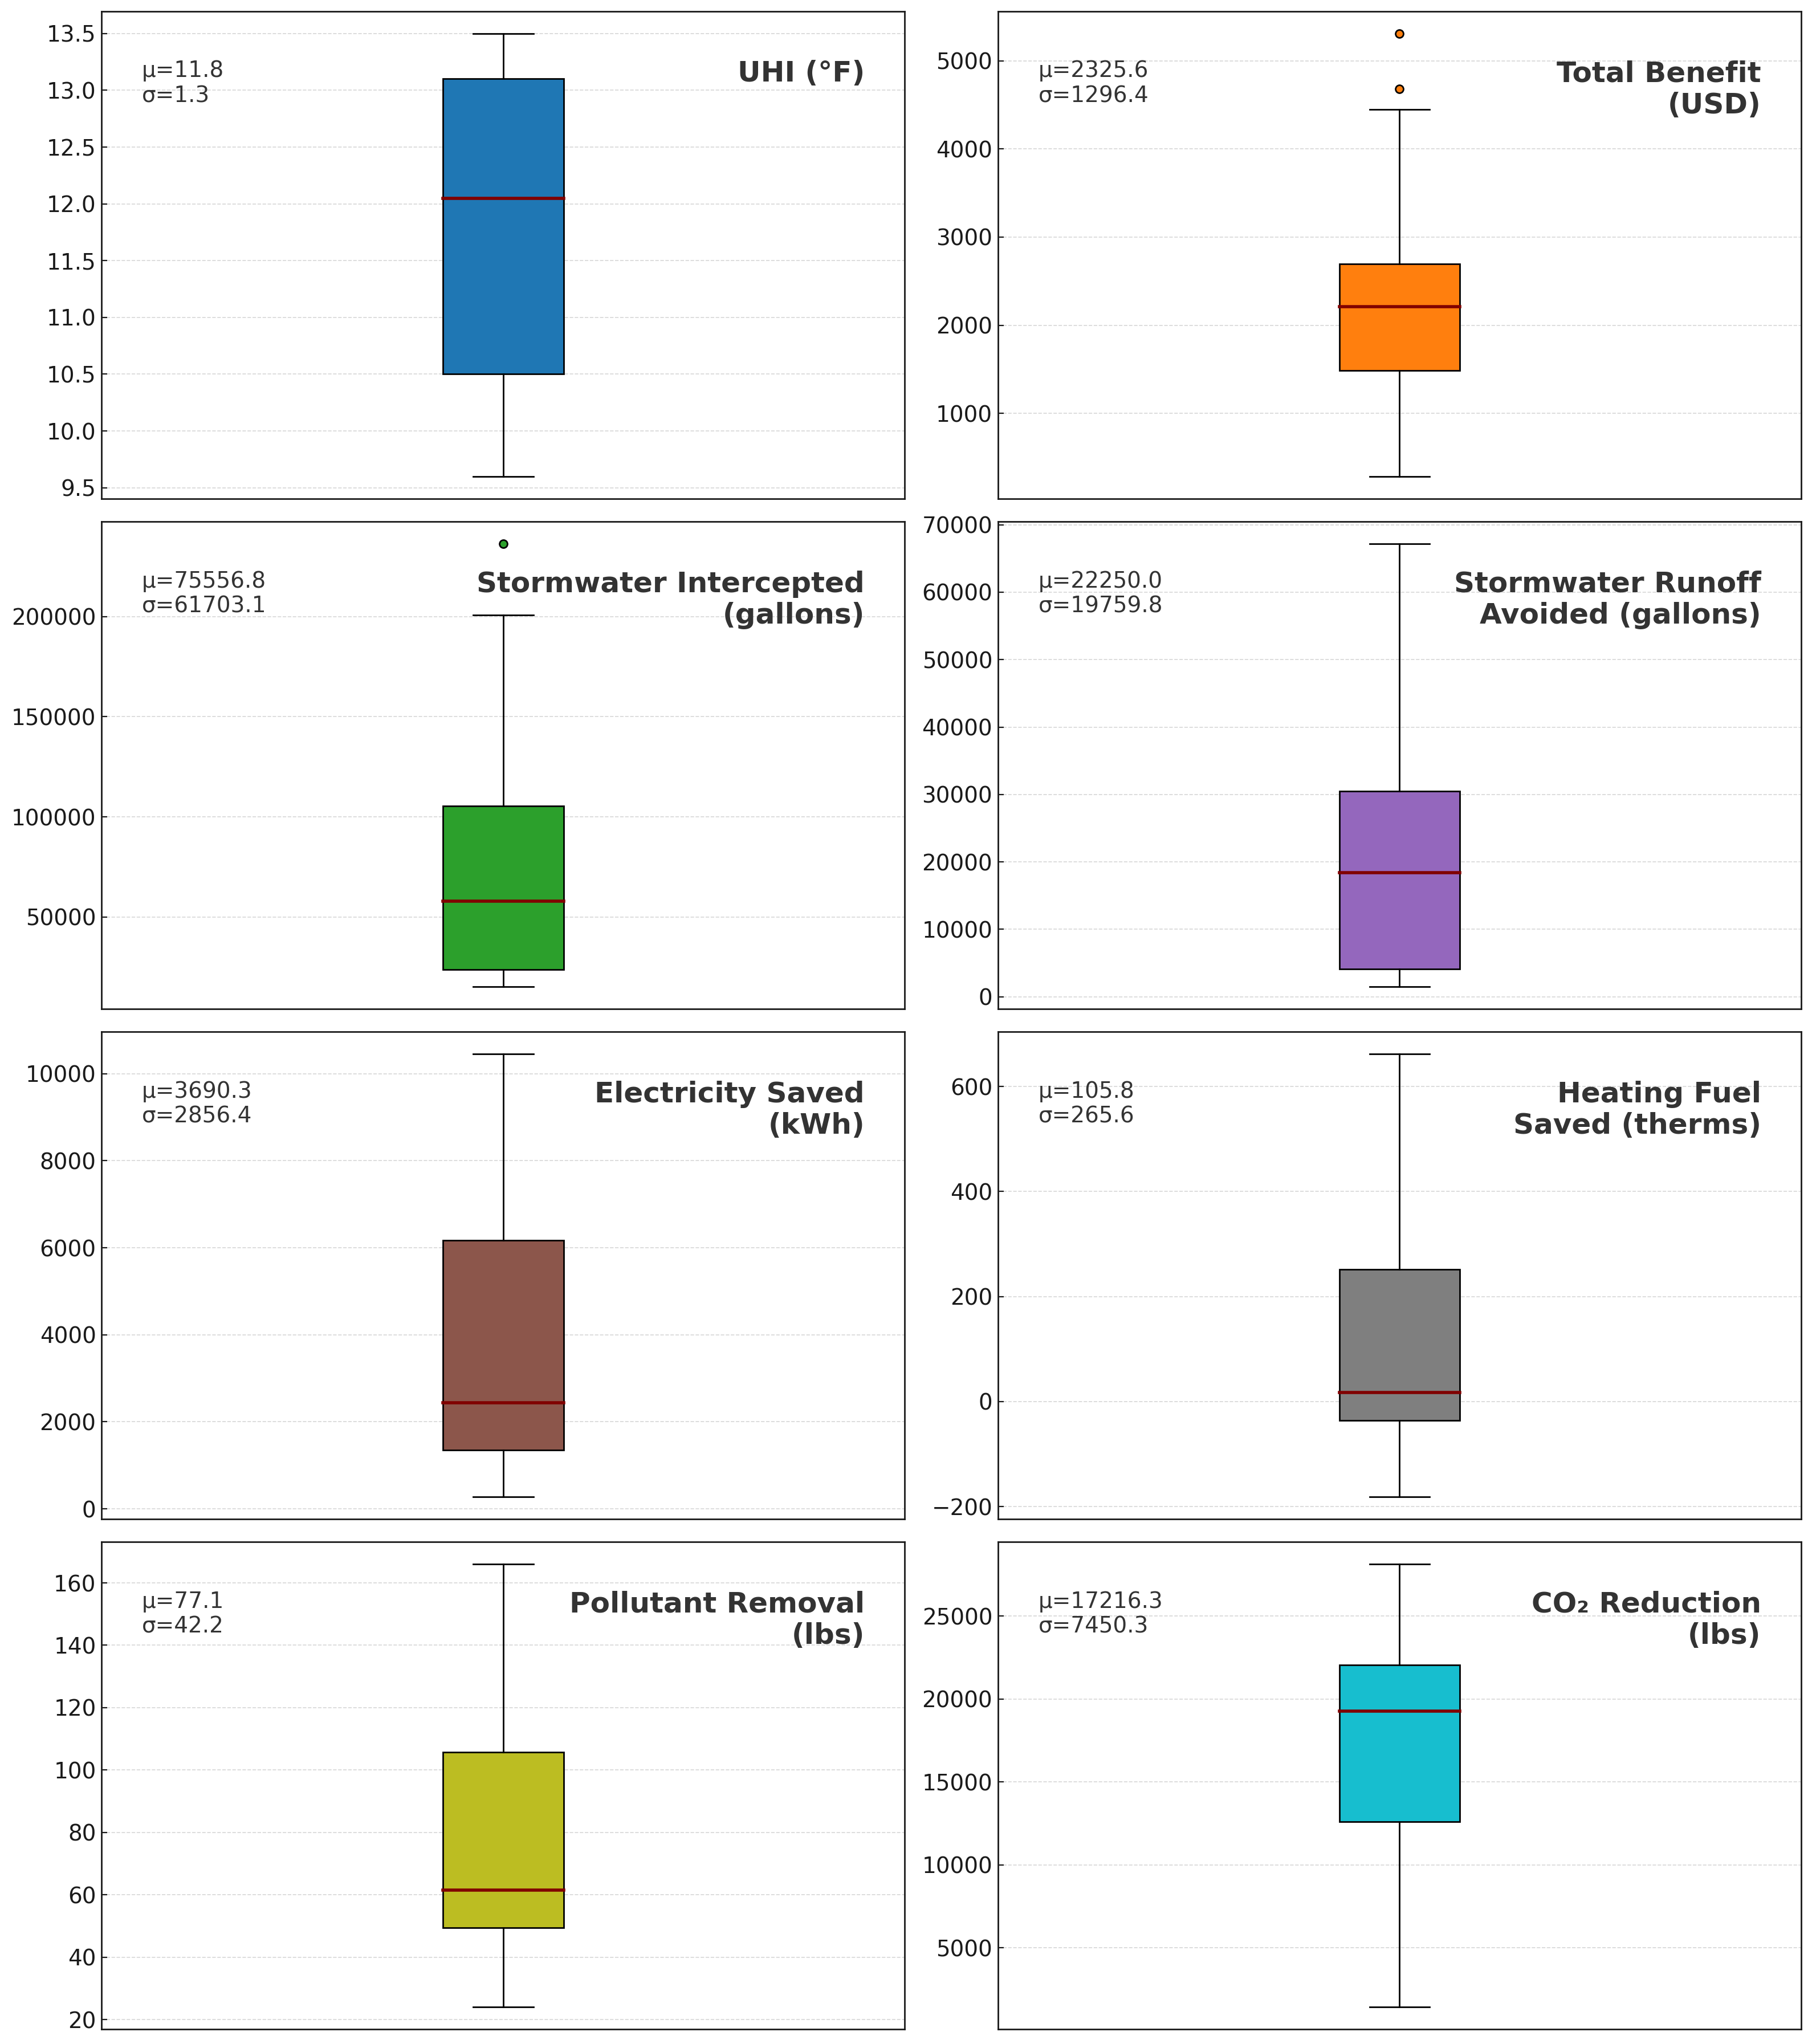
Figure 1 presents boxplots for eight key service metrics associated with planting a single street tree at each city’s maximum UHI hotspot for over the next 30 years. Overall, the greatest variation is observed in stormwater intercepted, while UHI displays the most stable values. Most variables demonstrate positively skewed distributions, with a few extreme outliers in categories such as total benefit and stormwater Intercepted. Stormwater intercepted has the highest average (μ = 75,556.8 gallons) and a substantial standard deviation (σ = 61,703.1 gallons), indicating a wide range of outcomes. Similarly, stormwater runoff avoided and CO₂ reduction also show large dispersions, implying variability in how benefits are realized. Conversely, UHI shows minimal variability (σ = 1.3°F), suggesting consistent performance across the samples. Electricity saved and pollutant removal also exhibit moderate variability, with means of 3,690.3 kWh and 77.1 lbs, respectively. It is worth noting that heating fuel saved includes negative values, indicating potential losses or inefficiencies in some instances. Total benefit (USD), although economically significant (μ = 2,235.6), shows several high outliers, reflecting uneven distribution of monetary benefits. These distributions reveal that while thermal relief is uniform, water, carbon, energy, and economic co‐benefits of a single tree at UHI hotspots vary substantially by locale.
3.2. Comparisons by city
Figure 2 compares the total monetary benefit (USD) of planting a single street tree at the highest UHI hotspot across twenty major U.S. cities for over the next 30 years. Benefits span more than an order of magnitude, from just $285 in San Diego and $645 in Los Angeles to over $5,300 in New York City. Most cities fall within the $1,000 to $3,000 range, but some clearly exceed or fall below this interval, standing out as outliers. This indicates that the economic impact of urban tree planting is heavily influenced by local environmental conditions and urban structure. Cities such as Boston, Columbus, Houston, and Oklahoma show moderate benefits ranging between $2,000 and $3,000, reflecting a balanced level of environmental and economic return. On the lower end, San Diego, with a benefit below $500, and Miami and Los Angeles, with values just under $1,000, demonstrate the least favorable cost-effectiveness for tree planting. This apparent variability suggests how local climate, rainfall patterns, and energy costs drive the financial value of urban‐tree ecosystem services in heat-island hotspots.
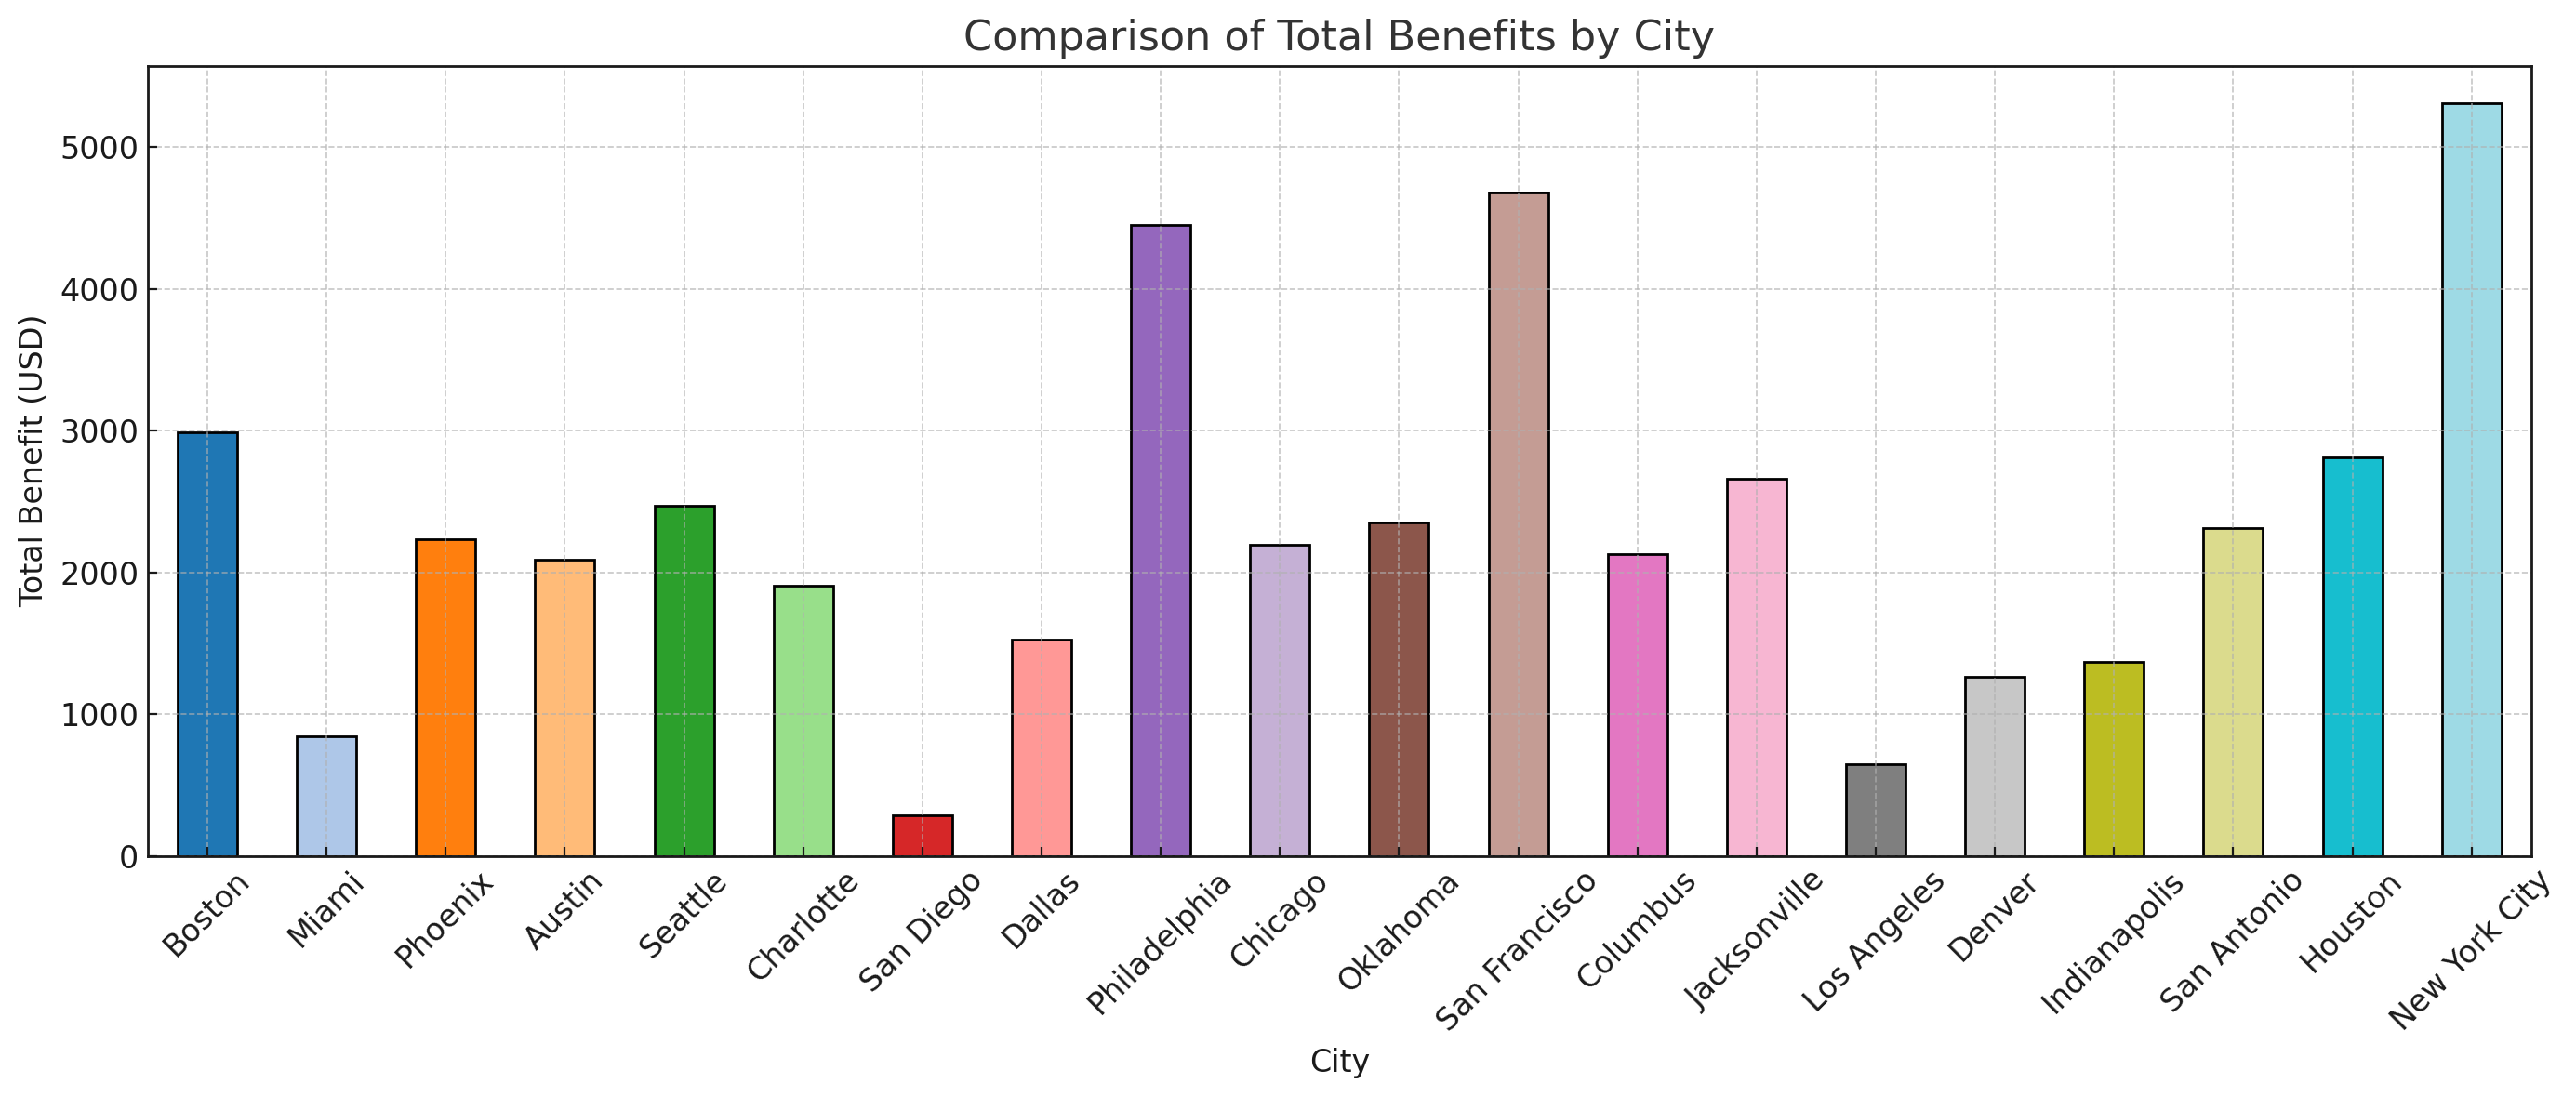
Figure 3 displays the stormwater‐management co‐benefits of a single street tree planted at each city’s maximum UHI hotspot over the next 30 years. Overall, the amount of stormwater intercepted is significantly higher than that of runoff avoided in every city. However, both metrics vary greatly among cities, with Jacksonville, New York City, and Houston reporting the highest values, while Phoenix, San Diego, and Denver exhibit relatively lower figures. Jacksonville leads by a considerable margin, with over 200,000 gallons of intercepted water, more than double that of most other cities. New York City and Houston also perform strongly, intercepting approximately 150,000 to 170,000 gallons and avoiding over 50,000 gallons of runoff. By contrast, Phoenix intercepts only 15,260 gal and avoids 2,791 gallons, and San Diego shows the lowest values (23,133 gallons and 4,109 gallons). These disparities reflect regional differences in storm intensity, tree species hydrology, and urban canopy structure, underlining the importance of local climate and planting strategy in maximizing urban‐forest hydrological services.
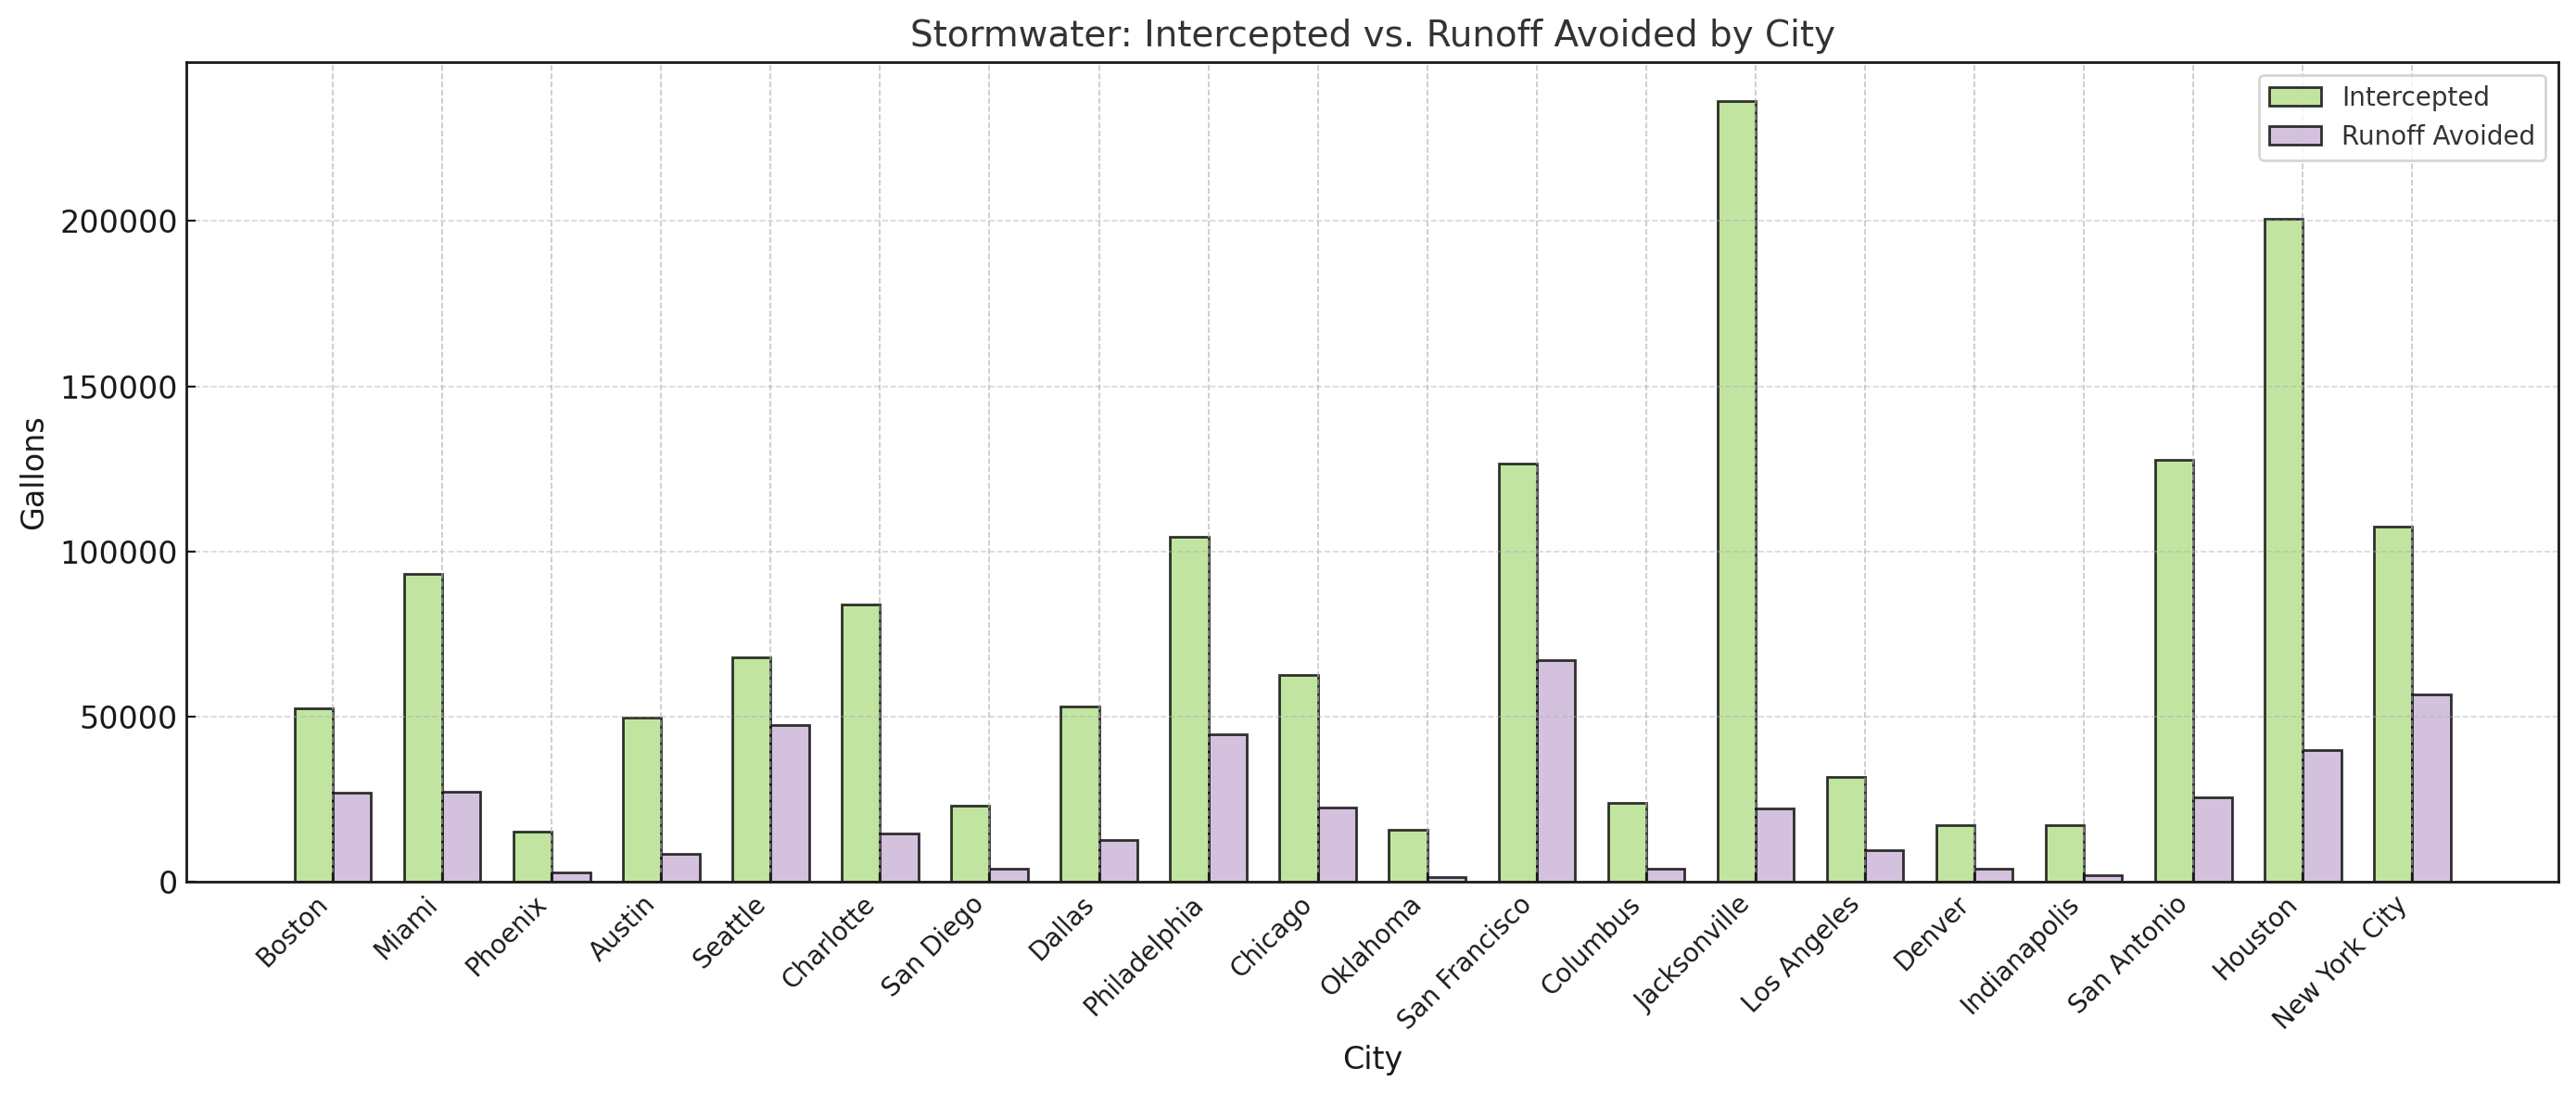
Figure 4 shows two distinct energy responses from a single shade tree placed at each city’s UHI hotspot over the next 30 years. The series diverge along a clear climate gradient. Hot-summer cities post the largest electricity reductions. Phoenix standouts (~10.5 MWh per year), with Austin, Jacksonville, Houston, and San Antonio also high (5 to 6.5 MWh). In cooler locations the pattern flips: Seattle (~662 therms) and Philadelphia (~620 therms) record the greatest heating savings, and New York City (~477 therms) and Chicago (~227 therms) are likewise elevated. At the low end for both metrics are Miami (~0.6 MWh; ~47 therms) and San Diego (~0.28 MWh; ~24 therms). These results jointly explain much of the city-to-city variation in the energy component of total benefits.
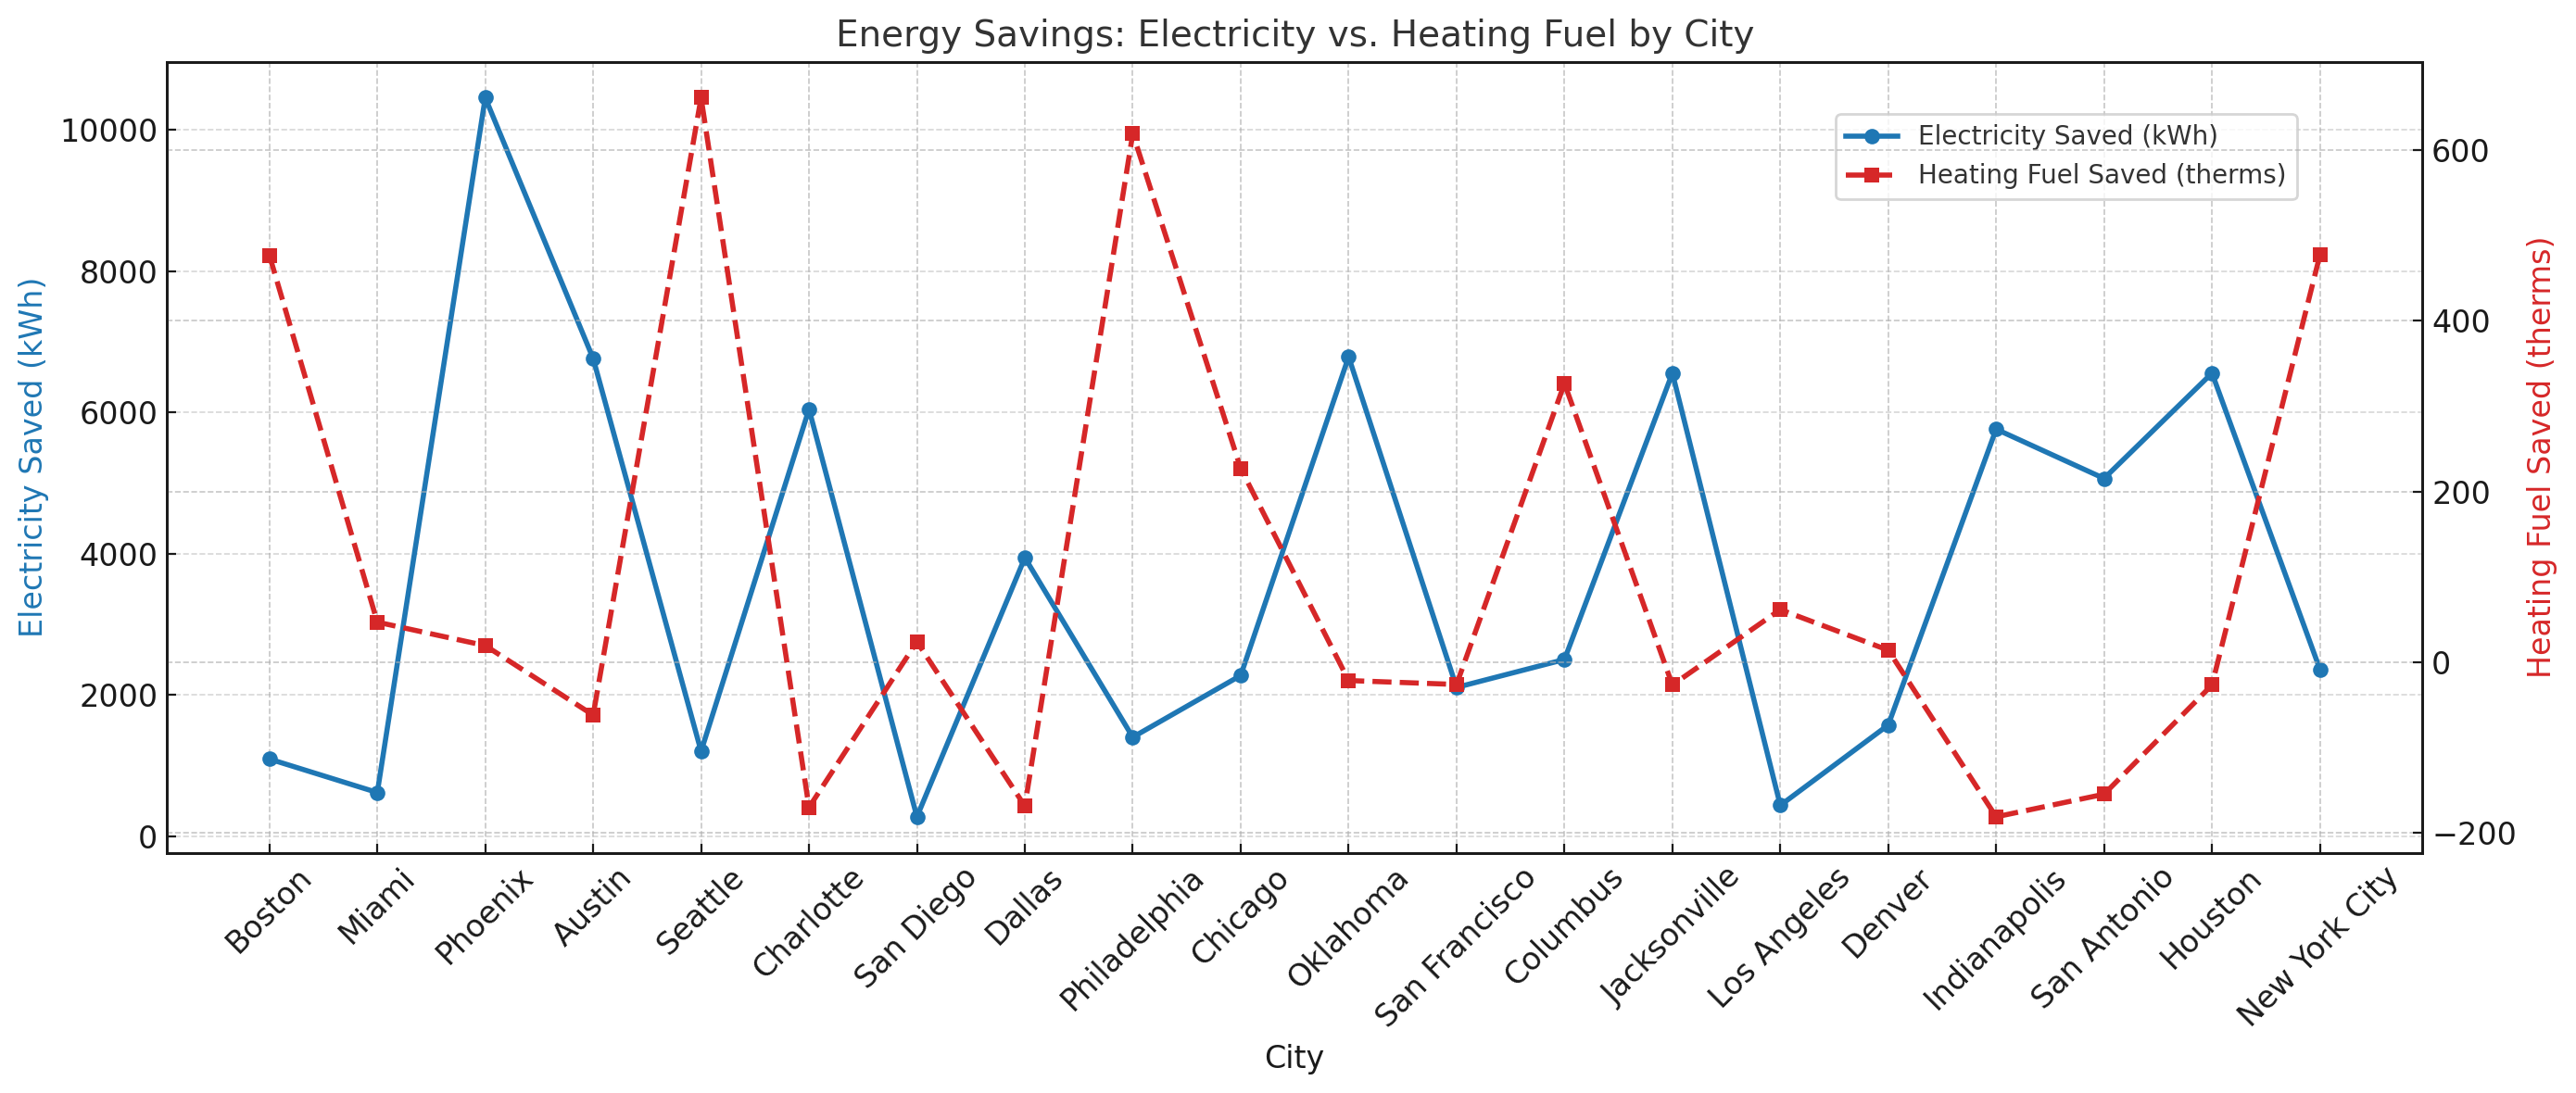
Figure 5 compares the amount of pollutant removal and CO2 reduction in pounds across major U.S. cities over the next 30 years. Overall, CO2 reduction is significantly higher than pollutant removal in every city, with the latter rarely exceeding 160 lbs, while CO2 reduction consistently remains above 5,000 lbs and often surpasses 20,000 lbs. Both metrics fluctuate considerably depending on the city. Philadelphia shows the highest level of pollutant removal, reaching over 160 lbs, and ranks among the top in CO2 reduction, exceeding 25,000 lbs. By contrast, cities like San Diego and Los Angeles exhibit the lowest pollutant removal, both below 40 lbs, with corresponding lower levels of CO2 reduction. Other cities with notable performance in both categories include Columbus and Houston, where both pollutant removal and CO2 reduction are relatively high. It is also worth noting that in most cities, the trends of pollutant removal and CO2 reduction appear to follow a similar pattern, suggesting a positive correlation between them.
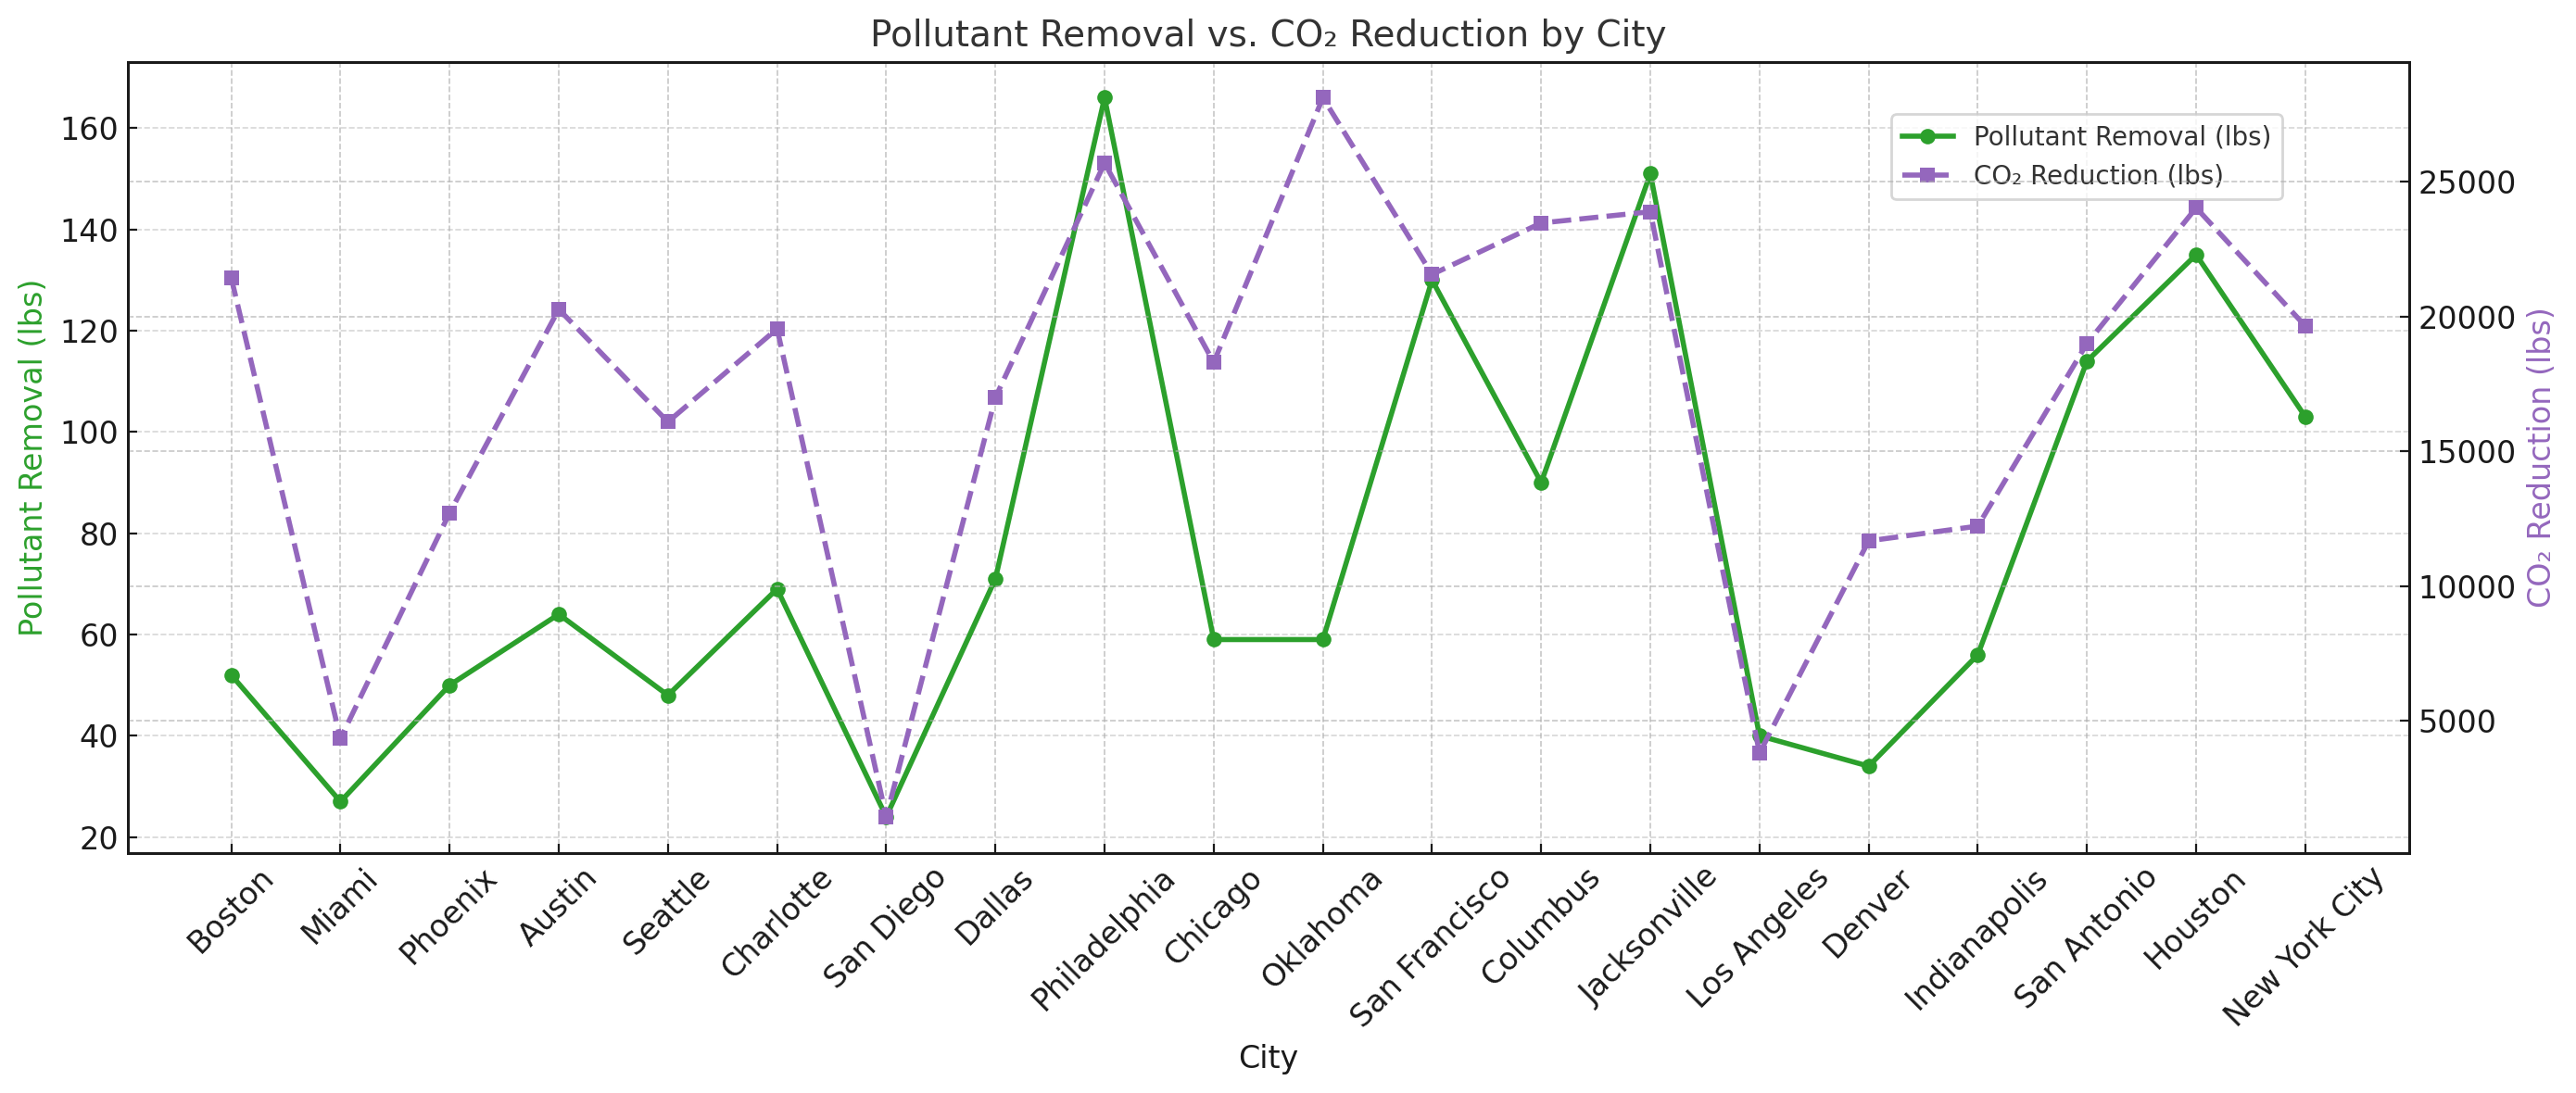
Figure 6 illustrates the amount of CO2 reduction achieved across major U.S. cities over the next 30 years. Overall, there is a notable disparity in CO2 reduction between cities. While some cities achieve reductions exceeding 25,000 pounds, others fall well below 5,000 pounds. This suggests a significant variation in environmental impact efforts across different regions. The city with the highest CO2 reduction is Oklahoma, with a figure close to 27,000 lbs. In contrast, San Diego has the lowest CO2 reduction, contributing only around 2,000 lbs. Miami and Los Angeles also rank among the lowest, each with reductions under 6,000 lbs. Most other cities fall within the range of 15,000 to 23,000 lbs, including Boston, Austin, Seattle, and New York City, indicating a moderate but consistent level of CO2 mitigation. In summary, CO2 reduction levels vary widely among the cities. The leading performing cities clearly indicate strong sustainability initiatives, while the lower-ranking ones may have less focus or capacity for emission reduction.
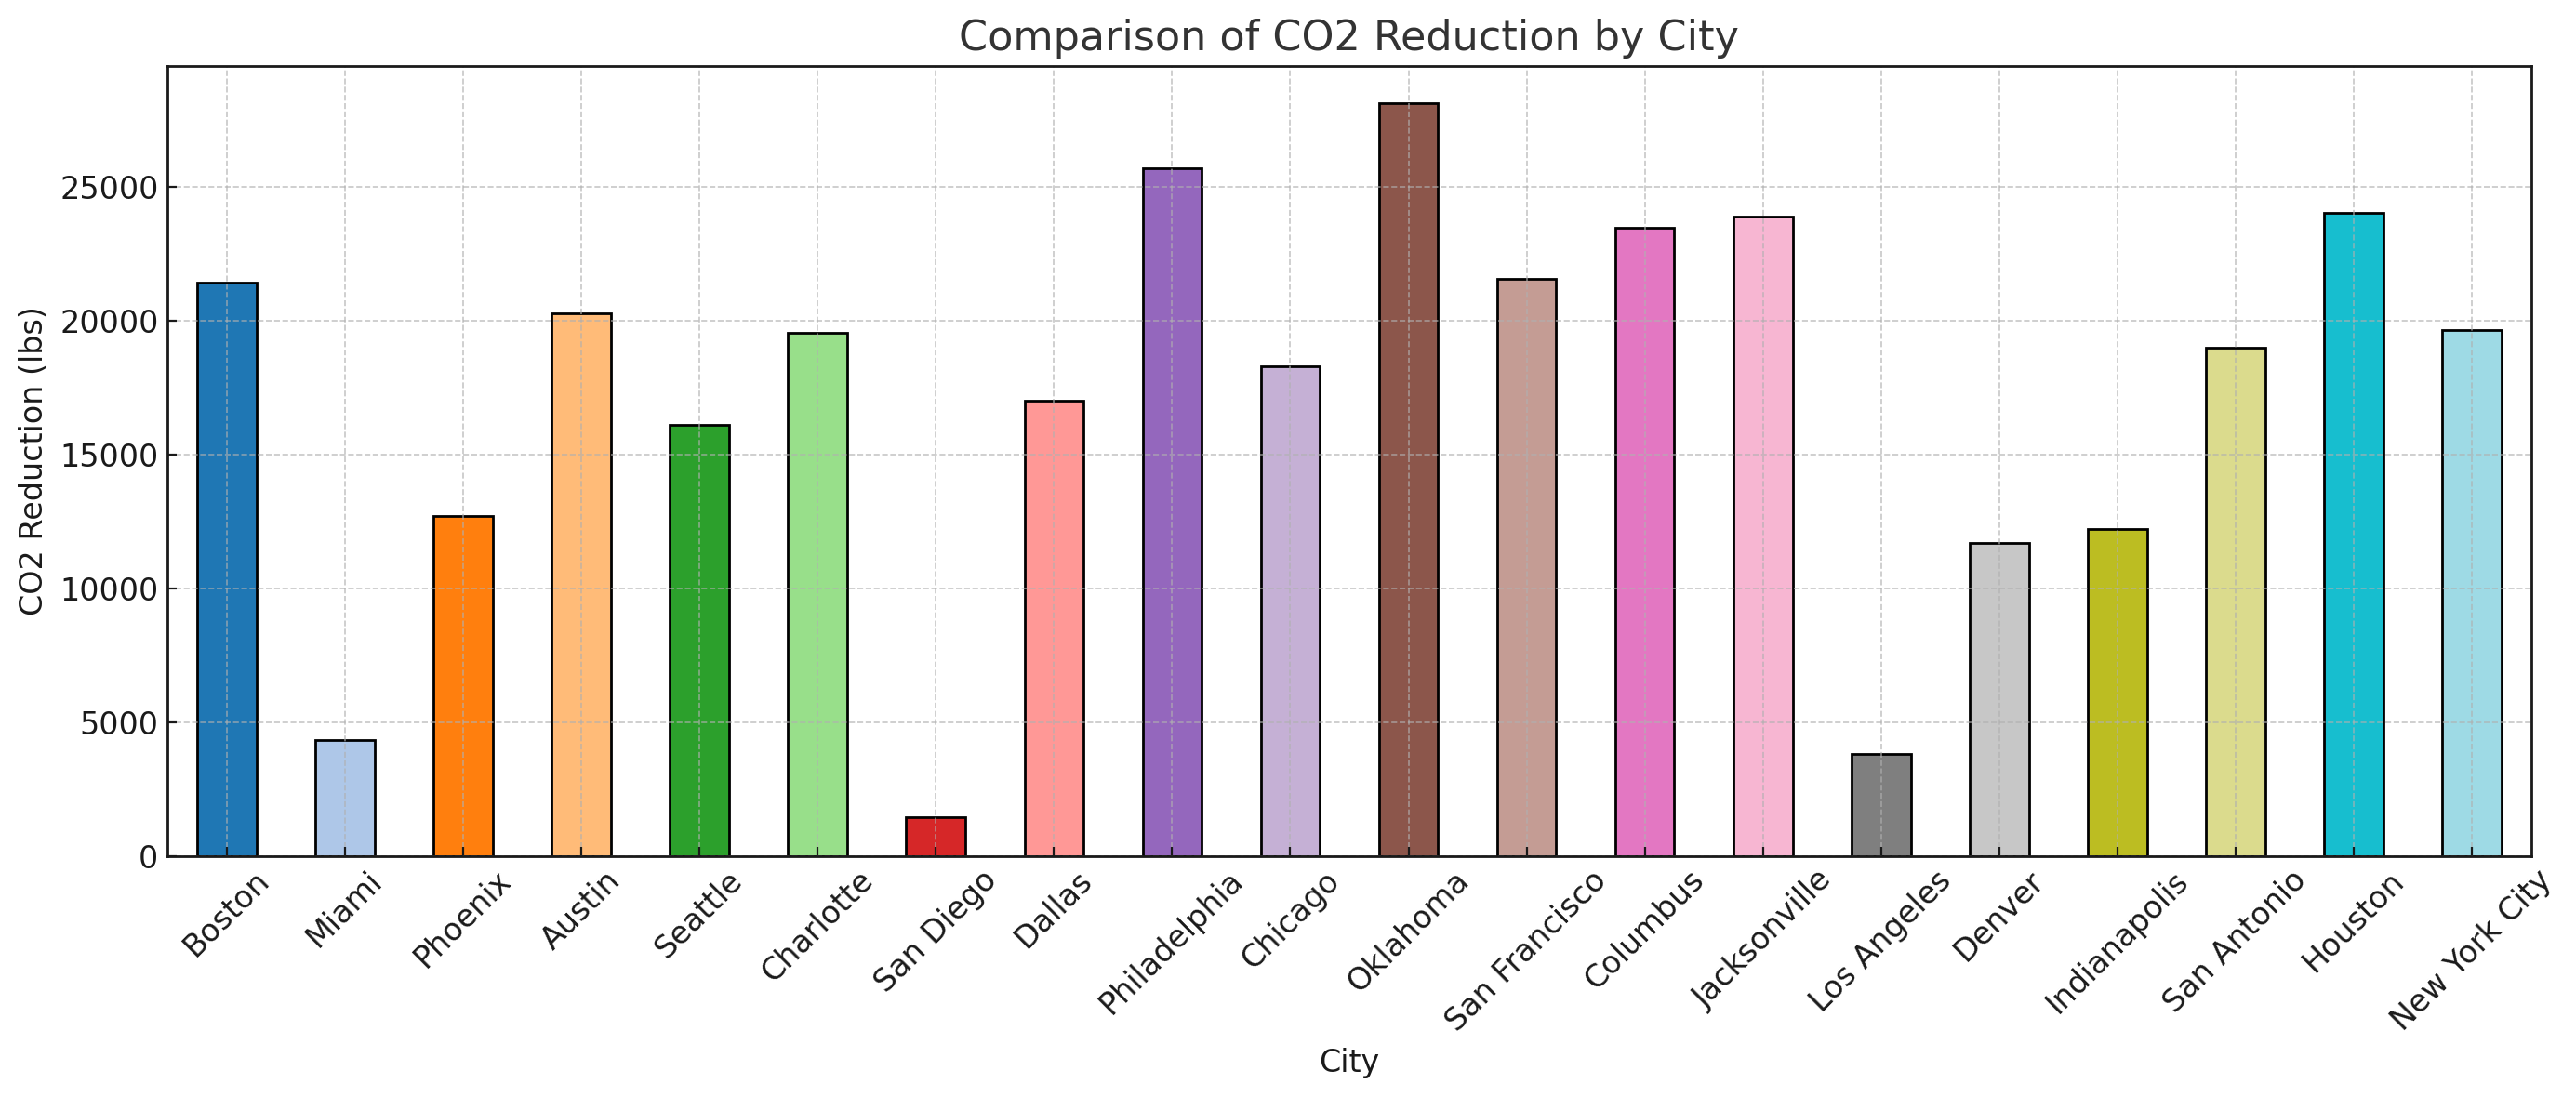
Figure 7 shows the spatial pattern of the monetary benefit from planting one tree at each city’s UHI hotspot. The largest symbols cluster in the Northeast corridor (New York City and Philadelphia) with another high-value point at San Francisco. By contrast, very small symbols appear along the Southern California coast (Los Angeles, San Diego) and in South Florida (Miami). Interior cities display mixed magnitudes: Houston, San Antonio and Jacksonville are mid-sized, while Phoenix, Denver, Chicago and Columbus fall in the moderate range. This geography mirrors differences in local prices and avoided damages: places with higher electricity rates, greater cooling or heating demand, and costlier stormwater management tend to yield larger dollar values for similar biophysical services, whereas low utility rates and fees suppress the monetized benefit despite measurable environmental gains.
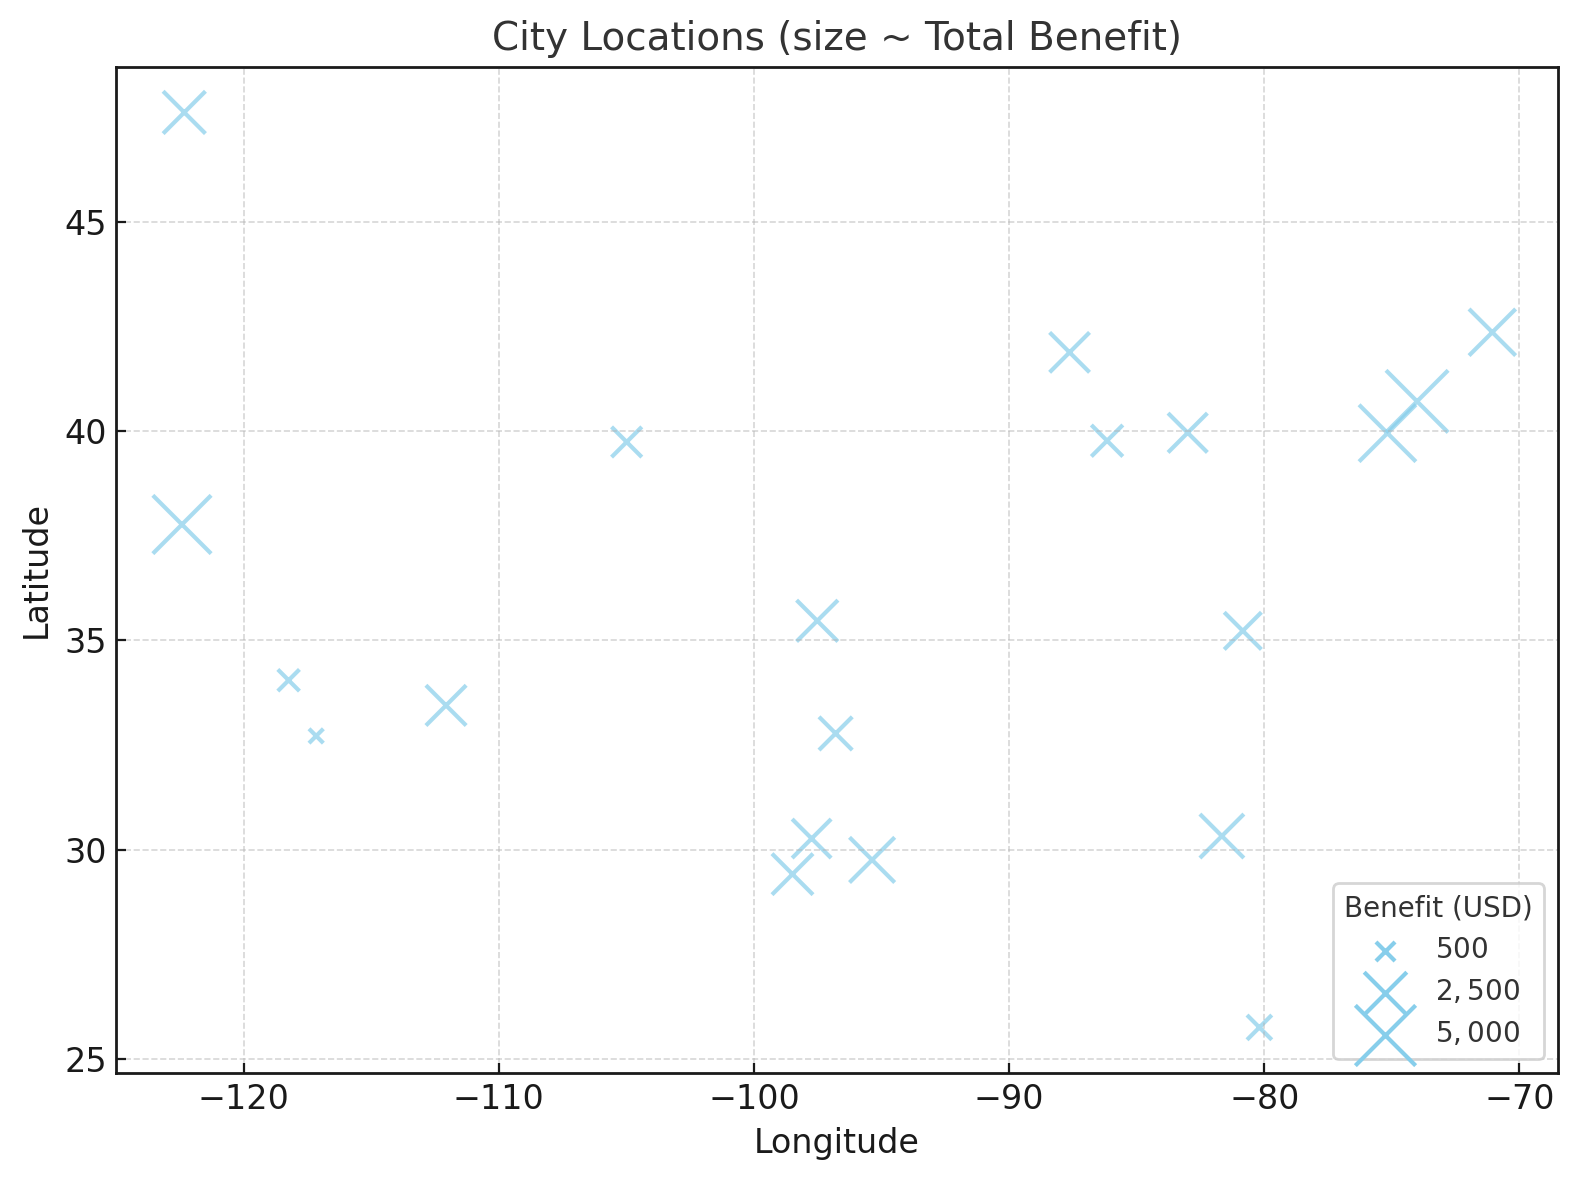
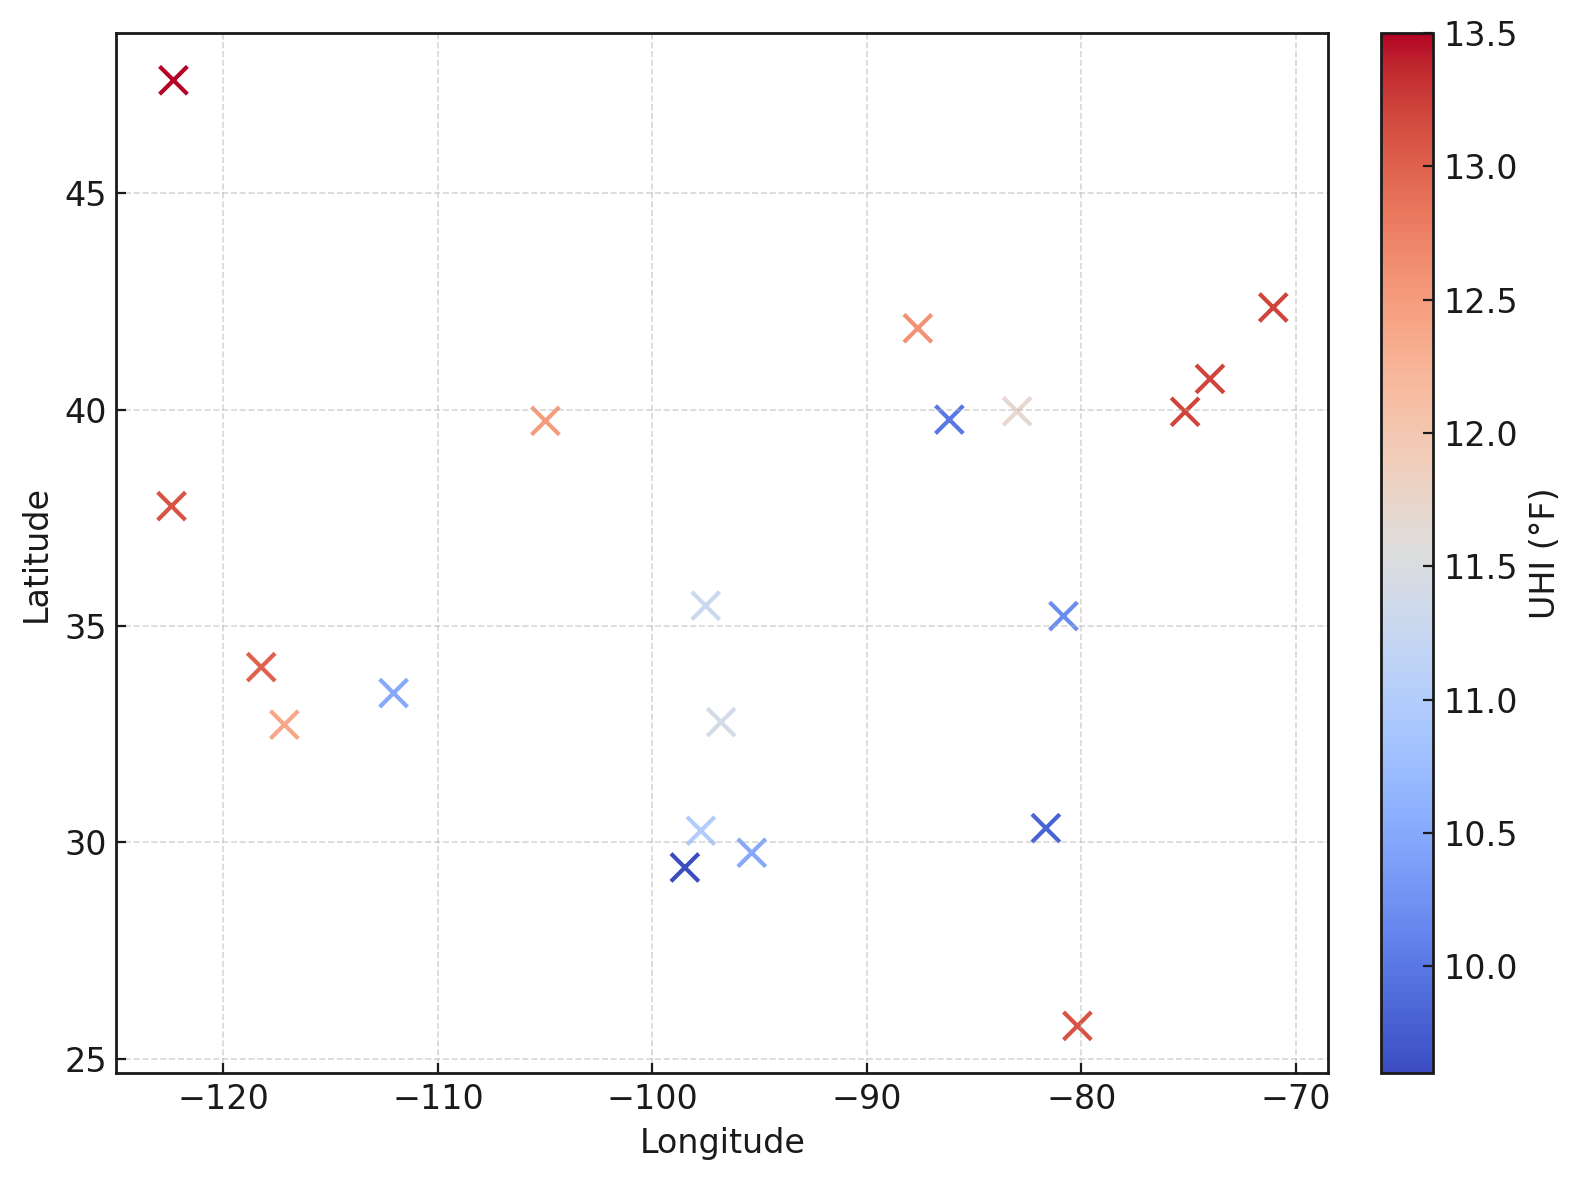
Figure 8 shows how Urban Heat-Island (UHI) intensity varies geographically across the study cities. Warm colors cluster in the nation’s largest coastal metros, with values around 13-13.5 °F in places such as Seattle, Boston, New York City, Philadelphia, Los Angeles, San Diego, San Francisco, and Miami. In contrast, much of the south-central interior records lower UHI magnitudes. Mid-continent cities sit between these extremes (e.g., Chicago 12.6 °F; Columbus 11.7 °F; Denver 12.5 °F). The pattern is not simply latitudinal: Miami (26° N) and Seattle (47° N) both rank high, while nearby Jacksonville is comparatively low (~9.8 °F). The UHI intensity is shaped less by latitude alone and more by local urban form, surface materials, and background climate
3.3. Correlation analysis
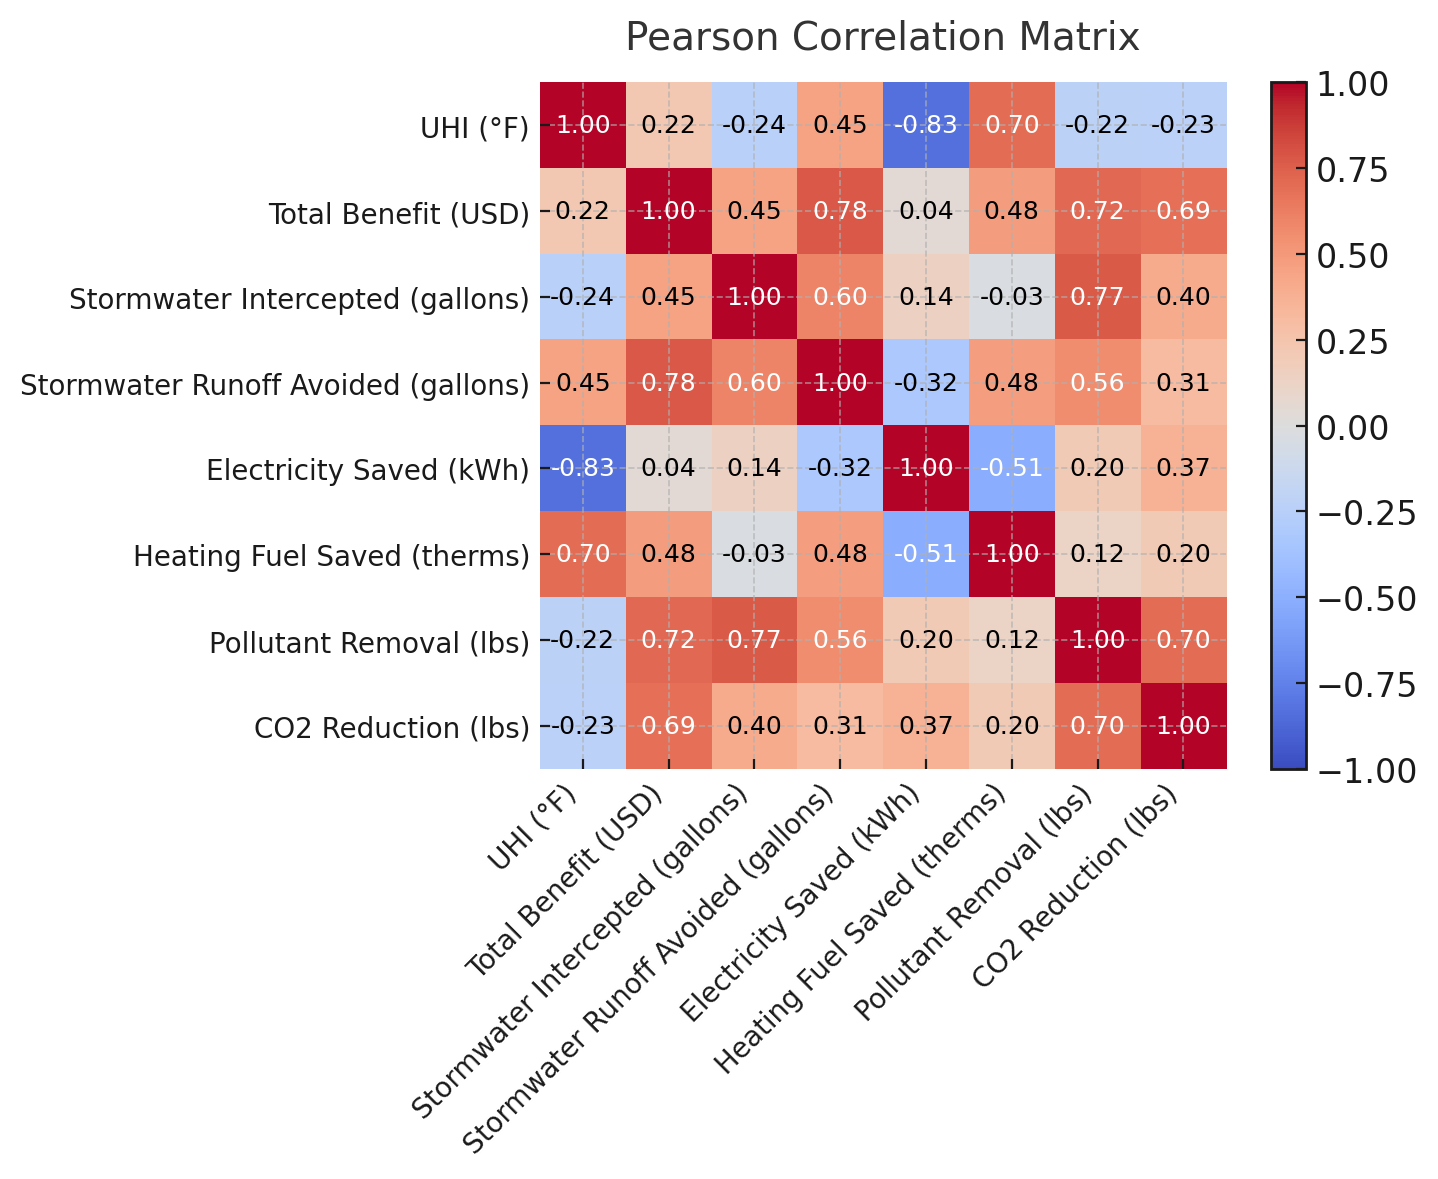
Pearson correlation matrix for the eight key performance metrics of urban trees is presented in Figure 9. Stormwater interception is extremely positively correlated with pollutant removal (r = 0.77) and moderately correlated with total economic benefit (r = 0.45). This indicates that trees that capture more runoff also can have greater air-quality and financial returns. The Total benefit shows strong correlation with runoff avoidance (r = 0.78) and pollutant removal (r = 0.72). This underscores the joint benefits of canopy cover for different functions. In contrast, electricity savings are strongly negatively correlated with UHI intensity (r = -0.83), suggesting that cooler‐temperature cities derive greater cooling‐related energy reductions. Heating‐fuel savings, meanwhile, exhibit a positive relationship with UHI (r = 0.70), reflecting increased winter‐time energy demand in warmer urban cores. Finally, CO₂ reduction correlates most closely with total benefit (r = 0.69) and stormwater interception (r = 0.40), demonstrating that carbon sequestration is broadly aligned with both economic and hydrological ecosystem services. These results may reveal species selection and prioritization in city greening programs.
Figure 10 illustrates the Principal‐Components Analysis (PCA) of the seven ecosystem service metrics plus UHI intensity for the cities in our study. The First Principal Component (PC1), which explains 50.5 % of the variance, effectively separates cities that deliver high stormwater and carbon benefits (positive PC1 scores) from those with relatively low hydrological interception and CO₂ reduction (negative PC1 scores). Philadelphia, New York City, and San Francisco are located far to the right side of the region. It illustrates that they rank highly on combined economic, water, and carbon services, whereas Los Angeles and San Diego locate the far left, reflecting lower runoff interception and sequestration. The Second Component (PC2), accounting for 25.8 % of the variance, distinguishes cities by their urban‐heat‐island and energy‐savings profiles: northern cities like Seattle and Boston have large positive PC2 values, corresponding to strong cooling (electricity savings) and moderate heating savings, while southern cities such as Jacksonville and Houston have strongly negative PC2 scores, indicating higher winter‐time heating‐fuel savings but lower cooling benefits. Midwestern and interior metropolises (e.g. Chicago, Columbus, Dallas, Austin, Oklahoma City) cluster near the origin, suggesting more balanced trade‐offs across all variables. Together, these two components uncover three distinct city‐type groupings: high‐benefit coastal centers, cooling‐dominated temperate cities, and energy‐driven warm‐climate cities. These results can be used for urban forestry interventions.
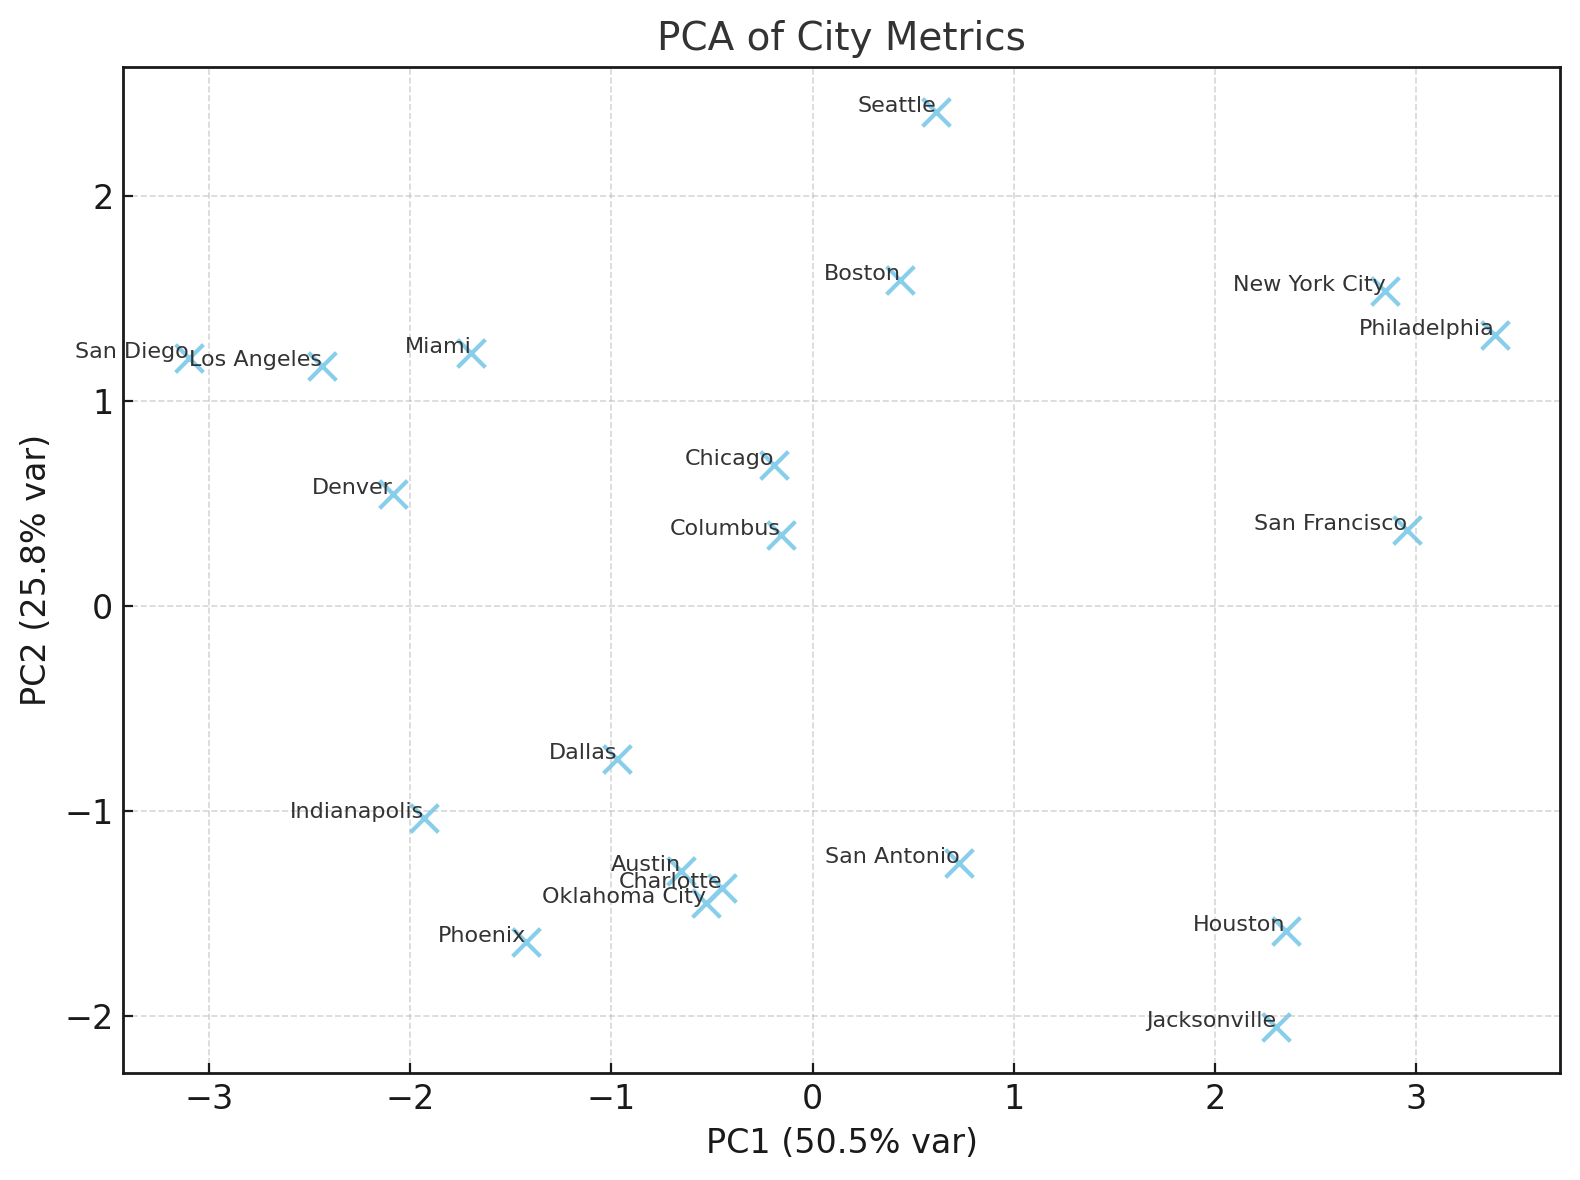
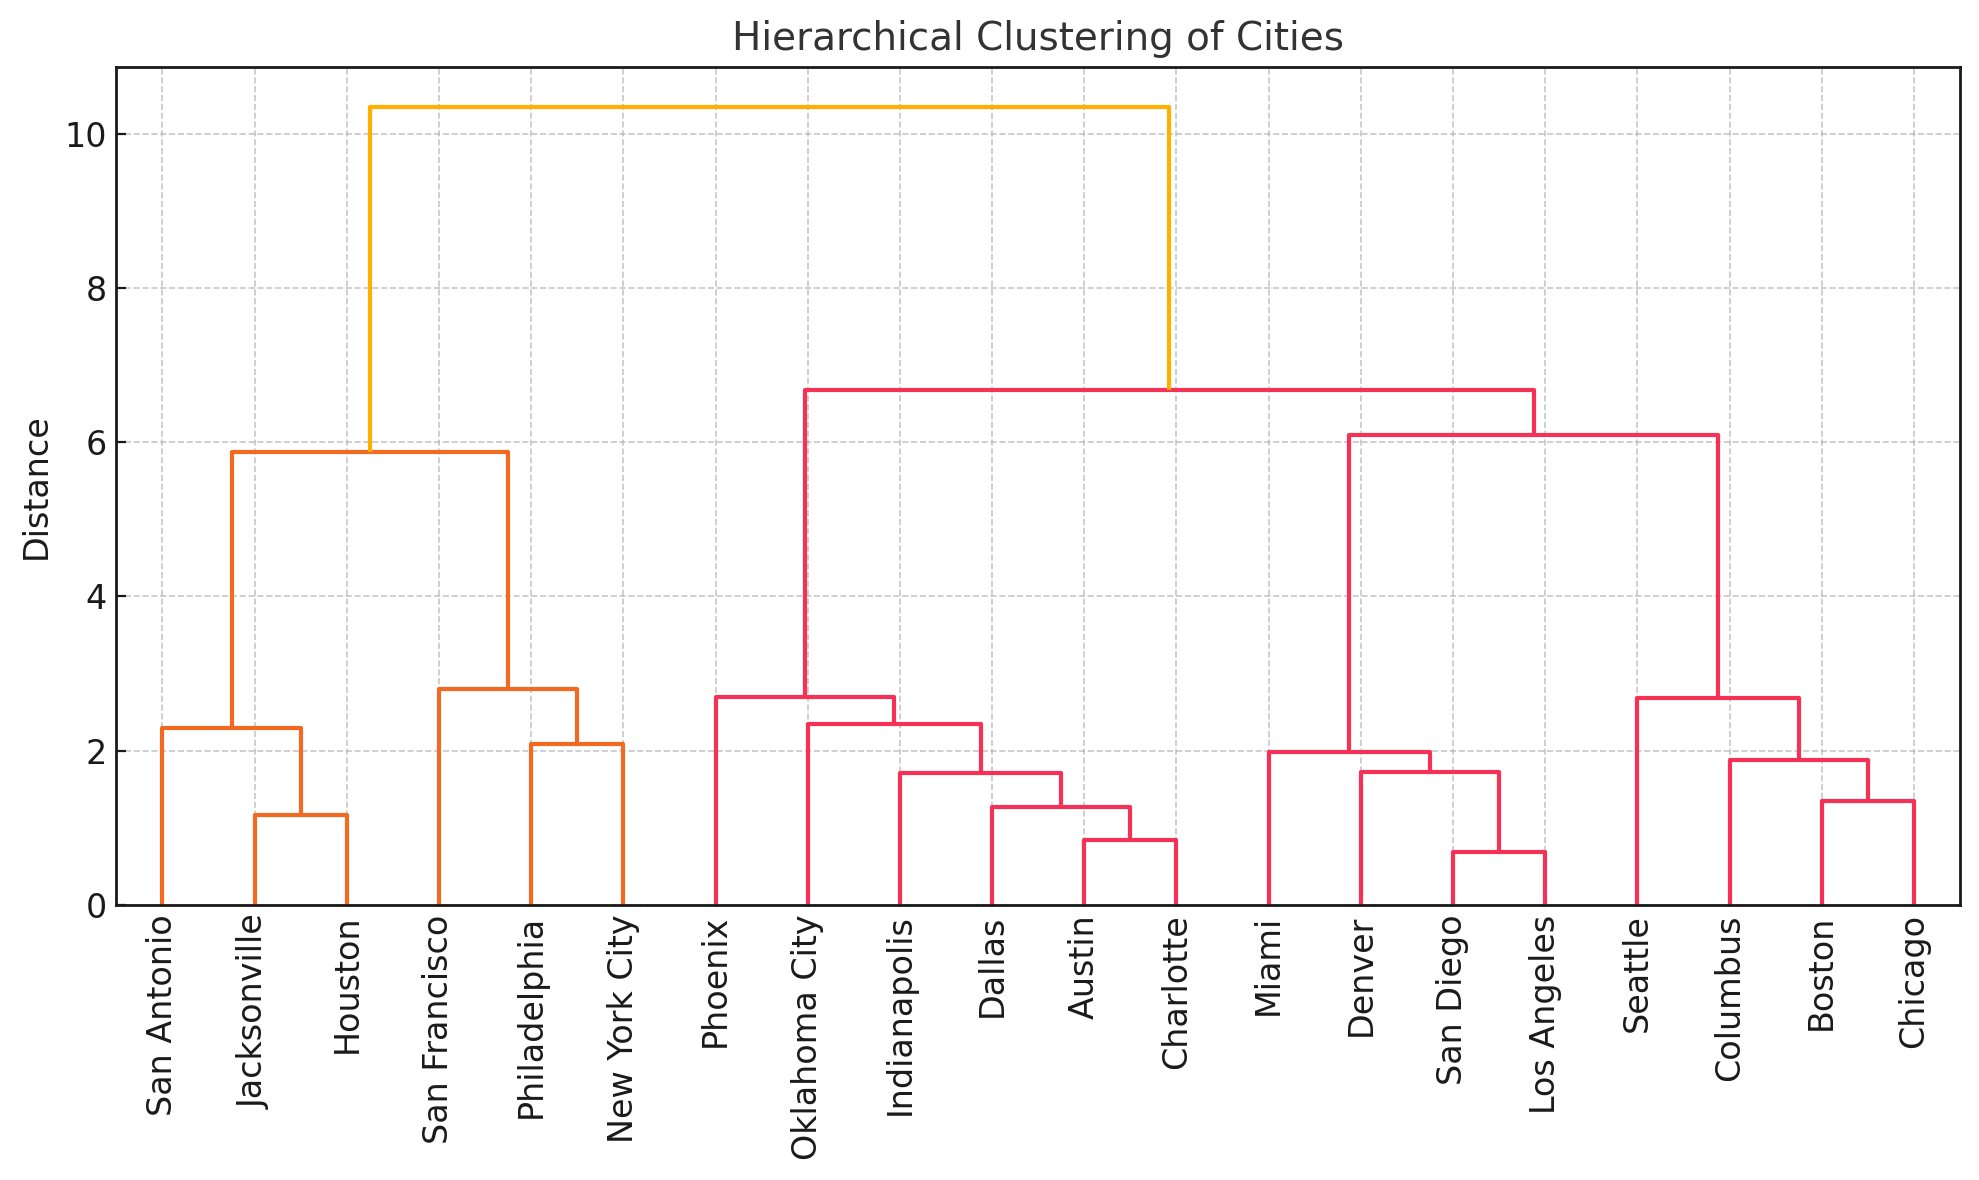
Figure 11 shows the hierarchical clustering of the cities in this study based on all seven ecosystem‐service metrics plus UHI. At the lowest linkage distances, San Antonio, Jacksonville, and Houston form a tight cluster, reflecting their similarly high heating‐fuel savings but lower cooling and hydrological benefits. On the opposite end, San Francisco, Philadelphia, and New York City merge at small distances, driven by their uniformly high stormwater interception, pollutant removal, and CO₂ reduction. Phoenix, Oklahoma City, and Indianapolis cluster next, characterized by moderate benefits across most services but lower winter heating‐fuel savings. In another group, Dallas, Austin, and Charlotte shares balanced mid-range values on both hydrological and energy metrics. Miami, Denver, San Diego, and Los Angeles are grouped together, which reflects their warmer climates with strong cooling benefits but variable hydrological performance. Finally, Seattle, Columbus, Boston, and Chicago coalesce as a northern cool-moist cluster. They are distinguished by high electricity savings, moderate interception, and relatively lower heating‐fuel savings. Therefore, the tree describes clear regional benefit profiles including warm‐climate energy clusters, high‐benefit coastal hubs, and cooler‐climate service providers. These results offer guidance for tailored urban‐forestry strategies in different located cities.
4. Discussion
The results of this study show that the importance of context when assessing the ecosystem services of urban trees in heat‐exposed areas. While the thermal moderation effect of planting a single tree at identified UHI hotspots was relatively consistent among the twenty U.S. cities examined, the co‐benefits displayed pronounced spatial variability. A combination of climatic conditions, rainfall precipitation, prevailing energy costs, and the composition of existing urban forest cover may be reflected by their difference. For example, the very high stormwater interception values are observed in Jacksonville and New York. This corresponds to regions with both substantial rainfall and urban morphology that allow for large canopy expansion. In contrast, the lower number of arid conditions and smaller average tree crowns aligns in Phoenix and San Diego.
The positive association between interception and pollutant removal aligns with previous evidence that increased canopy coverage not only restrained runoff but also enhances particulate capture and gaseous pollutant uptake. Likewise, the linkage between total economic benefit and CO₂ reduction demonstrates that carbon‐related services remain a significant driver of overall valuation, particularly in cities with higher social cost of carbon estimates or active climate‐mitigation targets. However, interestingly, the negative correlation between electricity savings and UHI intensity suggests that cities with cooler baseline temperatures may derive greater proportional cooling savings from shade, whereas warmer regions may see more pronounced gains in winter heating‐fuel conservation.
The above findings in this study demonstrate that targeted tree planting in UHI hotspots is a viable intervention for enhancing urban resilience, but the diversity of benefit profiles across cities may not get optimal results. We can integrate climatic at regional scale, ecological, and socio‐economic considerations into planning, urban forestry initiatives. This way can more effectively balance thermal mitigation with co‐benefits such as water regulation, air‐quality improvement, and carbon management.
However, several limitations should be mentioned. The analysis was based on the benefits of a single representative tree at each city’s maximum UHI hotspot. While this approach isolates location‐specific service estimates, it does not capture interactive effects among multiple plantings, potential shading overlap, or competition for resources that may occur in real‐world urban forestry projects. Also, the ecosystem service values rely on empirical coefficients and regionally averaged parameters. It should also note that the UHI index used to identify hotspots at a given point in time. Temporal changes could shift hotspot locations and alter benefit estimates under different urban eco-conditions.
Future research should extend this framework in several directions. Incorporating multi‐tree configurations and block‐scale planting scenarios would provide more realistic projections of cumulative benefits. Seasonal and interannual climate variability should be explicitly modeled to capture the influence of heat waves, droughts, and other extremes on service delivery. Integrating life‐cycle assessments could help quantify planting, maintenance, and replacement costs, enabling more robust cost-benefit analyses.
5. Conclusion
This study quantified the biophysical and economic benefits of planting a single street tree at the most heat‐intensive urban hotspots in twenty major U.S. cities. The hottest census block of twenty major U.S. cities is assessed for environmental benefits and economic gains. Here are the major conclusions:
1. The ability of a tree to lower temperatures in heat‐island hotspots is fairly similar across cities. However, hydrological, carbon, and air‐quality benefits differed greatly, reflecting contrasts in rainfall, species growth potential, and local urban form.
2. New York City, Philadelphia, and San Francisco ranked highest in overall benefits, largely due to their strong stormwater‐management and carbon‐sequestration values. San Diego and Los Angeles produced the lowest monetary returns because they have drier climates and smaller canopy potential,
3. Hot-summer cities are cooling-dominated, whereas cooler cities are heating-dominated (large therm savings, modest electricity). This split explains much of the variation in total benefits.
Conflicts of interest
The authors declare no conflicts of interest.
References
[1]. Almeida, C. R. D., Teodoro, A. C., & Gonçalves, A. (2021). Study of the urban heat island (UHI) using remote sensing data/techniques: A systematic review.Environments, 8(10), 105. https: //doi.org/10.3390/environments8100105
[2]. Yang, L., Qian, F., Song, D. X., & Zheng, K. J. (2016). Research on urban heat-island effect.Procedia Engineering, 169, 11–18. https: //doi.org/10.1016/j.proeng.2016.10.002
[3]. Nuruzzaman, M. (2015). Urban heat island: Causes, effects and mitigation measures—A review.International Journal of Environmental Monitoring and Analysis, 3(2), 67–73. https: //doi.org/10.11648/j.ijema.20150302.15
[4]. O’Malley, C., Piroozfar, P., Farr, E. R., & Pomponi, F. (2015). Urban Heat Island (UHI) mitigating strategies: A case-based comparative analysis.Sustainable Cities and Society, 19, 222–235. https: //doi.org/10.1016/j.scs.2015.08.004
[5]. Hayes, A. T., Jandaghian, Z., Lacasse, M. A., Gaur, A., Lu, H., Laouadi, A., & Wang, L. (2022). Nature-based solutions (NBS) to mitigate urban heat island (UHI) effects in Canadian cities.Buildings,12(7), 925. https: //doi.org/10.3390/buildings12070925
[6]. Leuzinger, S., Vogt, R., & Körner, C. (2010). Tree surface temperature in an urban environment.Agricultural and Forest Meteorology,150(1), 56–62. https: //doi.org/10.1016/j.agrformet.2009.08.006
[7]. Wang, C., Wang, Z. H., Wang, C., & Myint, S. W. (2019). Environmental cooling provided by urban trees under extreme heat and cold waves in US cities.Remote Sensing of Environment, 227, 28–43. https: //doi.org/10.1016/j.rse.2019.04.003
[8]. Rahman, M. A., Armson, D., & Ennos, A. R. (2015). A comparison of the growth and cooling effectiveness of five commonly planted urban tree species.Urban Ecosystems, 18(2), 371–389. https: //doi.org/10.1007/s11252-014-0407-7
[9]. Yin, Y., Li, S., Xing, X., Zhou, X., Kang, Y., Hu, Q., & Li, Y. (2024). Cooling benefits of urban tree canopy: A systematic review.Sustainability, 16(12), 4955. https: //doi.org/10.3390/su16124955
[10]. Rahman, M. A., Stratopoulos, L. M., Moser-Reischl, A., Zölch, T., Häberle, K. H., Rötzer, T., & Pauleit, S. (2020). Traits of trees for cooling urban heat islands: A meta-analysis.Building and Environment, 170, 106606. https: //doi.org/10.1016/j.buildenv.2019.106606
[11]. Zheng, S., He, C., Guldmann, J. M., Xu, H., & Liu, X. (2023). Heat mitigation benefits of urban trees: A review of mechanisms, modeling, validation and simulation.Forests, 14(12), 2280. https: //doi.org/10.3390/f14122280
[12]. Liang, D., & Huang, G. (2023). Influence of urban tree traits on their ecosystem services: A literature review.Land,12(9), 1699. https: //doi.org/10.3390/land12091699
[13]. Wei, H., Chen, B., Wu, S., & Xu, B. (2023). Impact of early heat anomalies on urban tree cooling efficiency: Evidence from spring heatwave events in India.International Journal of Applied Earth Observation and Geoinformation, 120, 103334. https: //doi.org/10.1016/j.jag.2023.103334
[14]. He, C., Zhou, L., Yao, Y., Ma, W., & Kinney, P. L. (2021). Cooling effect of urban trees and its spatiotemporal characteristics: A comparative study.Building and Environment, 204, 108103. https: //doi.org/10.1016/j.buildenv.2021.108103
[15]. Zhou, W., Huang, G., Pickett, S. T., Wang, J., Cadenasso, M. L., McPhearson, T., & Wang, J. (2021). Urban tree canopy has greater cooling effects in socially vulnerable communities in the US.One Earth,4(12), 1764–1775. https: //doi.org/10.1016/j.oneear.2021.11.010
[16]. Wang, C., Wang, Z. H., & Yang, J. (2018). Cooling effect of urban trees on the built environment of contiguous United States.Earth's Future, 6(8), 1066–1081. https: //doi.org/10.1029/2018EF000891
[17]. Konarska, J., Uddling, J., Holmer, B., Lutz, M., Lindberg, F., Pleijel, H., & Thorsson, S. (2016). Transpiration of urban trees and its cooling effect in a high latitude city.International Journal of Biometeorology, 60(1), 159–172. https: //doi.org/10.1007/s00484-015-1014-x
[18]. Rahman, M. A., Armson, D., & Ennos, A. R. (2015). A comparison of the growth and cooling effectiveness of five commonly planted urban tree species.Urban Ecosystems, 18(2), 371–389. https: //doi.org/10.1007/s11252-014-0407-7
[19]. Tan, Z., Lau, K. K. L., & Ng, E. (2016). Urban tree design approaches for mitigating daytime urban heat island effects in a high-density urban environment.Energy and Buildings, 114, 265–274. https: //doi.org/10.1016/j.enbuild.2015.06.031
[20]. Wang, J., Zhou, W., Jiao, M., Zheng, Z., Ren, T., & Zhang, Q. (2020). Significant effects of ecological context on urban trees' cooling efficiency.ISPRS Journal of Photogrammetry and Remote Sensing, 159, 78–89. https: //doi.org/10.1016/j.isprsjprs.2019.10.012
[21]. Wang, C., Wang, Z. H., Wang, C., & Myint, S. W. (2019). Environmental cooling provided by urban trees under extreme heat and cold waves in US cities.Remote Sensing of Environment, 227, 28–43. https: //doi.org/10.1016/j.rse.2019.04.003
[22]. Escobedo, F. J., Kroeger, T., & Wagner, J. E. (2011). Urban forests and pollution mitigation: Analyzing ecosystem services and disservices.Environmental Pollution, 159(8–9), 2078–2087. https: //doi.org/10.1016/j.envpol.2011.01.010
[23]. Weissert, L. F., Salmond, J. A., & Schwendenmann, L. (2014). A review of the current progress in quantifying the potential of urban forests to mitigate urban CO2 emissions.Urban Climate, 8, 100–125. https: //doi.org/10.1016/j.uclim.2014.01.002
[24]. Orta-Ortiz, M. S., & Geneletti, D. (2022). What variables matter when designing nature-based solutions for stormwater management? A review of impacts on ecosystem services.Environmental Impact Assessment Review,95, 106802. https: //doi.org/10.1016/j.eiar.2022.106802
[25]. Ko, Y. (2018). Trees and vegetation for residential energy conservation: A critical review for evidence-based urban greening in North America.Urban Forestry & Urban Greening, 34, 318–335. https: //doi.org/10.1016/j.ufug.2018.08.004
[26]. Sangiorgio, V., Fiorito, F., & Santamouris, M. (2020). Development of a holistic urban heat island evaluation methodology.Scientific Reports, 10(1), 17913. https: //doi.org/10.1038/s41598-020-75008-6
[27]. Zeide, B. (1989). Accuracy of equations describing diameter growth. Canadian Journal of Forest Research,19(10), 1283–1286. https: //doi.org/10.1139/x89-195
[28]. Zeide, B. (1993). Analysis of growth equations.Forest Science,39(3), 594–616. https: //doi.org/10.1093/forestscience/39.3.594
[29]. Huang, Y. J., Akbari, H., Taha, H., & Rosenfeld, A. H. (1987). The potential of vegetation in reducing summer cooling loads in residential buildings.Journal of Applied Meteorology and Climatology, 26(9), 1103–1116.
[30]. Simpson, J. R., & McPherson, E. G. (1998). Simulation of tree shade impacts on residential energy use for space conditioning in Sacramento.Atmospheric Environment, 32(1), 69–74. https: //doi.org/10.1016/S1352-2310(97)00181-7
[31]. Monteith, J., & Unsworth, M. (2013). Principles of environmental physics: Plants, animals, and the atmosphere. Academic Press.
[32]. Xiao, Q., McPherson, E. G., Simpson, J. R., & Ustin, S. L. (1998). Rainfall interception by Sacramento's urban forest.Journal of Arboriculture,24(4), 235–244.
[33]. Jenkins, J. C., Chojnacky, D. C., Heath, L. S., & Birdsey, R. A. (2003). National-scale biomass estimators for United States tree species.Forest Science, 49(1), 12–35. https: //doi.org/10.1093/forestscience/49.1.12
[34]. Chojnacky, D. C., Heath, L. S., & Jenkins, J. C. (2014). Updated generalized biomass equations for North American tree species.Forestry, 87(1), 129–151. https: //doi.org/10.1093/forestry/cpt053
[35]. Nowak, D. J., Crane, D. E., & Stevens, J. C. (2006). Air pollution removal by urban trees and shrubs in the United States.Urban Forestry & Urban Greening,4(3–4), 115–123. https: //doi.org/10.1016/j.ufug.2006.01.007
[36]. Climate Central. (2024). Urban heat hot spots in 65 cities [Dataset and maps]. Retrieved August 19, 2025, from https: //www.climatecentral.org/climate-matters/urban-heat-islands-2024
Cite this article
Zhang,Z. (2025). Assessing the eco‐benefits of a single tree at Urban Heat‐Island (UHI) hotspots in major U.S. cities. Advances in Engineering Innovation,16(9),18-29.
Data availability
The datasets used and/or analyzed during the current study will be available from the authors upon reasonable request.
Disclaimer/Publisher's Note
The statements, opinions and data contained in all publications are solely those of the individual author(s) and contributor(s) and not of EWA Publishing and/or the editor(s). EWA Publishing and/or the editor(s) disclaim responsibility for any injury to people or property resulting from any ideas, methods, instructions or products referred to in the content.
About volume
Journal:Advances in Engineering Innovation
© 2024 by the author(s). Licensee EWA Publishing, Oxford, UK. This article is an open access article distributed under the terms and
conditions of the Creative Commons Attribution (CC BY) license. Authors who
publish this series agree to the following terms:
1. Authors retain copyright and grant the series right of first publication with the work simultaneously licensed under a Creative Commons
Attribution License that allows others to share the work with an acknowledgment of the work's authorship and initial publication in this
series.
2. Authors are able to enter into separate, additional contractual arrangements for the non-exclusive distribution of the series's published
version of the work (e.g., post it to an institutional repository or publish it in a book), with an acknowledgment of its initial
publication in this series.
3. Authors are permitted and encouraged to post their work online (e.g., in institutional repositories or on their website) prior to and
during the submission process, as it can lead to productive exchanges, as well as earlier and greater citation of published work (See
Open access policy for details).
References
[1]. Almeida, C. R. D., Teodoro, A. C., & Gonçalves, A. (2021). Study of the urban heat island (UHI) using remote sensing data/techniques: A systematic review.Environments, 8(10), 105. https: //doi.org/10.3390/environments8100105
[2]. Yang, L., Qian, F., Song, D. X., & Zheng, K. J. (2016). Research on urban heat-island effect.Procedia Engineering, 169, 11–18. https: //doi.org/10.1016/j.proeng.2016.10.002
[3]. Nuruzzaman, M. (2015). Urban heat island: Causes, effects and mitigation measures—A review.International Journal of Environmental Monitoring and Analysis, 3(2), 67–73. https: //doi.org/10.11648/j.ijema.20150302.15
[4]. O’Malley, C., Piroozfar, P., Farr, E. R., & Pomponi, F. (2015). Urban Heat Island (UHI) mitigating strategies: A case-based comparative analysis.Sustainable Cities and Society, 19, 222–235. https: //doi.org/10.1016/j.scs.2015.08.004
[5]. Hayes, A. T., Jandaghian, Z., Lacasse, M. A., Gaur, A., Lu, H., Laouadi, A., & Wang, L. (2022). Nature-based solutions (NBS) to mitigate urban heat island (UHI) effects in Canadian cities.Buildings,12(7), 925. https: //doi.org/10.3390/buildings12070925
[6]. Leuzinger, S., Vogt, R., & Körner, C. (2010). Tree surface temperature in an urban environment.Agricultural and Forest Meteorology,150(1), 56–62. https: //doi.org/10.1016/j.agrformet.2009.08.006
[7]. Wang, C., Wang, Z. H., Wang, C., & Myint, S. W. (2019). Environmental cooling provided by urban trees under extreme heat and cold waves in US cities.Remote Sensing of Environment, 227, 28–43. https: //doi.org/10.1016/j.rse.2019.04.003
[8]. Rahman, M. A., Armson, D., & Ennos, A. R. (2015). A comparison of the growth and cooling effectiveness of five commonly planted urban tree species.Urban Ecosystems, 18(2), 371–389. https: //doi.org/10.1007/s11252-014-0407-7
[9]. Yin, Y., Li, S., Xing, X., Zhou, X., Kang, Y., Hu, Q., & Li, Y. (2024). Cooling benefits of urban tree canopy: A systematic review.Sustainability, 16(12), 4955. https: //doi.org/10.3390/su16124955
[10]. Rahman, M. A., Stratopoulos, L. M., Moser-Reischl, A., Zölch, T., Häberle, K. H., Rötzer, T., & Pauleit, S. (2020). Traits of trees for cooling urban heat islands: A meta-analysis.Building and Environment, 170, 106606. https: //doi.org/10.1016/j.buildenv.2019.106606
[11]. Zheng, S., He, C., Guldmann, J. M., Xu, H., & Liu, X. (2023). Heat mitigation benefits of urban trees: A review of mechanisms, modeling, validation and simulation.Forests, 14(12), 2280. https: //doi.org/10.3390/f14122280
[12]. Liang, D., & Huang, G. (2023). Influence of urban tree traits on their ecosystem services: A literature review.Land,12(9), 1699. https: //doi.org/10.3390/land12091699
[13]. Wei, H., Chen, B., Wu, S., & Xu, B. (2023). Impact of early heat anomalies on urban tree cooling efficiency: Evidence from spring heatwave events in India.International Journal of Applied Earth Observation and Geoinformation, 120, 103334. https: //doi.org/10.1016/j.jag.2023.103334
[14]. He, C., Zhou, L., Yao, Y., Ma, W., & Kinney, P. L. (2021). Cooling effect of urban trees and its spatiotemporal characteristics: A comparative study.Building and Environment, 204, 108103. https: //doi.org/10.1016/j.buildenv.2021.108103
[15]. Zhou, W., Huang, G., Pickett, S. T., Wang, J., Cadenasso, M. L., McPhearson, T., & Wang, J. (2021). Urban tree canopy has greater cooling effects in socially vulnerable communities in the US.One Earth,4(12), 1764–1775. https: //doi.org/10.1016/j.oneear.2021.11.010
[16]. Wang, C., Wang, Z. H., & Yang, J. (2018). Cooling effect of urban trees on the built environment of contiguous United States.Earth's Future, 6(8), 1066–1081. https: //doi.org/10.1029/2018EF000891
[17]. Konarska, J., Uddling, J., Holmer, B., Lutz, M., Lindberg, F., Pleijel, H., & Thorsson, S. (2016). Transpiration of urban trees and its cooling effect in a high latitude city.International Journal of Biometeorology, 60(1), 159–172. https: //doi.org/10.1007/s00484-015-1014-x
[18]. Rahman, M. A., Armson, D., & Ennos, A. R. (2015). A comparison of the growth and cooling effectiveness of five commonly planted urban tree species.Urban Ecosystems, 18(2), 371–389. https: //doi.org/10.1007/s11252-014-0407-7
[19]. Tan, Z., Lau, K. K. L., & Ng, E. (2016). Urban tree design approaches for mitigating daytime urban heat island effects in a high-density urban environment.Energy and Buildings, 114, 265–274. https: //doi.org/10.1016/j.enbuild.2015.06.031
[20]. Wang, J., Zhou, W., Jiao, M., Zheng, Z., Ren, T., & Zhang, Q. (2020). Significant effects of ecological context on urban trees' cooling efficiency.ISPRS Journal of Photogrammetry and Remote Sensing, 159, 78–89. https: //doi.org/10.1016/j.isprsjprs.2019.10.012
[21]. Wang, C., Wang, Z. H., Wang, C., & Myint, S. W. (2019). Environmental cooling provided by urban trees under extreme heat and cold waves in US cities.Remote Sensing of Environment, 227, 28–43. https: //doi.org/10.1016/j.rse.2019.04.003
[22]. Escobedo, F. J., Kroeger, T., & Wagner, J. E. (2011). Urban forests and pollution mitigation: Analyzing ecosystem services and disservices.Environmental Pollution, 159(8–9), 2078–2087. https: //doi.org/10.1016/j.envpol.2011.01.010
[23]. Weissert, L. F., Salmond, J. A., & Schwendenmann, L. (2014). A review of the current progress in quantifying the potential of urban forests to mitigate urban CO2 emissions.Urban Climate, 8, 100–125. https: //doi.org/10.1016/j.uclim.2014.01.002
[24]. Orta-Ortiz, M. S., & Geneletti, D. (2022). What variables matter when designing nature-based solutions for stormwater management? A review of impacts on ecosystem services.Environmental Impact Assessment Review,95, 106802. https: //doi.org/10.1016/j.eiar.2022.106802
[25]. Ko, Y. (2018). Trees and vegetation for residential energy conservation: A critical review for evidence-based urban greening in North America.Urban Forestry & Urban Greening, 34, 318–335. https: //doi.org/10.1016/j.ufug.2018.08.004
[26]. Sangiorgio, V., Fiorito, F., & Santamouris, M. (2020). Development of a holistic urban heat island evaluation methodology.Scientific Reports, 10(1), 17913. https: //doi.org/10.1038/s41598-020-75008-6
[27]. Zeide, B. (1989). Accuracy of equations describing diameter growth. Canadian Journal of Forest Research,19(10), 1283–1286. https: //doi.org/10.1139/x89-195
[28]. Zeide, B. (1993). Analysis of growth equations.Forest Science,39(3), 594–616. https: //doi.org/10.1093/forestscience/39.3.594
[29]. Huang, Y. J., Akbari, H., Taha, H., & Rosenfeld, A. H. (1987). The potential of vegetation in reducing summer cooling loads in residential buildings.Journal of Applied Meteorology and Climatology, 26(9), 1103–1116.
[30]. Simpson, J. R., & McPherson, E. G. (1998). Simulation of tree shade impacts on residential energy use for space conditioning in Sacramento.Atmospheric Environment, 32(1), 69–74. https: //doi.org/10.1016/S1352-2310(97)00181-7
[31]. Monteith, J., & Unsworth, M. (2013). Principles of environmental physics: Plants, animals, and the atmosphere. Academic Press.
[32]. Xiao, Q., McPherson, E. G., Simpson, J. R., & Ustin, S. L. (1998). Rainfall interception by Sacramento's urban forest.Journal of Arboriculture,24(4), 235–244.
[33]. Jenkins, J. C., Chojnacky, D. C., Heath, L. S., & Birdsey, R. A. (2003). National-scale biomass estimators for United States tree species.Forest Science, 49(1), 12–35. https: //doi.org/10.1093/forestscience/49.1.12
[34]. Chojnacky, D. C., Heath, L. S., & Jenkins, J. C. (2014). Updated generalized biomass equations for North American tree species.Forestry, 87(1), 129–151. https: //doi.org/10.1093/forestry/cpt053
[35]. Nowak, D. J., Crane, D. E., & Stevens, J. C. (2006). Air pollution removal by urban trees and shrubs in the United States.Urban Forestry & Urban Greening,4(3–4), 115–123. https: //doi.org/10.1016/j.ufug.2006.01.007
[36]. Climate Central. (2024). Urban heat hot spots in 65 cities [Dataset and maps]. Retrieved August 19, 2025, from https: //www.climatecentral.org/climate-matters/urban-heat-islands-2024