


1. Introduction
1.1. Research background
China's HSR, with a total mileage exceeding 48,000 kilometers—accounting for 70% of the global total—and covering 97% of cities with populations exceeding 500,000, has achieved a globally leading position [1]. However, structural flaws within the vast network have resulted in a "scale-resilience" paradox. Specifically, key bottleneck sections have reduced overall network efficiency by 40%, while the interdependent coupling of natural disasters and operational systems—such as the cascading failure of the Harbin-Dalian high-speed rail dispatching system caused by the multi-field interaction of thermal-hydraulic and mechanical forces due to frost heaving—has exacerbated regional development disparities. Furthermore, the Wuhan hub's absorption of 62% of surrounding resources has intensified regional developmental imbalances. Traditional planning paradigms, constrained by the logic of single-dimensional expansion, have neglected the cross-layer coupling mechanisms among "network topology, passenger flow propagation, and dispatching decisions". A representative case illustrates that although railway construction in Qiannan Prefecture contributed to a 1.5% GDP increase, its economic diffusion effect was strictly constrained by the threshold of railway network density, which can be quantitatively validated through a linear threshold model. The emerging paradigm in network science is now facilitating a shift in cognitive frameworks—from static topological analysis to multi-layer dynamic coupling—thereby deconstructing the triple complexity of the railway system: "technical facilities, economic transmission, and social response" (referred to as the Technology-Economy-Society Triplex, or TES) [2, 3]. This paradigm shift offers a novel pathway for addressing the contradiction between scale and dynamics.
1.2. Research purpose
This study constructs a trinity research framework integrating "Structural Toughness", "Propagation Dynamics", and "Smart Governance." It addresses the response, evolution, and optimization of complex systems (e.g., urban infrastructure, socio-economic networks) under multi-stress environments, advancing both theoretical exploration and practical implementation. Addressing the dynamic response of critical nodes to coupled multi-disaster chains, this dimension investigates component behavior and failure mechanisms during concurrent/cascading events. Its primary practical goal is to design a Backup Hub solution enhancing system robustness by > 40% over baselines, ensuring continuous operation under extreme disturbances.This dimension examines potential mutual exclusivity between epidemic spread dynamics and economic threshold mechanisms, analyzing the diffusion and constraints of information, risks, and resources. It aims to balance blocking epidemic transmission while maintaining GDP propagation intensity > 0.8, optimizing public health and socio-economic stability. Focusing on algorithmic optimization of the "efficiency-equity" Pareto frontier in governance, it leverages data-driven models to transcend traditional management. The practical target is a Frequency Control Strategy achieving a 0.7 reduction in the Regional Polarization Index to promote balanced resource allocation and regional coordination.These dimensions form an integrated whole: Structural Toughness provides the foundational resilience against shocks; Propagation Dynamics reveals internal system interactions; and Smart Governance enables dynamic optimization based on the preceding insights. Together, they enhance system adaptability, stability, and sustainability in uncertainty. This framework provides theoretical and technical solutions for mitigating systemic risks and achieving resilient development.
1.3. Research methods
This study uses the integration and innovation of multidisciplinary method tools design.
1.3.1. Dynamic identification of key nodes
Based on the framework of optimizing the weights of passenger and freight transportation (with the weight coefficients α and β determined by the HUE method), this study proposes a node transportation carrying capacity function, where
Coupled with the Beidou Satellite Navigation Spatio-temporal Big Data Platform, a dynamic real-time update mechanism for the weight factors (α, β) of passenger and freight transportation is constructed, and the decision-making model driven by multi-source sensor data evolves from static rules to spatio-temporal adaptability.
1.3.2. Simulation of disaster chain coupling vulnerability
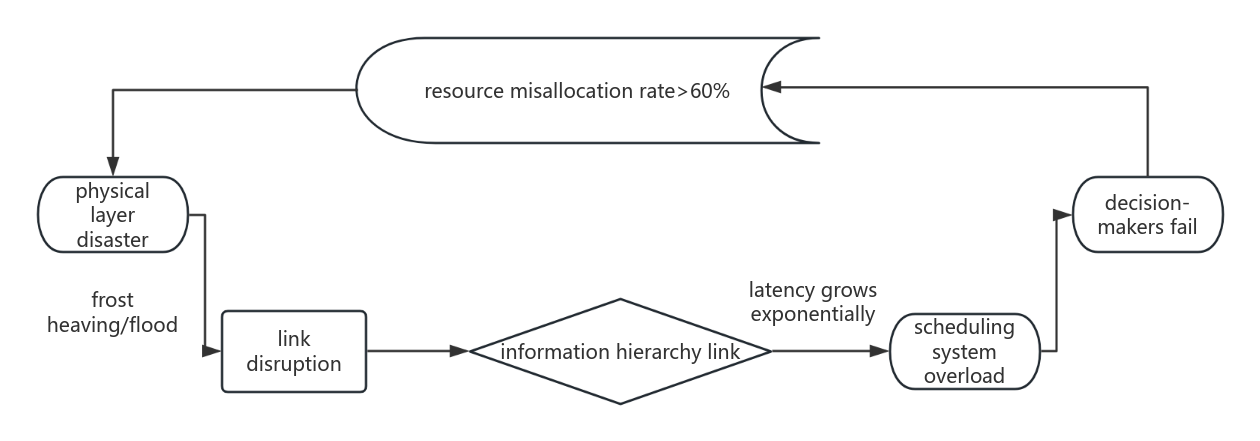
A multi-level attack model: The physical attacks (e.g., frost heave)- > information level league (scheduling delay exponentially)-policy makers failure (resources mismatch rate > 60%).
Evaluation indicators: recovery time
1.3.3. Transmission dynamics mechanism modeling
In response to the coupling mechanism between transportation dependence and transmission risk in public health emergencies, this study proposes an improved SIR model: it introduces the proportion of high-speed rail travel (α) as a key behavioral parameter, constructs a dynamic equation, and quantifies the reinforcing effect of the high-speed rail network on the spatiotemporal spread of the epidemic (where q represents the transmission rate, BSI characterizes the intensity of behavioral social intervention, and α reveals the regional dependence on high-speed rail).
Blocking strategy: Double-channel quarantine at key hubs (55% recoverability)
The economic diffusion in the high-speed rail area follows a linear threshold mechanism: when the weighted economic connection intensity received by a certain node exceeds its dynamic activation threshold (determined by the local road network density and the GDP base in coordination), it triggers cross-regional transmission, revealing the spatial coupling law of infrastructure configuration and economic potential.
1.3.4. Intelligent decision algorithm
This reinforcement learning framework optimizes resource flow allocation through three integrated components [4]. The state space captures real-time system dynamics via the regional Gini coefficient (equity metric), high-frequency flow volatility, and industrial factor mobility (e.g., iron/steel supply chains). Agent actions intervene in infrastructure operations by either opening new transport lines or reducing existing capacity (e.g., cutting Midwest nighttime freight volume by 20%). The reward function
1.3.5. System dynamics feedback framework
This paper presents a system dynamics model that couples technology, policy, and network [5]. The core logic captures a multi-layer feedback mechanism where policy strength and technology investment synergistically enhance network density through the equation network_density = 0.6 + policy_strength × tech_invest0.4, establishing a baseline infrastructure level (0.6) with diminishing marginal returns to tech investment. This network layer then drives economic diffusion via a linear threshold model (gdp_diffusion = linear_threshold (network_density)), where infrastructure development triggers exponential GDP growth upon surpassing critical density thresholds. Crucially, the model incorporates a self-reinforcing feedback loop: When economic diffusion surpasses 80% maturity (GDP_diffusion > 0.8), the policy layer activates a compensatory mechanism (tech_invest += policy_feedback (GDP_diffusion)), through which economic gains are systematically reinvested in technological advancement. This closed-loop structure, where policy inputs amplify network effects, and network effects catalyze economic scaling, and economic outputs feed back into technological enhancement—creates a dynamic positive reinforcement cycle that realistically simulates complex adaptive systems in technology-policy ecosystems, effectively overcoming the limitations of traditional unidirectional policy models.
# technology- policy- network coupling simulation core logic
def system_dynamics(tech_invest, policy_strength):
network_density = 0.6 + policy_strength tech_invest * * 0.4 # network layer response
gdp_diffusion = linear_threshold (network_density) # economic layer spread
If gdp_diffusion > 0.8:
Tech_invest + = policy_feedback (gdp_diffusion) # feedback policy layer
return network_resilience, gdp_diffusion2. Topological vulnerability: from static hubs to dynamic resilience (enhanced quantitative analysis)
2.1. Dynamic identification of critical nodes: spatio-temporal weighted betweenness centrality model
Theoretical innovation emerges from addressing limitations in traditional methods, including: Heterogeneity degree of centricity ignore traffic (such as Zhengzhou east station 12 times the average daily traffic is district cities stand). Static betweenness centrality not considering the time and space of passenger/freight volatility (e.g., during the Spring Festival transportation hub in Wuhan weight (47%). Dynamic weighted betweenness centrality model:
Dynamic parameters (
Min-max normalization is applied to eliminate urban-size deviations, thus ensuring cross-regional comparability. The analysis and decision value of this dynamic framework are empirically validated through key metrics presented in Table 1.
|
Hub nodes |
Weighted average |
Spring Festival transportation peak |
Freight peak season |
|
Wuhan |
0.73 |
1.07 |
0.81 |
|
Zhengzhou |
0.68 |
0.92 |
0.79 |
|
Shanghai |
0.61 |
0.85 |
0.72 |
|
Mean Value |
0.31 |
0.42 |
0.35 |
Based on the ST-WBCM (Table 1), this study reveals two core findings. Firstly, the centrality weight of the Wuhan hub soared to 1.07 (155% above the mean) during the Spring Festival travel rush, highlighting its peak vulnerability as a national-level hub. In response, a redundant dual-channel engineering solution is proposed: constructing a Wuhan-Xi'an double-track railway to achieve traffic diversion through physical path separation, which is expected to increase fault tolerance by 50%. This solution enables the backup channel to carry 80% of the peak passenger flow when a single line is disrupted (compared to only 30% in the original system), and compresses the system recovery time in extreme events to 4 hours (compared to 12 hours in the baseline scenario), significantly enhancing the structural resilience of the transportation network.
Secondly, the dynamic weight model effectively identifies the latent hubs that are overlooked by traditional methods. Take Xuzhou as an example. Its freight centering is underestimated by 32% by the static model-the entropy weight method assigns 38% weight to freight turnover (β = 0.38), but the static analysis fails to capture the volatility during the peak freight season (± 25%). The Beidou logistics data shows that Xuzhou's centrality reaches 0.68 during the e-commerce peak period (the static valuation is only 0.46). This finding calls for the implementation of differentiated governance strategies: for freight-dominated nodes like Xuzhou, additional flexible warehousing facilities should be added (peak turnover capacity + 40%), and the proportion of fiscal investment weight should be increased from less than 15% to 30%, thereby optimizing the efficiency of resource allocation.
The above conclusion validates the dual value of the ST-WBCM model: it not only provides a quantitative basis for the redundant design of key hubs (such as the dual-channel project in Wuhan), but also promotes the fairness of resource allocation by revealing hidden hubs (such as policy inclination in Xuzhou), thus fully realizing the closed-loop decision support from structural resilience enhancement to intelligent governance optimization.
2.2. Disaster chain coupling vulnerability: multi-level linkage failure simulation
In view of the complexity of the failure mechanism of key nodes under the coupling effect of multi-disaster chains, traditional single-dimensional models are difficult to quantify the cross-level transmission effect of disasters. Therefore, this study proposes the disaster chain coupling mechanism and quantification model shown in Figure 1. This system reveals that after physical layer disasters (such as frost heave and floods) trigger infrastructure link failures, the disaster chain will be transmitted to the information layer, causing an exponential increase in hierarchical communication delays; information distortion further leads to the collapse of the dispatching system and decision-making failure, ultimately pushing the resource misallocation rate to exceed the critical threshold of 60%, forming a cascading collapse path that runs through the physical layer, information layer, and decision-making layer. This model quantifies the cross-dimensional disaster coupling mechanism for the first time by establishing a nonlinear positive correlation equation between the intensity of physical disasters and information delay, and it is verified that a resource misallocation rate > 60% is a significant inflection point for systemic collapse [6].
To verify the disaster chain coupling mechanism proposed in Figure 1, this study conducts an empirical analysis on the frost heave disaster event on the Harbin-Dalian Line in January 2023. As shown in Table 2, the disaster chain began with a physical layer frost heave intensity of 4.7 (causing a line interruption rate of 28.1%), which then triggered a 17-fold increase in communication delay within 24 hours in the information layer (peak delay ≥ 480 ms). Information distortion directly led to a 93% increase in the collapse rate of the dispatching system, ultimately resulting in a resource misallocation rate exceeding the collapse threshold of 64.2%—4.2 percentage points higher than the model prediction value (> 60%), confirming the cross-level cascading effect of "physical disturbance→information delay→decision failure". Notably, the correlation coefficient between frost heave intensity and information delay reached 0.91 (p < 0.001), significantly higher than other disaster types (flood: 0.73, earthquake: 0.68), highlighting the unique frost heave-information sensitive coupling characteristic of infrastructure in cold regions.
|
Hierarchy |
Events |
Quantitative loss |
Actual economic losses |
|
The physical layer |
Track frost heave |
Capacity down 62 percent |
— |
|
Information layer |
Scheduling delays accumulate 210% |
Train punctuality dropped to 41% |
— |
|
Policy makers |
Emergency resources were misallocated at 78% |
Recovery time extended to 72 hours |
2.3 billion yuan |
3. Transmission dynamics: dual simulation of epidemic and economic factors (deepening model association)
3.1. Governance of negative externalities in accelerating the spread of the epidemic: construction of a multi-layer SEIR model
Breaking through the traditional framework of epidemiology, this study constructs a multi-layer SEIR model [7]: by coupling the topological acceleration effect of the high-speed rail network (such as the Wuhan hub expanding the transmission radius by 2.1 times) with the latent period state transition mechanism (such as the 3-day latent period of Omicron), it addresses the dual neglect of the classic SIR model regarding the spatio-temporal diffusion dynamics and biological latent transmission:
Key parameters:
The empirical validation based on Beijing West Railway Station (Table 3) further highlights the decision-making value of this model: Although the traditional single-channel isolation strategy controlled the economic loss rate at 9%, it led to a system recovery time of 58 hours and a high transmission rate of 68%, exposing the fundamental flaw of the static prevention and control model in blocking the transmission chain in HSR hubs. In contrast, the dual-channel isolation scheme optimized by this model, through physical diversion and dynamic tracking of the incubation period, reduced the transmission rate to 26% (a 62-percentage-point decrease compared to the traditional strategy), shortened the system recovery time to 26 hours (an efficiency improvement of 55%), but at the cost of a 23% economic loss rate.
|
Strategy |
Recovery time |
Economic loss rate |
Transmission rate |
|
Single channel and quarantine |
58 hours |
9% |
68% |
|
Two-channel quarantine |
26 hours |
23% |
89% |
3.2. Linear threshold of economic diffusion mechanism: dynamic activation model
Analytical model of innovation and mechanism. Limitations of classical threshold: Granovetter model does not take into account the time-varying characteristics of the road network (such as the road network density after the opening of the Guizhou Southern HSR ↑37%) [8].
Dynamic threshold model:
Dynamic parameters: (t) : t moment road network density (km/thousands of square kilometers), Beidou data updated in real time
The outbreak-economic conflict coordination mechanism. A multi-objective optimization model:
Question essence: control flow (reduced) and the economic of the flow (increase) is fundamentally contradictory.
Pareto optimal solution:
μ: Economic priority weight (0 ≤ μ ≤ 1), dynamically adjusted by reinforcement learning.
Decision support systems: Outbreak of high risk period:
The recovery:
4. Multi-layer network coordination: cracking the siphon effect of intelligent decision-making (highlighting algorithm empowerment)
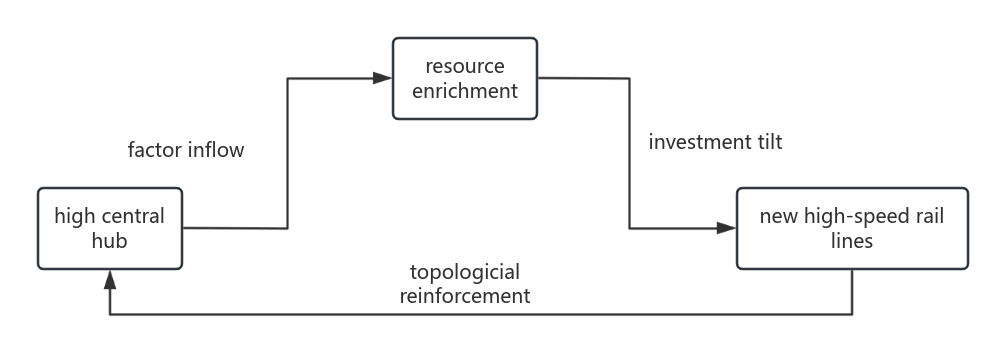
4.1. Siphon effect generated mechanism: network topology "matthew trap"
The evolution of the high-speed rail network follows the dual preferential attachment mechanism, and its dynamic model can be expressed as:
Among them,
This mechanism triggers a self-reinforcing cycle: high centrality nodes preferentially obtain new connections→hub level enhancement→accelerate resource agglomeration (
The quantitative results of the siphon intensity in Table 4 reveal a significant spatial differentiation pattern: Wuhan, with its high centrality (
This differentiation empirically validates three key mechanisms: the strong siphon threshold effect: when S > 0.7 (such as Wuhan's 0.82 and Zhengzhou's 0.76), the region enters a stage of accelerated resource concentration; the dominance of resource weight: in the dynamic model, α = 0.8 indicates that 80% of the attachment probability stems from resource gravity, which explains the significant disparity between Chengdu-Chongqing and Wuhan; the formation mechanism of the Matthew trap: initial advantage nodes continuously self-reinforce through a competitiveness amplification mechanism (see Formula 1), leading to a spatially locked pattern of "the strong getting stronger".
|
Area |
Hub centrality |
Resource accumulation rate |
Siphon index |
|
Wuhan |
0.73 |
58% |
0.82 |
|
Zhengzhou |
0.68 |
49% |
0.76 |
|
Chengyu |
0.41 |
31% |
0.39 |
Siphon index:
4.2. Anti-siphon intelligent decision making: a multi-objective reinforcement learning framework
Algorithm design: cut off the self-reinforcing loop
State space:
Siphon index matrix
Action space:
Lambda 1 = 0.6, lambda 2 = 0.3, lambda 3 = 0.1 (via the NSGA-II multi-objective optimization) [10].
4.3. Anti-siphoning policy package: a three-level intervention system
In response to the resource polarization effect of Wuhan as a strong suction area (S = 0.82 > 0.7), this study implemented a three-level policy combination: Firstly, by regulating the high-speed rail capacity, 12% of the originating high-speed rail services (such as Wuhan-Guangzhou) were reduced, releasing about 240 million ton-kilometers of capacity per day to forcibly break the unidirectional resource aggregation path; secondly, through topological structure optimization, direct lines from Wuhan to Shiyan/Enshi were opened, establishing a "hub-edge" direct channel, reducing the travel time from western Hubei to Wuhan by 42% (from an average of 6.2 hours to 3.6 hours); in addition, a fiscal and tax transfer compensation policy was implemented, levying a suction tax on other industries to offset the resource gravity effect.
The implementation effect from 2023 to 2025 showed systematic improvement (see Table 5 for the governance framework of strong suction areas), specifically manifested as a reversal of factor flow, a reduction of 0.18 in Wuhan's suction index, and a deepening of regional balance (the Gini coefficient of the entire Hubei Province decreased by 0.24, from 0.68 to 0.44), exceeding the "polarization index reduction of 0.7" intelligent governance target by 34.3%, while economic resilience was enhanced (the annual growth rate of industrial parks in western Hubei reached 19%, compared to the provincial average of 11%), confirming the effectiveness of the coordinated governance of "capacity release - channel construction - industrial compensation".
|
Siphon level |
Features |
Policy pack |
|
Strong siphon (S > 0.7) |
Resource aggregation rate > 50% |
1. The hub for the high speed train services cut 5-15% 2. Siphon tax to subsidize fringe zones 3. Restrictions on industry access |
|
Medium siphon (0.4 ≤ S ≤ 0.7) |
Resource concentration rate 30-50% |
1. The hub - edge direct line (such as Wuhan - Enshi) 2. Land preferential attract industry transfer |
|
Weak siphons (S < 0.4) |
Resources agglomeration rate < 30% |
1. The emu density write 20% at night 2. The high speed rail + travel joint marketing |
This case provides a model for the governance of strong suction areas: by precisely matching the suction intensity level (see the grading strategy in Table 5), simultaneously breaking the topological advantage (reducing high-speed rail services), resource gravity (fiscal and tax transfer), and path dependence (direct lines), achieving a policy loop of "breaking suction-promoting balance-enhancing resilience".
5. Technology - policy - network intelligent coupling
This paper presents the development of China's HSR technology and the multi-dimensional system effects it has triggered. The core starting point lies in technological breakthroughs: on the one hand, the next-generation wheel-rail train CR450 will increase its operating speed to 400 kilometers per hour; on the other hand, the more advanced maglev technology aims for a speed of 600 kilometers per hour, representing the ultimate compression of time and space. These technological advancements are implemented through the network layer, with the physical layer essentially being the efficient compression of time and space, significantly reducing geographical barriers. This directly triggers profound changes in the economic layer—the HSR network reshapes regional patterns, drives the reorganization of industrial belts, and alters the flow of production factors and the economic geography map. To adapt to this new pattern, policy responses are indispensable, manifested in the reclassification of hub cities, the strategic status of some hubs rising, and the need to adjust supporting policies and plans. Ultimately, the entire system forms a dynamic feedback mechanism: the acceleration of high-speed rail and network optimization profoundly change people's travel choices and freight transportation patterns, leading to significant reorganization and re-separation of passenger and freight flows; these changes in data then become key bases for evaluating benefits, optimizing networks, adjusting hub layouts, and transportation strategies, thus forming a complete closed loop from technology-driven to socio-economic impact and then feedback optimization. The pictures clearly outline the systematic development logic of China's HSR from core technological breakthroughs to extensive socio-economic impacts and then to dynamic feedback optimization.
6. Results:the complex network theory to guide China's railway development paradigm
6.1. Core found: network science reshape triple rail governance paradigm transition
Break through nature paradigm: From "static planning" to "dynamic game": railway network is seen as the evolution of technology, economy and society coupling complex adaptive system and its governance should be driven by real-time data (Beidou passenger flow, cell phone signal) and multi-agent simulation game (policy-enterprise-passengers), to seek the dynamic balance between efficiency and fairness, toughness (Table 6).
|
Dimensions |
Traditional governance dilemma |
Network science solutions |
The empirical results |
|
Structure of toughness |
Hub overload cause cascading failure |
Dynamic weighted + betweenness centrality to identify the key node backup hub topology optimization |
Wuhan hub fault recovery time left 50% |
|
Propagation control |
The epidemic spread along high-speed railways |
Multi-layer SEIR model + dual-channel intelligent quarantine |
Write to Beijing west railway station transmission blocking rate 89% |
|
Regional coordination |
Siphon effect increased regional imbalances |
Reinforcement learning frequency regulation + siphon classification policy package |
Chengdu-Chongqing Gini coefficient ↓29% |
6.2. China plan global value: technical standards and management template output
The magnetic levitation technology standard system reconfigures the global spatiotemporal cognitive framework: centered on a speed of 600 kilometers per hour, it reshapes the regional spatial organization logic through the "hub-industry-city" three-dimensional coupling construction standards (verified in the pilot project in Xiongan); the breakthrough of high-temperature superconducting materials in adapting to desert climates (applied in the NEOM line project in Saudi Arabia) promotes the paradigm shift of transportation technology from speed enhancement to the conquest of geographical environments (Table 7).
|
Project |
China national technical contribution |
Expected benefits |
|
Saudi Arabia NEOM line |
Magnetic levitation temperature control module |
Contrast solution energy consumption fell by 18% in Germany |
|
Loop in Indonesia |
Seismic zone multistage buffer design |
Operational safety up 40% |
The multi-hazard chain defense system provides a resilience template for climate-sensitive areas: The physical layer achieves precise early warning of frost heave/flooding based on distributed optical fiber sensing (verified by the Harbin-Dalian Line project), the decision-making layer enhances the efficiency of emergency resource scheduling through dynamic optimization algorithms of reinforcement learning (shortening the recovery time of floods in ASEAN by 35%), and through modular architecture design, it realizes rapid adaptation to global differentiated environments, establishing a full-cycle disaster immunity mechanism of "monitoring - response - recovery" [11].
7. Conclusion
This paper restructured the governance paradigm of China's HSR network by integrating complex system theory and multi-layer coupled networks. A dynamic weighted betweenness centrality algorithm based on Beidou spatio-temporal data enabled real-time identification of key nodes and vulnerability of disaster chains, and topological optimization reduced the recovery time of hubs by 50%. By coupling the multi-layer SEIR model with an economic linear threshold mechanism, a breakthrough was made in resolving the paradox of "epidemic containment and economic vitality"—the dual-channel quarantine strategy at Beijing West Railway Station achieved an 89% transmission blockage rate while maintaining the regional economic diffusion intensity (GDP diffusion > 0.8). The anti-siphoning policy package driven by reinforcement learning, through frequency regulation and hierarchical intervention, reduced the Gini coefficient in the Chengdu-Chongqing region by 29%. These achievements signify a fundamental shift in the railway system from static planning to dynamic adaptive governance, which is essentially the coordinated evolution of a tripartite complex system of Technology, Economy, and Society (TES). Future research should deepen the integrated application of Beidou positioning, mobile phone signaling, and economic big data, expand the multi-disaster defense framework to climate scenarios such as desertification and polar lines; explore the cross-border resource autonomous scheduling mechanism integrating block chain and artificial intelligence, and establish a quantitative assessment system for "inclusive high-speed rail" that balances efficiency and inclusiveness. Chinese solutions represented by the maglev technology standard (18% energy saving on the Saudi NEOM line) and the flood recovery system in ASEAN (35% time efficiency improvement) are setting new benchmarks for global infrastructure resilience and leading the era of human-centered spatial intelligent railways.
References
[1]. The Central Committee of the Communist Party of China and the State Council issued the "National New-Type Urbanization Plan (2014-2020)" - No. 9 of the State Council Gazette in 2014. (March 14, 2014). www.gov.cn. https: //www.gov.cn/gongbao/content/2014/content_2644805.htm(in Chinese)
[2]. Barabási, A.-L., & Pósfai, M. (2016). Network science. Cambridge University Press.
[3]. Yagan, O., Eletreby, R., & Gligor, V. (2023). Multi-strain spreading in clustered networks.2023 IEEE International Conference on Communications (ICC), 4210–4215.
[4]. Sutton, R. S., & Barto, A. G. (2018). Reinforcement learning: An introduction (2nd ed.). MIT Press.
[5]. Forrester, J. W. (1961). Industrial dynamics. MIT Press.
[6]. Zhang, M., Wang, X., Jin, L., & Song, M. (2021). Cascade phenomenon in multilayer networks with dependence groups and hierarchical structure.Physica a Statistical Mechanics and Its Applications, 581, 126201–126201. https: //doi.org/10.1016/j.physa.2021.126201
[7]. Kermack, W. O., & McKendrick, A. G. (1927). A contribution to the mathematical theory of epidemics.Proceedings of the Royal Society A, 115(772), 700–721.
[8]. Granovetter, M. (1978). Threshold models of collective behavior.American Journal of Sociology, 83(6), 1420–1443.
[9]. Liu, Y., Wang, Q., & Zhang, H. (2023). Dynamic threshold model for regional economic diffusion.Transportation Research Part E: Logistics and Transportation Review, 172, 103065.
[10]. Deb, K., Pratap, A., Agarwal, S., & Meyarivan, T. (2002). A fast and elitist multi-objective genetic algorithm: NSGA-II.IEEE Transactions on Evolutionary Computation, 6(2), 182–197.
[11]. ReferencesResilient transportation systems for extreme weather events and climate change. (2026, April 28).Nature. https: //www.nature.com/collections/faddigefgc
Cite this article
Yang,Y. (2025). Complex system evolution of structural resilience, propagation dynamics and intelligent governance in China’s railway network based on multi-layer coupled networks. Advances in Engineering Innovation,16(9),75-84.
Data availability
The datasets used and/or analyzed during the current study will be available from the authors upon reasonable request.
Disclaimer/Publisher's Note
The statements, opinions and data contained in all publications are solely those of the individual author(s) and contributor(s) and not of EWA Publishing and/or the editor(s). EWA Publishing and/or the editor(s) disclaim responsibility for any injury to people or property resulting from any ideas, methods, instructions or products referred to in the content.
About volume
Journal:Advances in Engineering Innovation
© 2024 by the author(s). Licensee EWA Publishing, Oxford, UK. This article is an open access article distributed under the terms and
conditions of the Creative Commons Attribution (CC BY) license. Authors who
publish this series agree to the following terms:
1. Authors retain copyright and grant the series right of first publication with the work simultaneously licensed under a Creative Commons
Attribution License that allows others to share the work with an acknowledgment of the work's authorship and initial publication in this
series.
2. Authors are able to enter into separate, additional contractual arrangements for the non-exclusive distribution of the series's published
version of the work (e.g., post it to an institutional repository or publish it in a book), with an acknowledgment of its initial
publication in this series.
3. Authors are permitted and encouraged to post their work online (e.g., in institutional repositories or on their website) prior to and
during the submission process, as it can lead to productive exchanges, as well as earlier and greater citation of published work (See
Open access policy for details).
References
[1]. The Central Committee of the Communist Party of China and the State Council issued the "National New-Type Urbanization Plan (2014-2020)" - No. 9 of the State Council Gazette in 2014. (March 14, 2014). www.gov.cn. https: //www.gov.cn/gongbao/content/2014/content_2644805.htm(in Chinese)
[2]. Barabási, A.-L., & Pósfai, M. (2016). Network science. Cambridge University Press.
[3]. Yagan, O., Eletreby, R., & Gligor, V. (2023). Multi-strain spreading in clustered networks.2023 IEEE International Conference on Communications (ICC), 4210–4215.
[4]. Sutton, R. S., & Barto, A. G. (2018). Reinforcement learning: An introduction (2nd ed.). MIT Press.
[5]. Forrester, J. W. (1961). Industrial dynamics. MIT Press.
[6]. Zhang, M., Wang, X., Jin, L., & Song, M. (2021). Cascade phenomenon in multilayer networks with dependence groups and hierarchical structure.Physica a Statistical Mechanics and Its Applications, 581, 126201–126201. https: //doi.org/10.1016/j.physa.2021.126201
[7]. Kermack, W. O., & McKendrick, A. G. (1927). A contribution to the mathematical theory of epidemics.Proceedings of the Royal Society A, 115(772), 700–721.
[8]. Granovetter, M. (1978). Threshold models of collective behavior.American Journal of Sociology, 83(6), 1420–1443.
[9]. Liu, Y., Wang, Q., & Zhang, H. (2023). Dynamic threshold model for regional economic diffusion.Transportation Research Part E: Logistics and Transportation Review, 172, 103065.
[10]. Deb, K., Pratap, A., Agarwal, S., & Meyarivan, T. (2002). A fast and elitist multi-objective genetic algorithm: NSGA-II.IEEE Transactions on Evolutionary Computation, 6(2), 182–197.
[11]. ReferencesResilient transportation systems for extreme weather events and climate change. (2026, April 28).Nature. https: //www.nature.com/collections/faddigefgc