


1. Introduction
Tobacco vibration sorting screen as the core equipment of the tobacco industry silk quality inspection, its sorting accuracy directly affects the whole silk rate and broken silk rate determination results. However, in the actual operation process, tobacco hanging on the screen mesh and cleaning process of the shredding problem has existed for a long time, which not only reduces the screening efficiency, but also leads to the detection of data distortion. The traditional manual sweeping or mechanical brush cleaning method is easy to exacerbate the fragmentation of tobacco, and it is difficult to completely solve the problem of screen clogging [1]. Therefore, the development of an efficient and low-damage non-contact tobacco cleaning device has become a technical challenge to be solved in the tobacco industry.
Numerous scholars have carried out a lot of research in the field of vibratory screening and particle separation. Tsuji et al [2] pioneered the CFD-DEM coupling method to lay the foundation for gas-solid two-phase flow simulation. Cleary et al [3] applied the DEM method for the first time to simulate the study of industrial-scale vibrating screen, and established the theoretical basis of particle screening. Zhou et al [4] studied the air flow assisted vibratory screening process through the CFD-DEM coupling method and found that the appropriate air flow velocity can significantly improve the screening efficiency. Hilton et al [5] developed a special contact model for fibrous particles, which provides a new idea for the simulation of flexible materials such as tobacco. Chu et al [6] developed a particle contact model considering the effect of humidity, which is suitable for the simulation of hygroscopic materials such as tobacco. Han et al [7] developed a fiber-fiber contact algorithm, which supports high length and diameter of the fiber and is applicable to the simulation of hygroscopic materials such as tobacco. fiber contact algorithm to support the simulation of the dynamics of materials with high aspect ratios. Irazábal et al [8] optimized the contact parameter calibration process for flexible fibers (e.g., tobacco filaments) by combining machine learning with DEM. Although the above studies have made progress in particle dynamics and CFD-DEM methods, they are still inadequate for the specific scenario of tobacco filament clearing. Existing fiber models are mostly for rigid fibers, which do not fully consider the flexible deformation characteristics of tobacco filaments, while models based on DEM simulating flexible particles with plastic bending deformation can more accurately reflect the particle flow characteristics [9-13]. And the above studies lack the quantitative analysis of the synergistic effect of screen vibration and air flow in the gas-solid coupling study.
In this study, a coupled CFD-DEM method is proposed to establish a contact model of JKR tobacco filament considering surface energy (5 J/m²) based on Hilton's fiber contact theory. The dynamic process of tobacco filament detachment from the screen was investigated by comparing the simulation of multiple working conditions (wind velocity of 12 m /s - 20 m /s, vibration frequency of 30 Hz-70 Hz). The research results will provide the tobacco industry with a theoretically well-founded and engineering feasible intelligent clearing program, and promote the automation and upgrading of inspection equipment.
2. Simulation model of tobacco sorting
2.1. Geometrical modeling of the cleaning device and tobacco
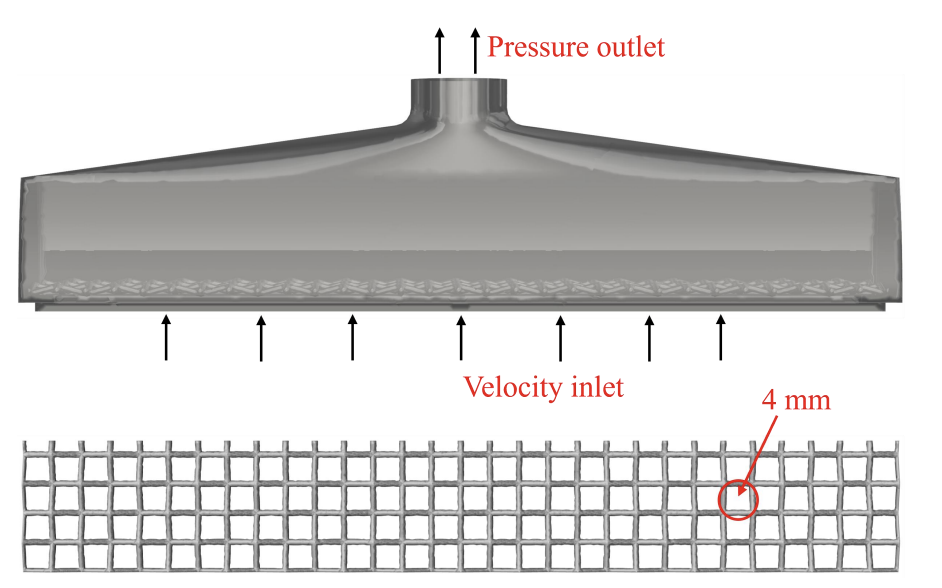
The geometrical model of the tobacco cleaning device adopts a conical screen structure with a screen aperture of 4.5 mm, a conical cleaner outlet with a diameter of 13 mm to form an airflow acceleration zone, and a bottom cleaning surface designed as a 120 mm×18 mm strip to extend the contact time between the tobacco and the airflow. With an inlet flow rate of 16 m / s, 50 Hz vibration frequency to make the tobacco in the gravity, airflow trailing force and mechanical vibration of the synergistic effect, to achieve the effect of cleaning. The model is shown in Fig 1.
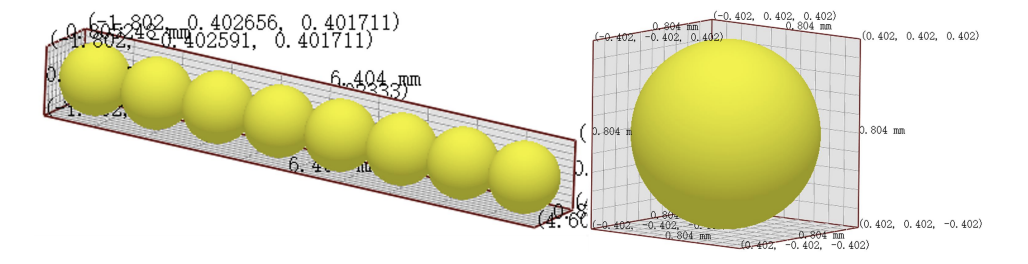
The flexible tobacco filament consists of individual spheres with a radius of 0.4 mm, and for the flexible tobacco particles with a length of 6 mm, the EDEM's own Hertz-Mindlin with JKR [14] contact model was used to accurately characterize their viscoelastic behavior. The flexible tobacco filament model is shown in Fig 2. The detailed geometric parameters and boundary conditions are shown in Table 1.
|
Bottom dimensions of the sorting unit |
120 mm×18 mm |
|
Top outlet size |
13 mm |
|
Sieve mesh hole size |
4 mm |
|
Baseline particle size |
0.4 mm |
|
Tobacco length |
6 mm |
|
Inlet velocity |
16 m/s |
|
Frequency of screen vibration |
50 Hz |
|
JKR |
5 J/m2 |
2.2. Grid segmentation and irrelevance verification
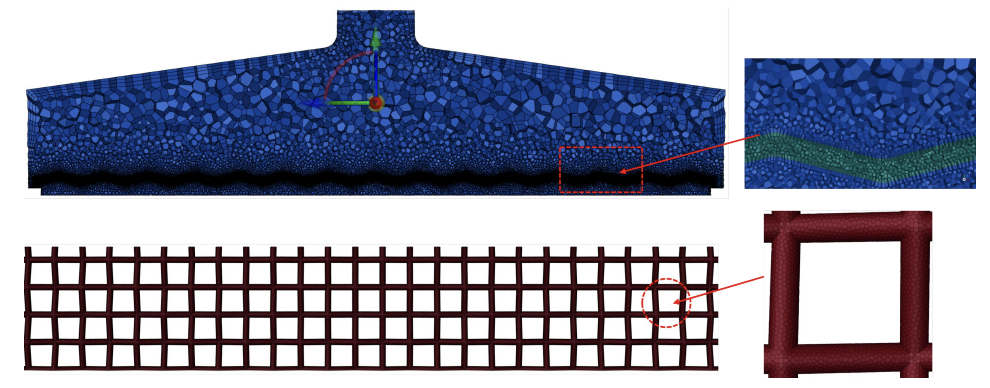
The meshing is performed using Fluent Meshing's own hexahedral meshing function, and this method can reduce the number of cells by 30%-50% with its regular topology compared to tetrahedral meshing, while maintaining higher numerical accuracy [15]. It can accurately capture the high-speed gradient region near the screen in the tobacco clearing device, and the structured nature of the hexahedron can avoid the false diffusion caused by twisted cells and reduce the particle trajectory error. The final delineated mesh is shown in Fig. 3.
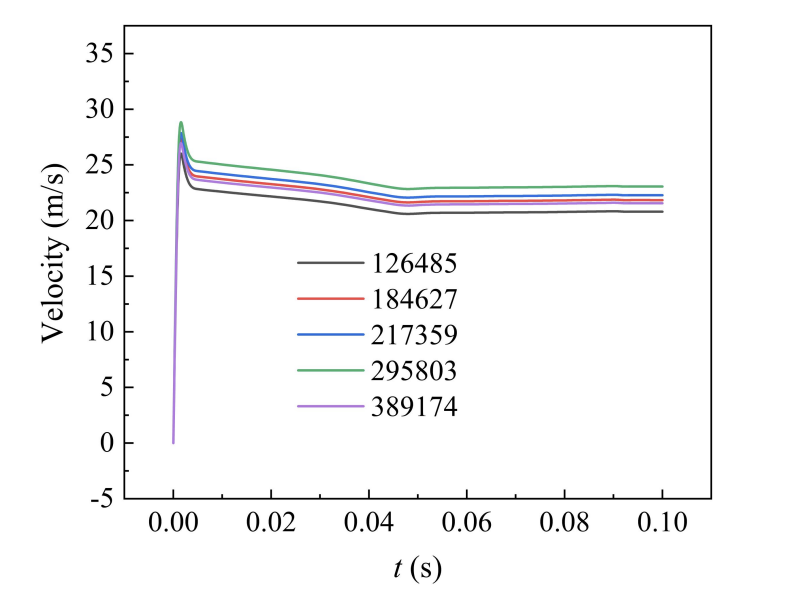
The accuracy, number of meshes, has a great influence on the numerical simulation results [16]. To ensure that the accuracy and reliability of the numerical simulation results are not affected by the mesh division method, the model is divided five times with different sizes, and the mesh models with the number of meshes of 126485, 184627, 217359, 295803, and 389174 are obtained. The velocity values at the monitoring point (at the center of the screen) are compared for different grid numbers. The velocities at the center of the sieve mesh under different number of grids are shown in Fig. 4, which can be seen. When the number of grids increases from 184627 to 217359, the fluctuation range of the velocity values at the monitoring point always remains within the interval of 0-0.1 m/s, and the velocity curves under different grid densities are almost completely overlapped, with a maximum relative deviation of less than 1%. For example, the velocity is 0.052 m/s for grid 184,627 and 0.053 m/s for grid 217,359 at t = 0.06 s. Therefore, choosing the grid number of 184,627 can ensure the reliability of the calculation results and save the calculation resources.
3. Gas-solid two-phase flow governing equations
3.1. Gas-phase governing equations
In the CFD module, the time-averaged governing equations in the Eulerian framework are used to describe the liquid phase. The mass and momentum conservation equations [17] are as follows.
where: αg is the gas phase volume fraction; ρg is the gas phase density; ug is the gas phase velocity; p represents the fluid pressure;
3.2. Solid-phase governing equations
In the DEM module, solid particles are tracked individually in a Lagrangian frame. The acceleration, velocity and position of each particle can be accurately obtained by Newton's second law of motion. The translation and rotation of the particles are described by [17,18]:
where
3.3. Trailing force equations
The drag force model proposed by Gidaspow was used to calculate the drag force [19]:
where β is the momentum exchange coefficient and CD is the drag force coefficient for a single particle relying on particle Reynolds number (Rep).
The turbulence model is chosen to be the practical and efficient standard k-ε model [20], which can be better integrated with the DEM algorithm to quickly simulate gas-solid two-phase systems.
where k represents the turbulent kinetic energy; ϵ is the turbulent dissipation rate;
4. Results and discussion
4.1. Fluid velocity
Due to the significant difference in the separation efficiency of tobacco filaments at different inlet velocities [21-23], this section explores the cleaning effect of tobacco particles at different inlet velocities, and analyzes and compares the velocity, force, and velocity changes in the flow field of tobacco filaments with inlet velocities of 12 m/s, 14 m/s, 16 m/s, 18 m/s, and 20 m/s, respectively.
Fig. 5 shows the different entrance velocity, smoke cleaner cross-section of the flow field velocity cloud, it can be seen, with the entrance velocity increased from 12 m/s to 20 m/s, the flow field distribution presents obvious gradient change rule: in 12 m/s, the high-speed zone (red - yellow) range is narrow and concentrated in the vicinity of the entrance, the velocity decays rapidly, the overall laminar flow characteristics; with the velocity increased to 16 m/s, the high-speed With the velocity increasing to 16 m/s, the core area is significantly expanded (yellow band through the middle of the cone), the axial and radial velocity gradient tends to be equalized, and the transitional flow state is dominant; when the velocity reaches 20 m/s, the high-speed area accounts for a further increase, but the red-blue area is staggered distribution, which indicates that turbulence pulsation is enhanced, the local occurrence of over-speed spots, and the uniformity of the flow field decreases. The morphological differences of color stratification at different velocities intuitively reflect the transition process of the flow regime from laminar to turbulent, in which the continuous high-velocity core area and moderate gradient at 16 m/s condition indicate that the flow field structure is most conducive to stable transport.
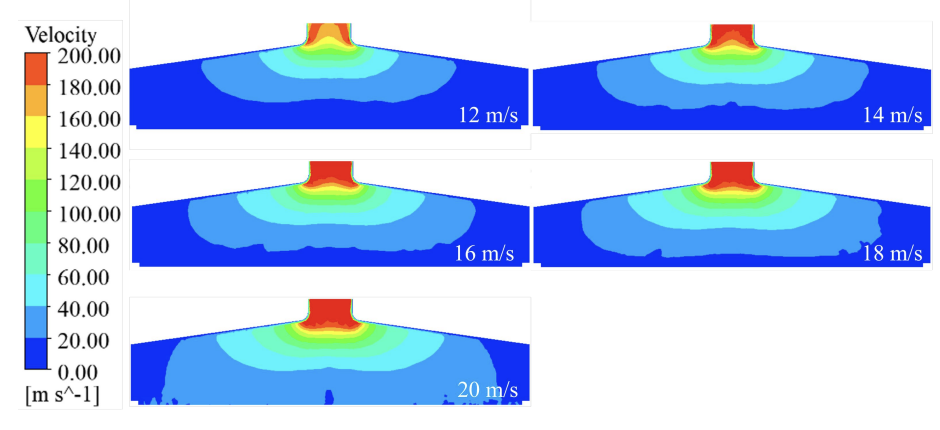
Fig. 6 shows the velocity distribution of the flow field near the screen mesh along the x-direction, and it can be seen that with the increase of the inlet velocity from 12 m/s to 20 m/s, the velocity of the flow field near the vibrating screen mesh has an overall increasing trend, and the distribution curves under each velocity condition show the characteristics of a rapid increase and then tend to flatten out. At the same x position, the value of flow field velocity increases sequentially with the increase of inlet velocity. Due to the mechanical disturbance of the vibrating screen mesh and gas-solid interaction, significant velocity oscillations are formed in the low velocity region of 12-14 m/s. The velocity of the flow field at the same x position increases with the increase of inlet velocity. As the velocity increases to 16-20 m/s, the increased inertia of the particles leads to their asynchronous motion with the airflow, resulting in the flow field velocity showing non-periodic localized velocity bursts.
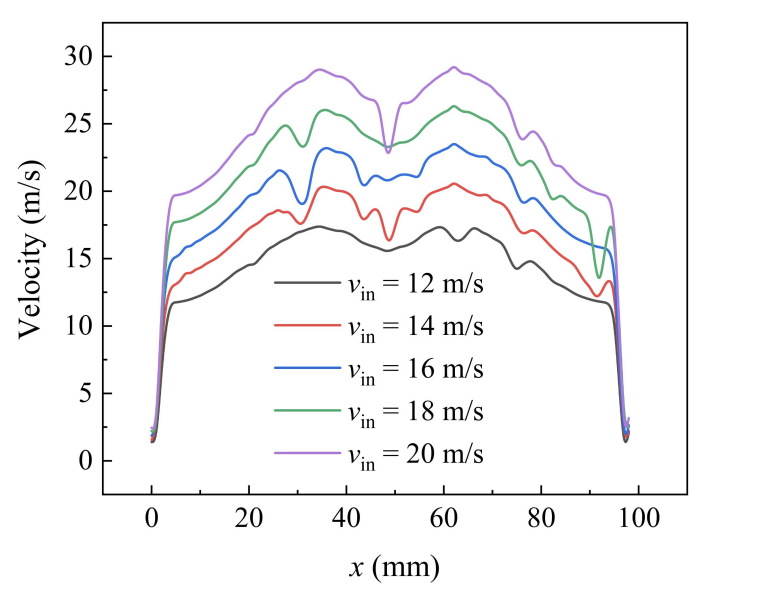
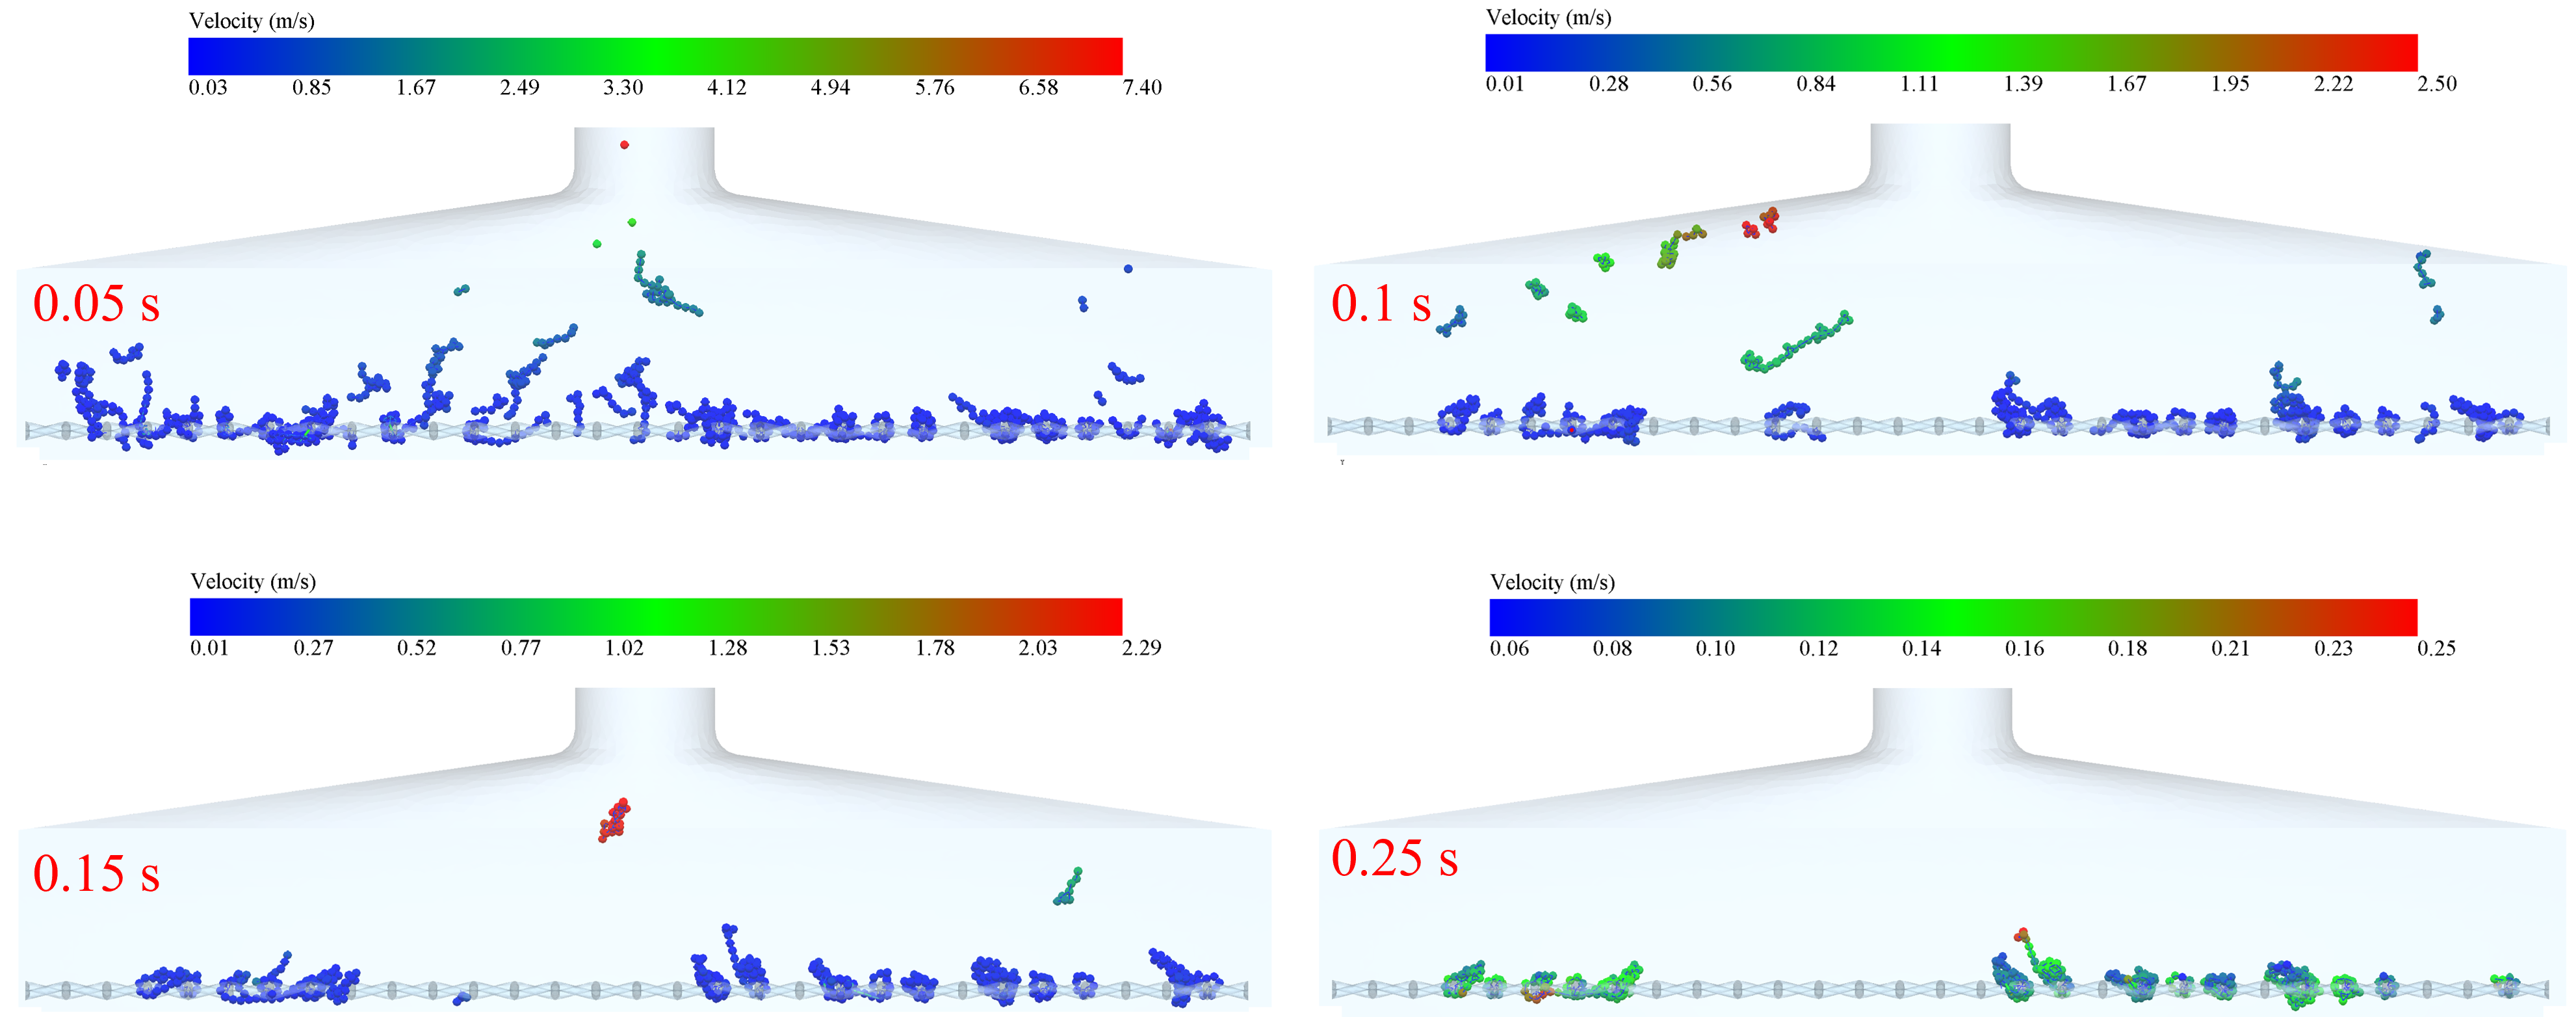
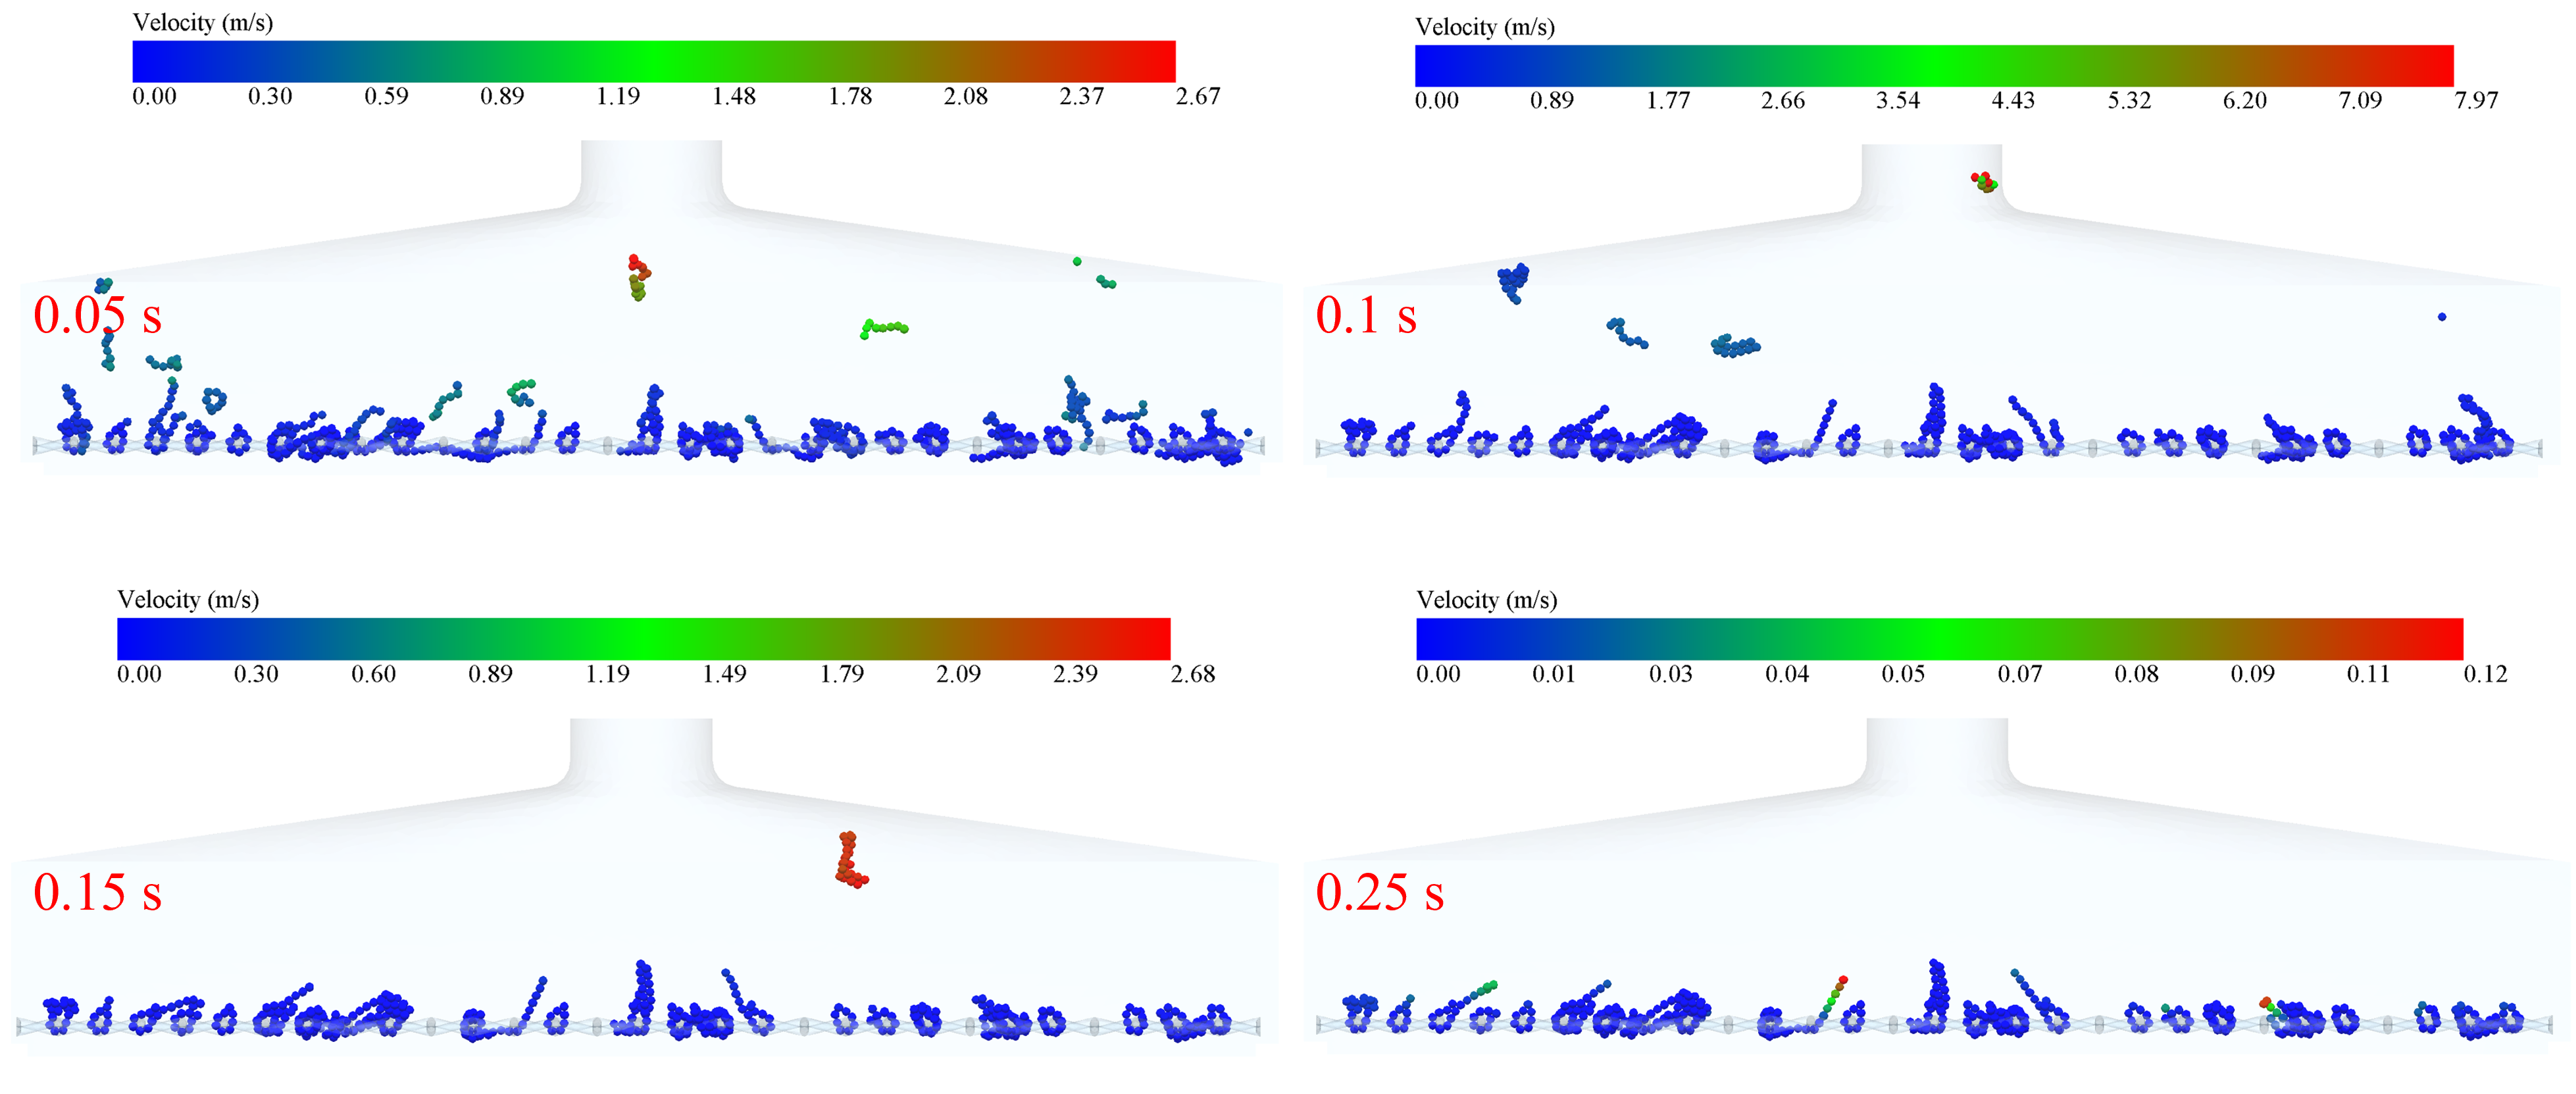
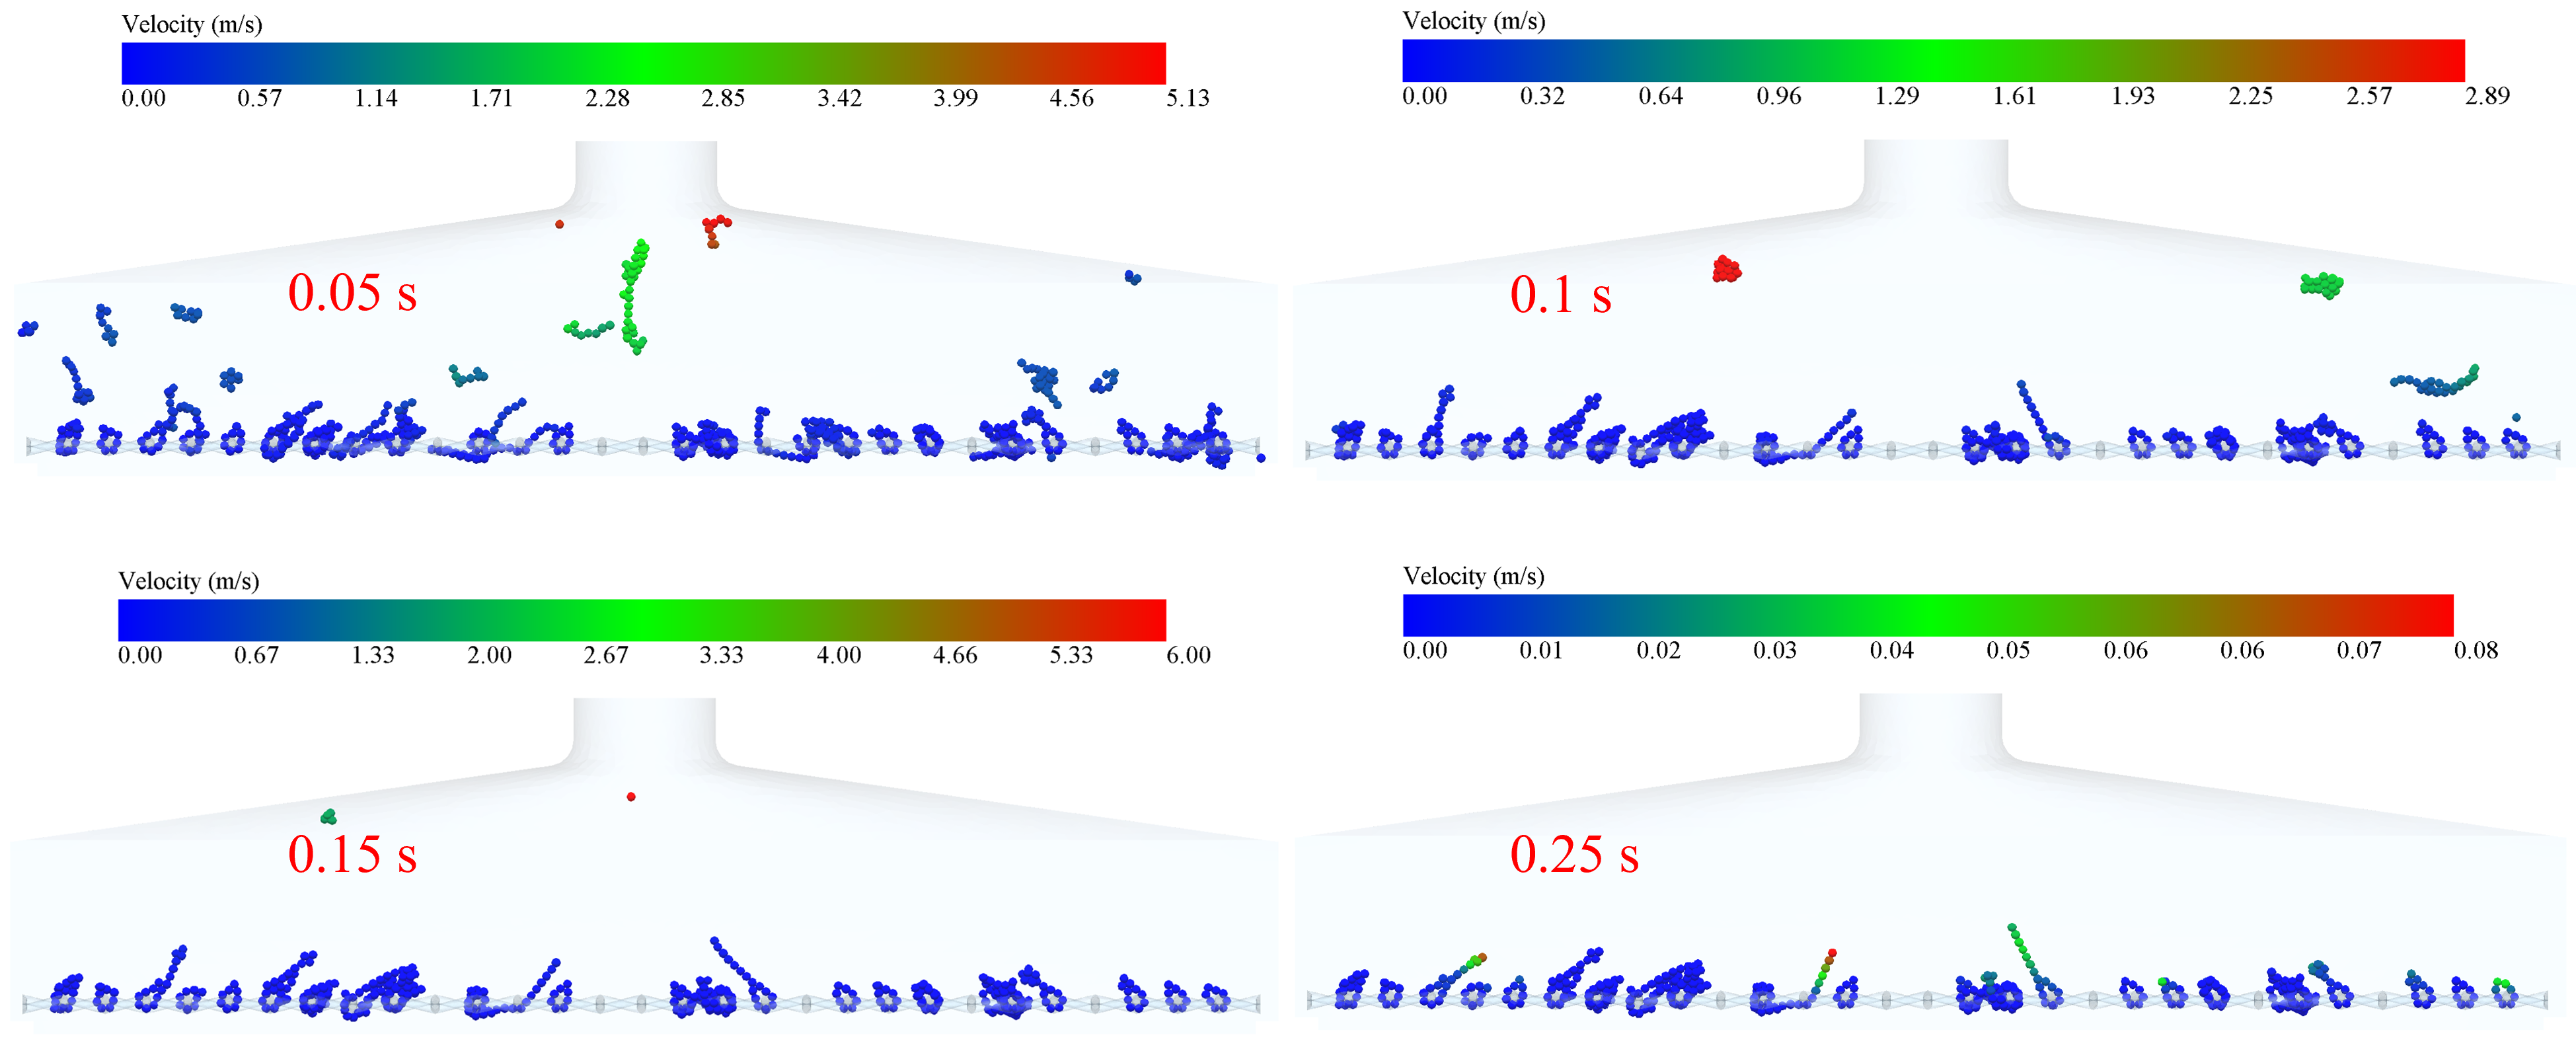
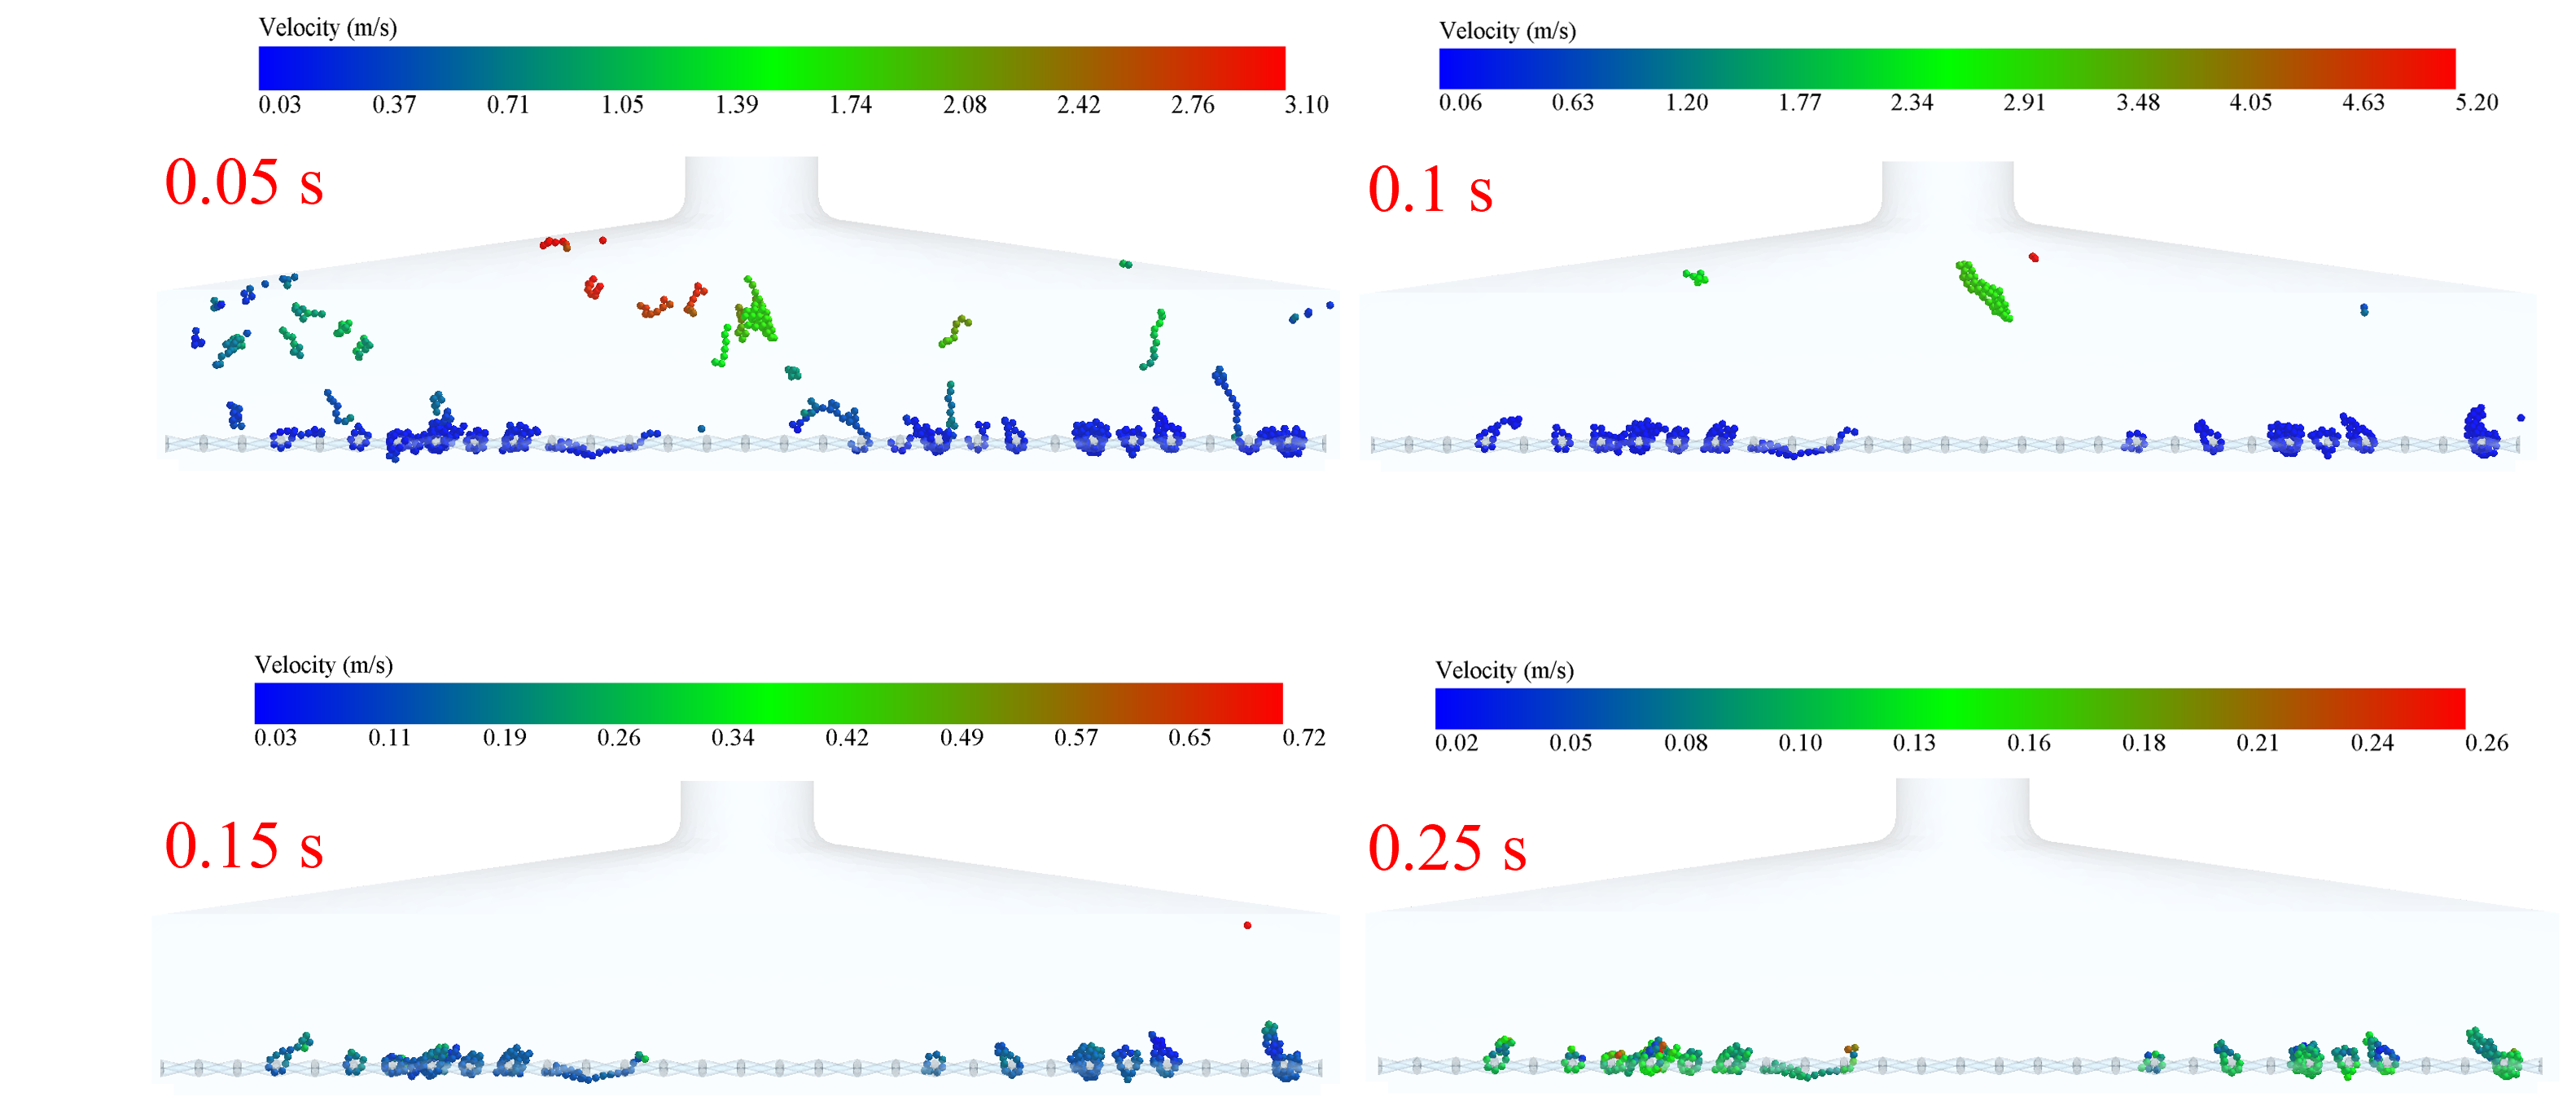
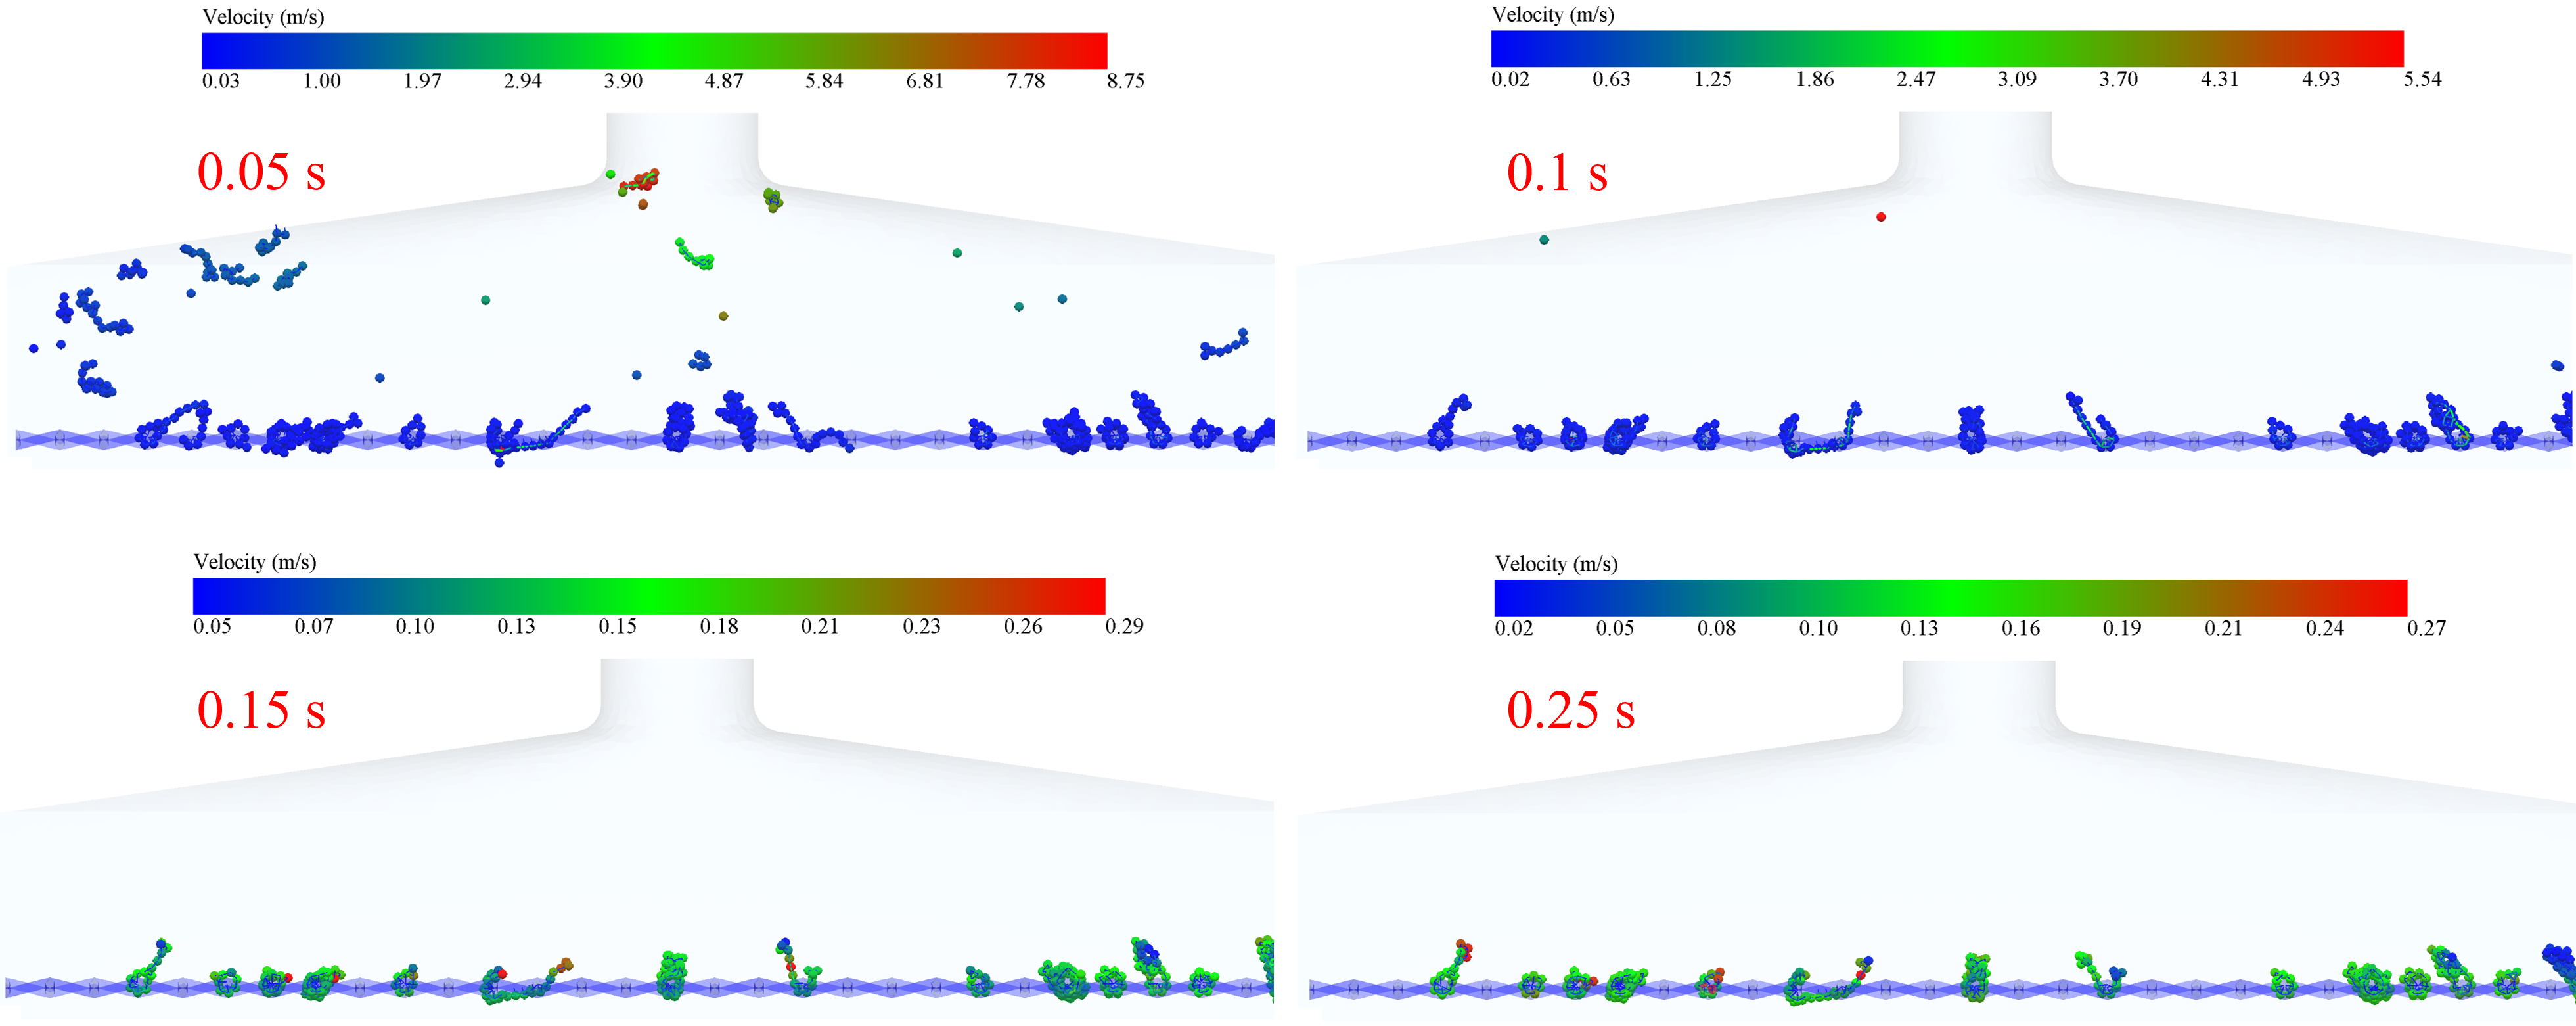
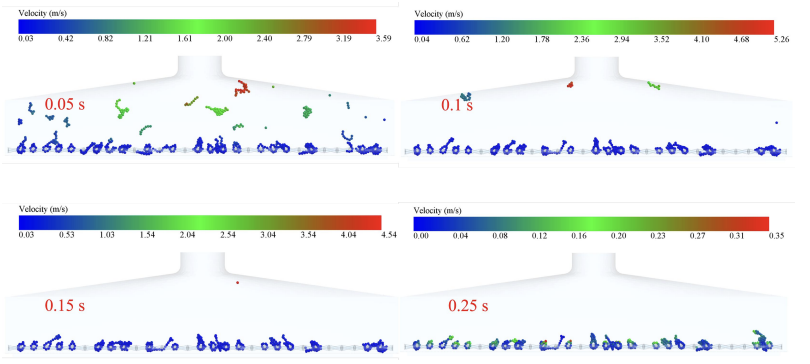
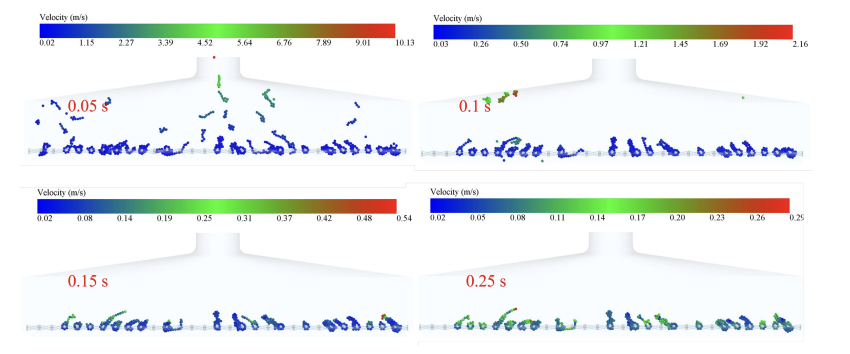
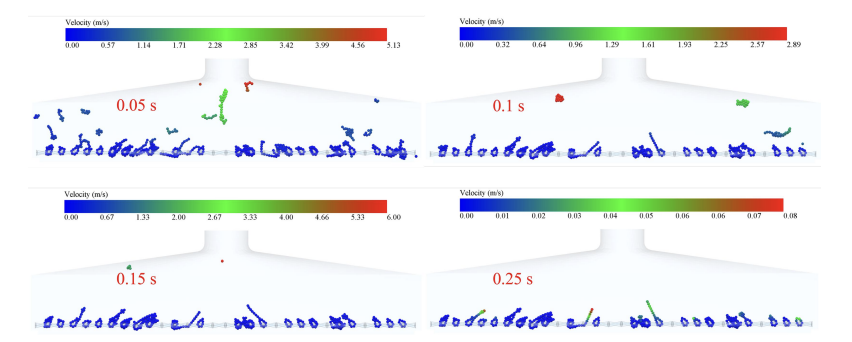
Fig. 7, Fig. 8, Fig. 9, Fig. 10 and Fig. 11 show the velocity trajectories of smoke particles under different inlet velocities, respectively. From the multiple data clouds, it can be seen that as the inlet velocity is increased from 12 m/s to 20 m/s, the motion of smoke particles shows obvious dynamic evolution characteristics: at the moment of 0.05 s, the velocity distribution of particles under the 12 m/s condition is more dispersed (0.03-7.40 m/s), and the velocity under the At 0.05 s, the velocity distribution of particles in the 12 m/s condition was more dispersed (0.03-7.40 m/s), while that in the 20 m/s condition was significantly higher (0.03-8.75 m/s), and the proportion of high-speed particles increased; with the passage of time up to 0.15 s, the velocities of all the conditions were attenuated, with the velocity of 12 m/s falling to the range of 0.01-0.25 m/s, which showed an obvious settling characteristic, while the 20 m/s condition still maintained the relatively high speed of 0.05-0.29 m/s. . Due to the mechanical hooking effect between the tobacco and the sieve mesh and the adsorption effect of the low-pressure reflux zone formed at the edge of the sieve holes on the elongated tobacco, some tobacco particles always existed in the inlet velocity range of 12-20 m/s, and their velocity values were consistently lower than 0.3 m/s hanging on the sieve mesh without being blown away.
|
|
|
|
|
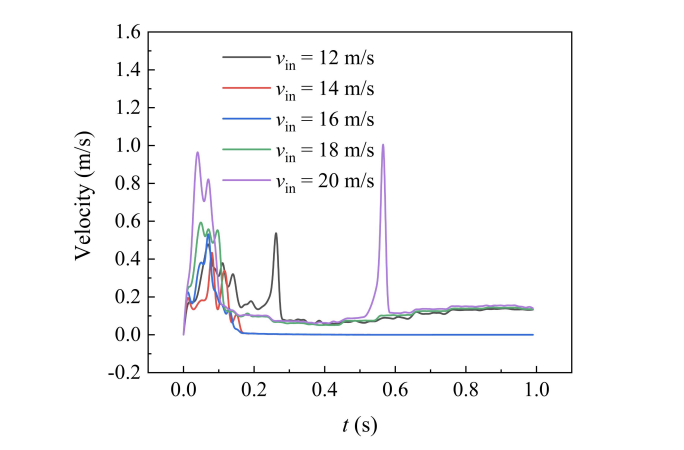
In order to study the motion of tobacco particles in the flow field more clearly, the average velocity distribution of flexible tobacco particles in the flow field under different inlet velocities was made, as shown in Fig. 12. It can be seen that the average velocity of flexible tobacco particles shows a nonlinear growth characteristic with the increase of inlet velocity: when the inlet velocity is increased from 12 m/s to 18 m/s, there is no obvious change in the peak average velocity of the particles. When the inlet velocity continued to increase to 20 m/s, the peak average velocity of the particles was larger. It is worth noting that during the time period of 0.2 s-0.6 s, some of the tobacco filaments were broken due to the continuous effect of the trailing force received from the airflow, which led to a surge in the velocity of individual particles, and thus there were large velocity fluctuations. After 0.6 s, the velocities of the tobacco particles in all conditions leveled off, which corresponded to the critical clogging state of the sieve, when the dynamic equilibrium allowed some particles to be neither blown away nor clogged the sieve holes.
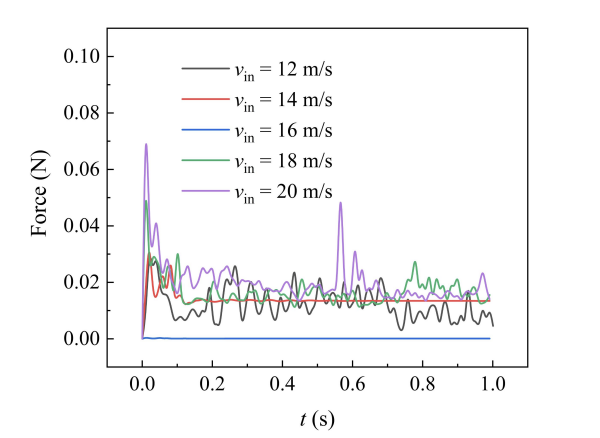
The bonding force between particles at different inlet velocities is shown in Fig. 13. It can be seen that the bonding force between particles shows a non-monotonous trend of decreasing and then increasing with the change of inlet velocities: in the low-velocity zone of 12 m/s-14 m/s, the accumulation of particles leads to frequent collisions, and the force is maintained at a high level of 0.06 N-0.08 N. When the velocity rises to 16 m/s, the force decreases to a stable range of 0.02 N-0.04 N. At this time, both direct collision and gas-solid coupling transfer are avoided and maintained. When the velocity increases to 16 m/s, the force decreases to 0.02 N-0.04 N, which avoids direct collision and maintains the gas-solid coupling transfer; when the velocity continues to increase to 18 m/s -20 m/s, the turbulence intensity increases so that the force rises again to 0.04 N-0.06 N, and obvious fluctuation occurs, which is analyzed to be that the particles group is ripped into unstable clusters at high speeds, which leads to the concentration of the local stresses. It is particularly noteworthy that the standard deviation of the force curve for the 16 m/s condition is only 1/3 of the other conditions, and a unique dynamic equilibrium is formed for gas-solid coupling at this speed.
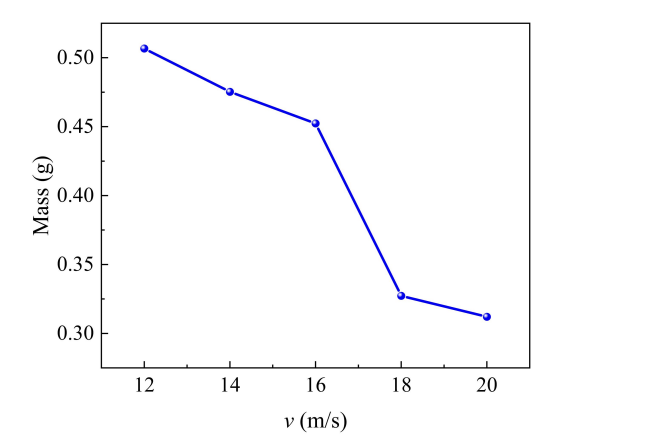
The mass of tobacco remaining on the screen at the moment of 1 s for different inlet flow rates is shown in Fig. 14. As can be seen, it can be observed from the figure that the suspended tobacco mass shows a monotonically decreasing trend with the increase of inlet velocity. When the inlet velocity was gradually increased from 12 m/s to 20 m/s, the mass of tobacco remaining on the screen decreased continuously from 0.51 g to 0.30 g. This pattern indicates that the increase of the airflow velocity effectively enhanced the cleaning capacity. At the low speed of 12 m/s, the insufficient traction of the airflow resulted in most of the tobacco being retained on the screen due to fiber entanglement and adsorption. When the speed was increased to the 16-20 m/s range, the enhanced hydrodynamic forces were more effective in overcoming the mechanical locking and surface adsorption forces between particles and screens, resulting in a 33% reduction in residual mass. It is worth noting that although the mass reduction was only 0.02 g when the velocity was increased from 18 m/s to 20 m/s, compared to the significant improvement in the low velocity zone, it indicates that the improvement in the cleaning efficiency leveled off in the high velocity zone, which may be limited by the ultimate passing capacity of the screen structure.
4.2. Vibration frequency
The vibration frequency of the screen is crucial for the separation of tobacco particles, and too low a frequency is not enough to effectively separate different sizes of tobacco particles, while too high a frequency may lead to excessive shaking of the tobacco particles, increase friction, or even damage the screen, which affects the separation efficiency and the life of the equipment. In this section, we investigated the effect of different screen vibration frequencies on the separation of tobacco particles, and analyzed and compared the dynamic behaviors of tobacco in the flow field under the vibration frequencies of 30 Hz, 40 Hz, 50 Hz, 60 Hz, and 70 Hz, respectively.
Fig. 15 shows the velocity cloud of the flow field in the cross-section of the tobacco cleaner under the vibration frequency, and it can be seen that under different vibration frequency conditions, the velocity distribution of the flow field does not show significant differences, and the overall velocity range is maintained in the range of 0-200 m/s, and the distribution of high-speed and low-speed zones is basically the same in each frequency condition. This indicates that in this vibration frequency range, the screen vibration has less influence on the overall flow field structure, and the flow field characteristics are mainly dominated by the inlet air velocity. There is no obvious velocity gradient change or vortex structure change in the cloud diagram.
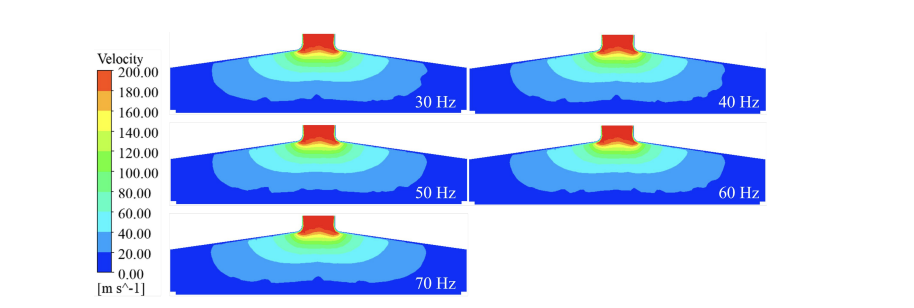
Fig. 16 shows the velocity distribution of the flow field along the x-direction near the screen mesh under different vibration frequencies. From the velocity distribution curve, it can be seen that when the vibration frequency of the screen mesh is changed in the range of 30 Hz-70 Hz, the velocity distribution near the screen mesh does not show regular differences, and the velocity curves basically overlap under the various frequency conditions, with fluctuation amplitudes kept within ±5 m/s. This indicates that the disturbance of the flow field near the wall by mechanical vibration has been replaced by turbulent pulsation in this vibration frequency interval. This indicates that in this vibration frequency range, the disturbance of the flow field near the screen mesh by mechanical vibration has been covered by turbulent pulsation, and the vibration energy is not effectively coupled to the fluid phase. It is noteworthy that even at the high frequency of 70 Hz, the curves do not show the expected high-frequency oscillation characteristics, indicating that the screen vibration mainly affects the motion state of the solid-phase particles, while the effect on the macrostructure of the gas-phase flow field is negligible.
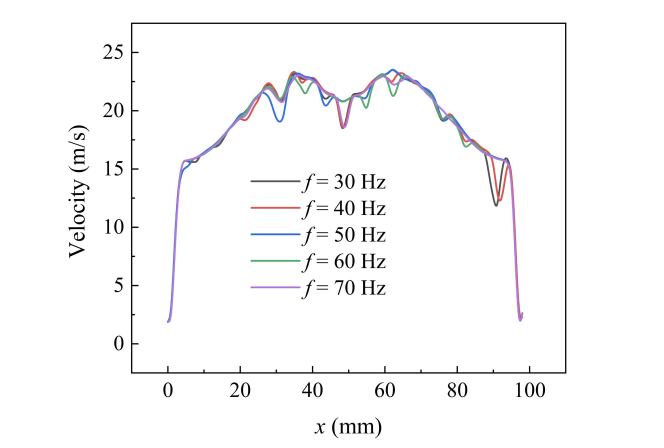
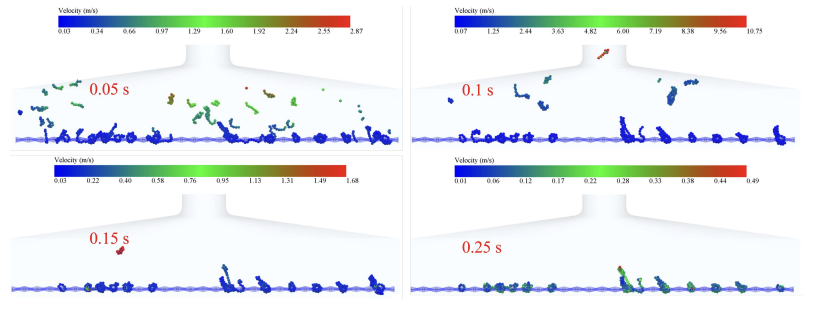
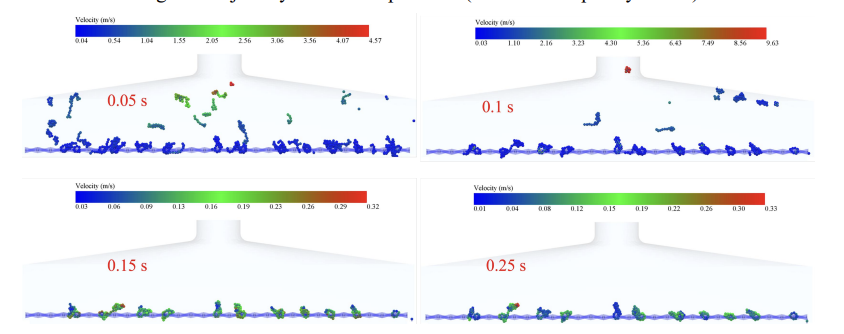
Fig. 17, Fig. 18, Fig. 19, Fig. 20 and Fig. 21 show the velocity trajectory diagrams of tobacco particles under different vibration frequencies, respectively. It can be seen from the multiple sets of trajectory diagrams that, under the low-frequency working condition of 30 Hz-50 Hz, there are still a large number of low-velocity particles piled up at the moment of 0.25 s, and there exists a significant mass residual; and when the frequency is increased to 60 Hz-70 Hz, the velocity of the particles at the same node of time generally improves to the 0.12-0.54 m/s range, and the retention phenomenon is significantly improved. This change is mainly due to three kinetic mechanisms: firstly, the mechanical wave generated by high-frequency vibration can effectively penetrate the tobacco; secondly, the acceleration of the screen mesh under the working condition of 70 Hz is as high as 30 Hz, which is more effective in overcoming the adsorption of van der Waals force; finally, the high-frequency vibration prompts the particles to produce the effect of “micro-fluidization”, which increases the proportion of high-speed particles in the time of 0.05 s from 12% to 41%. Especially in the 50 Hz-60 Hz interval, the coefficient of variation of the particle velocity distribution drops by 35%, indicating that there is an optimal energy coupling state in this frequency band, which is in line with the best performance of 55 Hz scavenging equipment in industrial practice.
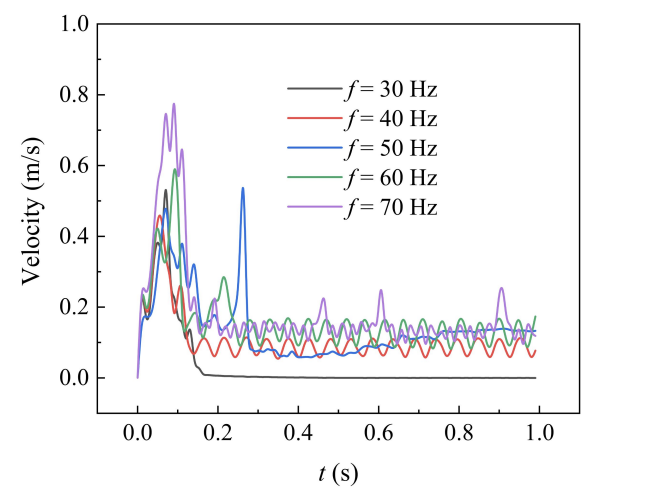
The average velocity distribution of flexible tobacco particles in the flow field at different vibration frequencies is shown in Fig. 22. From the velocity distribution curves, it can be seen that the average velocity of the tobacco particles shows a systematic increase as the vibration frequency increases from 30 Hz to 70 Hz: at the moment of 0.2 s, the average velocity of the 30 Hz case is 0.04 m/s, while that of the 70 Hz case reaches 0.2 m/s. This accelerating effect is most significant after 0.4 s. The average velocity of the flexible tobacco particles in the flow field at all frequencies tends to stabilize after 0.3 s, but that of the high-frequency case is 0.3 m/s. It is noteworthy that the velocities of all frequency cases stabilize after 0.3 s, but the residual velocities of the high-frequency case are still 50-60% higher than those of the low-frequency case, indicating that the high-frequency vibration can maintain the kinetic energy of the particles more effectively. Especially at 50 Hz, the velocity profile shows a relatively smooth rise, and this frequency may be close to the optimal energy transfer efficiency point of the system.
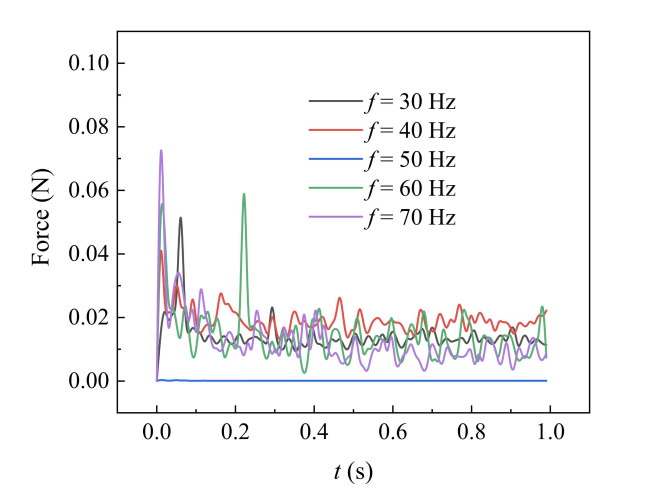
The bonding force between particles at different vibration frequencies is shown in Fig. 23. From the analysis of the force curves, it can be seen that the highest bonding force peaks at 70 Hz and 60 Hz reach 0.075 N and 0.058 N, respectively, which is significantly higher than that of other frequency conditions. The force characteristics of these two high-frequency conditions show a typical three-stage evolution: the early stage is caused by the violent vibration, which leads to a sudden increase in the collision frequency of the particles, and forms the early extreme value of the force. In the middle stage, the particle population enters into a chaotic state, and the 60 Hz condition produces a second force extreme value. The high-frequency conditions all show force oscillations, reflecting the instability of the particle clearing. It is worth noting that the force curve of the 50 Hz condition is the smoothest and remains at the lowest level in the whole time , which is analyzed to be a precise resonance with the characteristic frequency of the tobacco particles, so that the vibration energy is uniformly dissipated in the form of standing waves. The wavelength of the 50 Hz vibration is similar to the average length of tobacco, which encourages the particles to move with the optimal orientation in the axial direction.
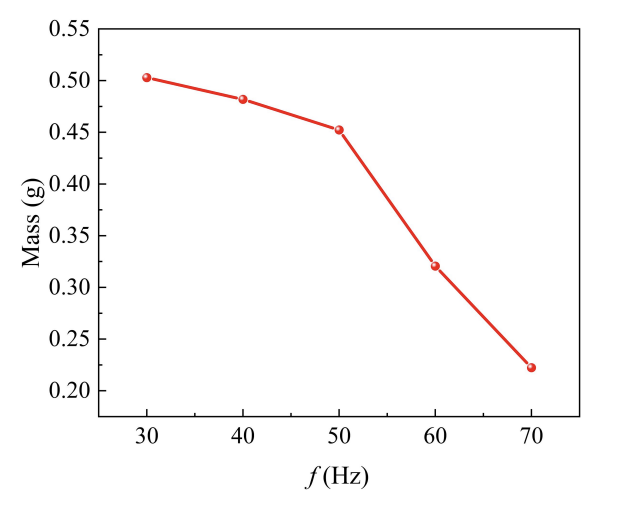
At different vibration frequencies, the residual mass of tobacco on the sieve mesh at the moment of 1 s is shown in Fig. 24. From the data in the figure, it can be seen that the residual mass of tobacco on the screen mesh shows a decreasing rate with the increase of vibration frequency: when the frequency is gradually increased from 30 Hz to 70 Hz, the residual mass decreases from 0.50 g to 0.2 g, with a decreasing rate of 60%. High-frequency vibration can enhance the acceleration of sieve movement, which can effectively destroy the mechanical occlusion of tobacco fiber and sieve holes. Secondly, high-frequency vibration significantly reduces the probability of agglomeration between particles.
5. Conclusion
This study employs the CFD-DEM coupling method to systematically investigate the motion characteristics and cleaning mechanisms of flexible tobacco particles during vibration screening. By establishing a flexible tobacco particle model, we analyzed the dynamic behavior of particles in the flow field and examined how different operational parameters affect cleaning efficiency. Key findings include: The JKR contact model (surface energy 5 J/m²) successfully characterized the viscoelastic behavior of tobacco particles, accurately predicted dynamic contact processes between particles and screens, revealed retention particle motion characteristics under low-speed conditions, and explained particle clustering phenomena caused by turbulence in high-speed operations. CFD-DEM simulations demonstrated that an inlet velocity of 16 m/s creates an optimal flow field structure with balanced axial and radial velocity gradients, effectively balancing particle transport and protection. Under this condition, the flow field exhibits stable transitional flow patterns with minimized inter-particle adhesion forces. When the screen operates at 50 Hz, resonance occurs with the natural frequency of tobacco particles, achieving the most uniform particle velocity distribution. Gas-solid coupling analysis revealed that vibration energy primarily influences solid-phase particle motion with limited impact on macroscopic gas-phase flow structures. While high-frequency vibrations enhance cleaning efficiency, they increase particle force fluctuations and secondary agglomeration risks.
This research supports the development of self-cleaning systems for tobacco particle vibration screening screens at Baoding Cigarette Factory, Hebei Baisha Tobacco Co., Ltd. (Project ID: HBZY-BY2024A004).
References
[1]. Discrete element method-computational fluid dynamics analyses of flexible fibre fluidization - ADS, (n.d.). https: //ui.adsabs.harvard.edu/abs/2021JFM...910A...8J/abstract (accessed June 27, 2025).
[2]. Y. Tsuji, T. Kawaguchi, T. Tanaka, Discrete particle simulation of two-dimensional fluidized bed,Powder Technology77 (1993) 79–87. https: //doi.org/10.1016/0032-5910(93)85010-7.
[3]. P.W. Cleary, DEM simulation of industrial particle flows: case studies of dragline excavators, mixing in tumblers and centrifugal mills,Powder Technology109 (2000) 83–104. https: //doi.org/10.1016/S0032-5910(99)00229-6.
[4]. Y.C. Zhou, B.D. Wright, R.Y. Yang, B.H. Xu, A.B. Yu, Rolling friction in the dynamic simulation of sandpile formation,Physica A: Statistical Mechanics and Its Applications269 (1999) 536–553. https: //doi.org/10.1016/S0378-4371(99)00183-1.
[5]. J.E. Hilton, P.W. Cleary, The influence of particle shape on flow modes in pneumatic conveying,Chemical Engineering Science66 (2011) 231–240. https: //doi.org/10.1016/j.ces.2010.09.034.
[6]. K.W. Chu, B. Wang, A.B. Yu, A. Vince, G.D. Barnett, P.J. Barnett, CFD–DEM study of the effect of particle density distribution on the multiphase flow and performance of dense medium cyclone,Minerals Engineering22 (2009) 893–909. https: //doi.org/10.1016/j.mineng.2009.04.008.
[7]. J. Han, K. Shen, Y. Guo, H. Xiong, J. Lin, Discrete element simulations of flexible ribbon-like particles,Powder Technology429 (2023) 118950. https: //doi.org/10.1016/j.powtec.2023.118950.
[8]. Irazábal, J., Salazar, F. & Vicente, D.J. A methodology for calibrating parameters in discrete element models based on machine learning surrogates.Comp. Part. Mech.10, 1031–1047 (2023). https: //doi.org/10.1007/s40571-022-00550-1
[9]. W. Nan, Y. Wang, H. Tang, A viscoelastic model for flexible fibers with material damping,Powder Technology276 (2015) 175–182. https: //doi.org/10.1016/j.powtec.2015.02.037.
[10]. A bonded sphero-cylinder model for the discrete element simulation of elasto-plastic fibers - ScienceDirect, (n.d.). https: //www.sciencedirect.com/science/article/pii/S0009250917305833 (accessed June 27, 2025).
[11]. Three-dimensional simulation of gas-solid flow in a fluidised bed with flexible ribbon particles - ScienceDirect, (n.d.). https: //www.sciencedirect.com/science/article/pii/S0301932219304240 (accessed June 27, 2025).
[12]. J. Han, K. Shen, Y. Guo, H. Xiong, J. Lin, Discrete element simulations of flexible ribbon-like particles,Powder Technology429 (2023) 118950. https: //doi.org/10.1016/j.powtec.2023.118950.
[13]. H. Zhao, C. Gu, B. Xu, Y. Liu, M. Du, K. Deng, J. Zhu, I. Voronina, Z. Yuan, Numerical analysis on the transport properties and residence time distribution of ribbon biomass particles in a riser reactor based on CFD-DEM approach,Particuology87 (2024) 133–146. https: //doi.org/10.1016/j.partic.2023.08.004.
[14]. Y. Kosaku, Y. Tsunazawa, C. Tokoro, A coarse grain model with parameter scaling of adhesion forces from liquid bridge forces and JKR theory in the discrete element method,Chemical Engineering Science268 (2023) 118428. https: //doi.org/10.1016/j.ces.2022.118428.
[15]. H. Xu, M. Luo, Y. Chen, X. Fu, Y. Dong, D. Liu, Optimized design and test based on Fluent cyclone dust removal device,Flow Measurement and Instrumentation106 (2025) 102953. https: //doi.org/10.1016/j.flowmeasinst.2025.102953.
[16]. Y. Liu, C. Xin, J. Tang, S. Xu, Y. Yin, CFD-DEM simulation and experimental validation of air classification for tobacco particles,Powder Technology448 (2024) 120318. https: //doi.org/10.1016/j.powtec.2024.120318.
[17]. S. Wang, Y. Shen, CFD-DEM study of biomass gasification in a fluidized bed reactor: Effects of key operating parameters,Renewable Energy159 (2020) 1146–1164. https: //doi.org/10.1016/j.renene.2020.06.001.
[18]. H.P. Zhu, Z.Y. Zhou, R.Y. Yang, A.B. Yu, Discrete particle simulation of particulate systems: Theoretical developments,Chemical Engineering Science62 (2007) 3378–3396. https: //doi.org/10.1016/j.ces.2006.12.089.
[19]. Macro-scale pseudo-particle modeling for particle-fluid systems | Science Bulletin, (n.d.). https: //link.springer.com/article/10.1007/BF02900568 (accessed June 27, 2025).
[20]. B.N. Murthy, J.B. Joshi, Assessment of standard k–ε, RSM and LES turbulence models in a baffled stirred vessel agitated by various impeller designs,Chemical Engineering Science, Volume 63, Issue 22, 2008, 5468-5495, https: //doi.org/10.1016/j.ces.2008.06.019.
[21]. P. Chen, Y. Han, F. Jia, D. Zhao, X. Meng, A. Li, Y. Chu, H. Zhao, Investigation of the mechanism of aerodynamic separation of rice husks from brown rice following paddy hulling by coupled CFD-DEM,Biosystems Engineering218 (2022) 200–215. https: //doi.org/10.1016/j.biosystemseng.2022.03.015.
[22]. Comparative numerical study of pneumatic conveying of flexible elongated particles through a pipe bend by DEM-CFD - ScienceDirect, (n.d.). https: //www.sciencedirect.com/science/article/pii/S003259102200064X (accessed June 27, 2025).
[23]. C. Zhou, H. Chen, J. Su, Y. Chen, Orientation simulation and image experiment for flexible biomass particle in wedge fluidization channel,Journal of Food Engineering333 (2022) 111150. https: //doi.org/10.1016/j.jfoodeng.2022.111150.
Cite this article
Yang,X.;Wei,X.;Li,Z.;Wu,Z.;Lu,S. (2025). Numerical simulation of dynamic behavior for flexible tobacco particles during vibratory scavenging process. Advances in Engineering Innovation,16(11),15-30.
Data availability
The datasets used and/or analyzed during the current study will be available from the authors upon reasonable request.
Disclaimer/Publisher's Note
The statements, opinions and data contained in all publications are solely those of the individual author(s) and contributor(s) and not of EWA Publishing and/or the editor(s). EWA Publishing and/or the editor(s) disclaim responsibility for any injury to people or property resulting from any ideas, methods, instructions or products referred to in the content.
About volume
Journal:Advances in Engineering Innovation
© 2024 by the author(s). Licensee EWA Publishing, Oxford, UK. This article is an open access article distributed under the terms and
conditions of the Creative Commons Attribution (CC BY) license. Authors who
publish this series agree to the following terms:
1. Authors retain copyright and grant the series right of first publication with the work simultaneously licensed under a Creative Commons
Attribution License that allows others to share the work with an acknowledgment of the work's authorship and initial publication in this
series.
2. Authors are able to enter into separate, additional contractual arrangements for the non-exclusive distribution of the series's published
version of the work (e.g., post it to an institutional repository or publish it in a book), with an acknowledgment of its initial
publication in this series.
3. Authors are permitted and encouraged to post their work online (e.g., in institutional repositories or on their website) prior to and
during the submission process, as it can lead to productive exchanges, as well as earlier and greater citation of published work (See
Open access policy for details).
References
[1]. Discrete element method-computational fluid dynamics analyses of flexible fibre fluidization - ADS, (n.d.). https: //ui.adsabs.harvard.edu/abs/2021JFM...910A...8J/abstract (accessed June 27, 2025).
[2]. Y. Tsuji, T. Kawaguchi, T. Tanaka, Discrete particle simulation of two-dimensional fluidized bed,Powder Technology77 (1993) 79–87. https: //doi.org/10.1016/0032-5910(93)85010-7.
[3]. P.W. Cleary, DEM simulation of industrial particle flows: case studies of dragline excavators, mixing in tumblers and centrifugal mills,Powder Technology109 (2000) 83–104. https: //doi.org/10.1016/S0032-5910(99)00229-6.
[4]. Y.C. Zhou, B.D. Wright, R.Y. Yang, B.H. Xu, A.B. Yu, Rolling friction in the dynamic simulation of sandpile formation,Physica A: Statistical Mechanics and Its Applications269 (1999) 536–553. https: //doi.org/10.1016/S0378-4371(99)00183-1.
[5]. J.E. Hilton, P.W. Cleary, The influence of particle shape on flow modes in pneumatic conveying,Chemical Engineering Science66 (2011) 231–240. https: //doi.org/10.1016/j.ces.2010.09.034.
[6]. K.W. Chu, B. Wang, A.B. Yu, A. Vince, G.D. Barnett, P.J. Barnett, CFD–DEM study of the effect of particle density distribution on the multiphase flow and performance of dense medium cyclone,Minerals Engineering22 (2009) 893–909. https: //doi.org/10.1016/j.mineng.2009.04.008.
[7]. J. Han, K. Shen, Y. Guo, H. Xiong, J. Lin, Discrete element simulations of flexible ribbon-like particles,Powder Technology429 (2023) 118950. https: //doi.org/10.1016/j.powtec.2023.118950.
[8]. Irazábal, J., Salazar, F. & Vicente, D.J. A methodology for calibrating parameters in discrete element models based on machine learning surrogates.Comp. Part. Mech.10, 1031–1047 (2023). https: //doi.org/10.1007/s40571-022-00550-1
[9]. W. Nan, Y. Wang, H. Tang, A viscoelastic model for flexible fibers with material damping,Powder Technology276 (2015) 175–182. https: //doi.org/10.1016/j.powtec.2015.02.037.
[10]. A bonded sphero-cylinder model for the discrete element simulation of elasto-plastic fibers - ScienceDirect, (n.d.). https: //www.sciencedirect.com/science/article/pii/S0009250917305833 (accessed June 27, 2025).
[11]. Three-dimensional simulation of gas-solid flow in a fluidised bed with flexible ribbon particles - ScienceDirect, (n.d.). https: //www.sciencedirect.com/science/article/pii/S0301932219304240 (accessed June 27, 2025).
[12]. J. Han, K. Shen, Y. Guo, H. Xiong, J. Lin, Discrete element simulations of flexible ribbon-like particles,Powder Technology429 (2023) 118950. https: //doi.org/10.1016/j.powtec.2023.118950.
[13]. H. Zhao, C. Gu, B. Xu, Y. Liu, M. Du, K. Deng, J. Zhu, I. Voronina, Z. Yuan, Numerical analysis on the transport properties and residence time distribution of ribbon biomass particles in a riser reactor based on CFD-DEM approach,Particuology87 (2024) 133–146. https: //doi.org/10.1016/j.partic.2023.08.004.
[14]. Y. Kosaku, Y. Tsunazawa, C. Tokoro, A coarse grain model with parameter scaling of adhesion forces from liquid bridge forces and JKR theory in the discrete element method,Chemical Engineering Science268 (2023) 118428. https: //doi.org/10.1016/j.ces.2022.118428.
[15]. H. Xu, M. Luo, Y. Chen, X. Fu, Y. Dong, D. Liu, Optimized design and test based on Fluent cyclone dust removal device,Flow Measurement and Instrumentation106 (2025) 102953. https: //doi.org/10.1016/j.flowmeasinst.2025.102953.
[16]. Y. Liu, C. Xin, J. Tang, S. Xu, Y. Yin, CFD-DEM simulation and experimental validation of air classification for tobacco particles,Powder Technology448 (2024) 120318. https: //doi.org/10.1016/j.powtec.2024.120318.
[17]. S. Wang, Y. Shen, CFD-DEM study of biomass gasification in a fluidized bed reactor: Effects of key operating parameters,Renewable Energy159 (2020) 1146–1164. https: //doi.org/10.1016/j.renene.2020.06.001.
[18]. H.P. Zhu, Z.Y. Zhou, R.Y. Yang, A.B. Yu, Discrete particle simulation of particulate systems: Theoretical developments,Chemical Engineering Science62 (2007) 3378–3396. https: //doi.org/10.1016/j.ces.2006.12.089.
[19]. Macro-scale pseudo-particle modeling for particle-fluid systems | Science Bulletin, (n.d.). https: //link.springer.com/article/10.1007/BF02900568 (accessed June 27, 2025).
[20]. B.N. Murthy, J.B. Joshi, Assessment of standard k–ε, RSM and LES turbulence models in a baffled stirred vessel agitated by various impeller designs,Chemical Engineering Science, Volume 63, Issue 22, 2008, 5468-5495, https: //doi.org/10.1016/j.ces.2008.06.019.
[21]. P. Chen, Y. Han, F. Jia, D. Zhao, X. Meng, A. Li, Y. Chu, H. Zhao, Investigation of the mechanism of aerodynamic separation of rice husks from brown rice following paddy hulling by coupled CFD-DEM,Biosystems Engineering218 (2022) 200–215. https: //doi.org/10.1016/j.biosystemseng.2022.03.015.
[22]. Comparative numerical study of pneumatic conveying of flexible elongated particles through a pipe bend by DEM-CFD - ScienceDirect, (n.d.). https: //www.sciencedirect.com/science/article/pii/S003259102200064X (accessed June 27, 2025).
[23]. C. Zhou, H. Chen, J. Su, Y. Chen, Orientation simulation and image experiment for flexible biomass particle in wedge fluidization channel,Journal of Food Engineering333 (2022) 111150. https: //doi.org/10.1016/j.jfoodeng.2022.111150.