


1. Introduction
1.1. Research Background and Significance
In the context of an evolving economy, understanding the dynamics of consumer spending is crucial for assessing economic health and guiding policy-making. [1] Consumption expenditures, particularly on essential items like FAT, and ARE, are significant indicators of consumer behavior and economic well-being. [11] This study seeks to provide a nuanced analysis of how different income sources contribute to these expenditures, offering insights into the complex interplay between income and consumption.
1.2. Research Objectives
The primary objective of this research is to quantify the impact of various income sources—IFS, NIB, NIP, and NIT — on consumption expenditures in the categories of FAT, and ARE. By employing regression analysis, we aim to identify which income sources have the most significant influence on consumer spending and whether these relationships hold across different expenditure categories.
1.3. Structure of the Paper
The paper is organized as follows: Following this introduction, Section 2 provides a comprehensive literature review, discussing the theoretical underpinnings of consumer behavior and prior research on income and expenditure relationships. Section 3 details the methodology, including data sources, variable definitions, and the regression model specifications. Section 4 presents the results of the regression analysis, highlighting key findings and their implications. Section 5 discusses the findings in the context of existing literature and their implications for policy and business strategies. Finally, Section 6 concludes the paper with a summary of findings and suggestions for future research.
2. Literature Review
2.1. Theoretical Framework of Consumption Behavior
The theoretical foundation of consumption behavior is rooted in various economic theories, including Keynesian consumption function, the life-cycle hypothesis, and the permanent income hypothesis. These theories posit that consumption is influenced by current income, expected future income, and wealth accumulation. Additionally, behavioral economics has introduced the concept of prospect theory and mental accounting, which provide insights into the psychological aspects of consumer decision-making. [5]
2.2. Impact of Income on Expenditure
Empirical studies have consistently shown a positive relationship between income and expenditure, as captured by the marginal propensity to consume (MPC). [12] However, the relationship is not uniform across different income sources and expenditure categories. Research has indicated that IFS may have a different MPC compared to income from investments or transfers, which has implications for targeted fiscal policies and economic stimulus. [7]
2.3. Studies on Foods, Alcohol, Tobacco, and Apparel Expenditures
Consumption of FATE, and ARE is considered both essential and discretionary, with varying degrees of income elasticity. Studies have examined the expenditure patterns across different socioeconomic groups and found that while FATE tend to be more inelastic, ARE is more elastic and responsive to NIT. [2] Additionally, cultural factors, social norms, and marketing strategies also play a significant role in shaping consumption patterns in these categories. [4]
2.4. Research Gaps
Despite the extensive research on consumption behavior and the impact of income on expenditure, there are notable gaps in the literature. A review of studies using keywords such as "income sources," "consumption patterns," and "economic stimulus" reveals a limited focus on the disaggregated effects of different income streams on specific expenditure categories like FATE, and ARE.
Furthermore, much of the existing literature has concentrated on developed economies, with less emphasis on emerging and transitioning economies where consumption dynamics may differ significantly. [13]
Additionally, the integration of recent technological advancements and their influence on consumer behavior, particularly in the context of online shopping and digital marketing, has not been thoroughly explored.
This study addresses these gaps by examining the nuanced relationship between various income sources and specific consumption expenditures within the context of China's economy, offering a more comprehensive understanding of the factors driving consumer spending.
3. Methodology
3.1. Data Sources and Sample Description
The data utilized and Noun interpretation in this study is sourced from the National Bureau of Statistics of China (https://www.stats.gov.cn/), a primary and authoritative institution for statistical data in China. The dataset encompasses a range of income sources and expenditure categories, providing a comprehensive view of consumption patterns. The sample consists of 9 cases from the year 2014 to 2022, which are representative of the population under study and are used to perform the regression analysis.
3.2. Variable Definition and Measurement
The following variables are defined for the analysis, each with a specific measurement:
Year: The dataset includes a record of the year for each observation, which is used to identify the time point of the data collection. While not utilized as an independent variable in the regression analysis, the year may still provide contextual information for the economic conditions during the period of study
IFS: Refers to obtain employment personnel through all kinds of labor remuneration and all sorts of welfare, including employment at unit or individual, engage in all sorts of free occupation, part-time and sporadic labor get all labor remuneration and welfare.
NIB: Refers to the net income obtained by households or household members engaged in production and operation activities, which is the net income obtained after deducting operating expenses, depreciation of productive fixed assets and production tax from all operating income.
NIP: Refers to the net income obtained by a household or a resident member from the return of their financial assets, housing and other non-financial assets and natural resources at the disposal of other institutions, households or individuals and after deducting the related expenses. Net property income includes net interest income, dividend income, net income from savings insurance, net income from transfer of contracted land management rights, net income from rental housing, net income from leasing other assets and net rent of self-owned housing, etc. Net income from property does not include premium income from the transfer of ownership of the assets.
NIT: Refers to the various regular transfer payments of the state, units and social organizations to households and the regular income transfer between households. It includes pension or pension, social relief and subsidies, policy-based production subsidies, policy-based living subsidies, disaster relief funds, regular donations and compensation, reimbursement of medical expenses, support income between households, the income sent back by resident members of the household, etc. Transfer income does not include gifts in kind between households.
FATE: Refers to the expenditure on various food products, tobacco and alcohol products.
ARE: Refers to the expenditure related to residents' clothing, including clothing, clothing materials, shoes, other clothing and accessories, and clothing-related processing services.
3.3. Regression Analysis Approach
The study employs multiple linear regression analysis to explore the impact of various income sources on consumption expenditures. The general form of the regression model is as follows:
Y=β0+β1X1+β2X2+…+βkXk+ϵ
Where:
• Y is the dependent variable, representing either FAT, or AR expenditures.
• X1, X2, …, XkX1, X2, …, Xk are the independent variables, representing different income sources such as salary income, net business income, net property income, and transfer net income.
• β0 is the intercept of the regression line.
• β1, β2, …, βkβ1, β2, …, βk are the coefficients to be estimated, representing the change in the dependent variable for a one-unit change in the independent variables, holding all other variables constant.
• ϵ is the error term, representing the variability in the dependent variable that cannot be explained by the independent variables.
Two separate regression models will be specified for the two dependent variables:
For Food, Alcohol, and Tobacco Expenditure (YFATE):
YFATE=β0+β1W+β2B+β3P+β4T+ϵ
For Apparel Expenditure (YARE):
YARE=β0+β1W+β2B+β3P+β4T+η
Where:
• W IFS.
• B NIB.
• P NIP.
• T NIT.
The regression models will be estimated using the least squares method, which minimizes the sum of the squares of the errors. The significance of the coefficients will be tested using t-tests, and the overall model fit will be assessed using the R-squared and adjusted R-squared statistics.
3.4. Granger Causality Analysis
The analysis was performed at lag orders 1 and 2, which means that the effect of a variable on another is tested for immediate and subsequent time periods (Figure 1).
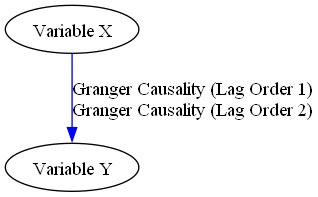
Figure 1. Granger Causality between Variable X and Variable Y at lag orders 1 and 2
4. Results
4.1. Descriptive Statistics of Key Variables
The descriptive statistics for the key variables are presented in Table 1 and Table 2. The mean expenditure on FATE is ¥7401.33, with a standard deviation of ¥1002.288, indicating a moderate level of variation. For ARE, the mean is ¥1743.11 and the standard deviation is ¥76.872, suggesting a relatively consistent level of spending across the sample.
Table 1. Descriptive statistics for FATE, IFS, NIB, NIP, and NIT variables.
Descriptive Statistics | |||
Mean | Std. Deviation | N | |
FATE | 7401.33 | 1002.288 | 9 |
IFS | 23769.67 | 4059.882 | 9 |
NIB | 4394.56 | 812.403 | 9 |
NIP | 4007.56 | 880.385 | 9 |
NIT | 6959.56 | 1426.136 | 9 |
Table 2. Descriptive statistics for ARE, IFS, NIB, NIP, and NIT variables.
Descriptive Statistics | |||
Mean | Std. Deviation | N | |
ARE | 1743.11 | 76.872 | 9 |
IFS | 23769.67 | 4059.882 | 9 |
NIB | 4394.56 | 812.403 | 9 |
NIP | 4007.56 | 880.385 | 9 |
NIT | 6959.56 | 1426.136 | 9 |
4.2. Correlation Analysis Between Income Sources and Expenditures
Correlation analysis was conducted to examine the relationship between income sources and expenditures. As shown in Table 3, there is a strong positive correlation between IFS and FATE (r = .993, p < .001), suggesting that an increase in IFS is closely associated with higher spending in these categories.
Table 3. Correlation between IFS and FATE
Correlations | ||||||
FATE | IFS | NIB | NIP | NIT | ||
Pearson Correlation | FATE | 1.000 | .993 | .991 | .989 | .983 |
IFS | .993 | 1.000 | .994 | .999 | .997 | |
NIB | .991 | .994 | 1.000 | .992 | .984 | |
NIP | .989 | .999 | .992 | 1.000 | .995 | |
NIT | .983 | .997 | .984 | .995 | 1.000 | |
Sig. (1-tailed) | FATE | . | <.001 | <.001 | <.001 | <.001 |
IFS | .000 | . | .000 | .000 | .000 | |
NIB | .000 | .000 | . | .000 | .000 | |
NIP | .000 | .000 | .000 | . | .000 | |
NIT | .000 | .000 | .000 | .000 | . | |
N | FATE | 9 | 9 | 9 | 9 | 9 |
IFS | 9 | 9 | 9 | 9 | 9 | |
NIB | 9 | 9 | 9 | 9 | 9 | |
NIP | 9 | 9 | 9 | 9 | 9 | |
NIT | 9 | 9 | 9 | 9 | 9 | |
style='position:absolute;left:0;text-align:left;margin-left:0;margin-top:0;width:100.05pt;height:24.45pt;z-index:1;visibility:visible;mso-wrap-distance-top:3.6pt;mso-wrap-distance-bottom:3.6pt;mso-position-horizontal:center;mso-position-horizontal-relative:margin;mso-position-vertical:top;mso-position-vertical-relative:margin;mso-width-relative:margin;mso-height-relative:margin' />In contrast, the correlation coefficients for NIB, NIP, NIT with FATE are negative, although not statistically significant (p > .05). And known from the data in Table 4, for ARE, the correlation with IFS is weaker (r = .474, p = .099), and the relationships with other income sources are not statistically significant.
Table 4. Correlation between ARE and income sources
Correlations | ||||||
ARE | IFS | NIB | NIP | NIT | ||
Pearson Correlation | ARE | 1.000 | .474 | .533 | .453 | .450 |
IFS | .474 | 1.000 | .994 | .999 | .997 | |
NIB | .533 | .994 | 1.000 | .992 | .984 | |
NIP | .453 | .999 | .992 | 1.000 | .995 | |
NIT | .450 | .997 | .984 | .995 | 1.000 | |
Sig. (1-tailed) | ARE | . | .099 | .070 | .110 | .112 |
IFS | .099 | . | .000 | .000 | .000 | |
NIB | .070 | .000 | . | .000 | .000 | |
NIP | .110 | .000 | .000 | . | .000 | |
NIT | .112 | .000 | .000 | .000 | . | |
N | ARE | 9 | 9 | 9 | 9 | 9 |
IFS | 9 | 9 | 9 | 9 | 9 | |
NIB | 9 | 9 | 9 | 9 | 9 | |
NIP | 9 | 9 | 9 | 9 | 9 | |
NIT | 9 | 9 | 9 | 9 | 9 | |
4.3. Regression Analysis of Food, Alcohol, Tobacco, and Apparel Expenditures
The results of the multiple regression analysis are detailed in Table 5. For expenditures on food, alcohol, and tobacco, salary income (β = 1.232, p = .022) and transfer net income (β = -1.290, p = .041) are significant predictors, with IFS showing a positive effect and NIT showing a negative effect.
Table 5. Multiple regression analysis for expenditures on food, alcohol, and tobacco with IFS and NIT as predictors
Coefficientsa | ||||||
Model | Unstandardized Coefficients | Standardized Coefficients | t | Sig. | ||
B | Std. Error | Beta | ||||
1 | (Constant) | -2203.982 | 1275.406 | -1.728 | .159 | |
IFS | 1.232 | .341 | 4.991 | 3.615 | .022 | |
NIB | -1.115 | .611 | -.904 | -1.825 | .142 | |
NIP | -1.448 | .691 | -1.272 | -2.095 | .104 | |
NIT | -1.290 | .434 | -1.835 | -2.974 | .041 | |
a. Dependent Variable: FATE | ||||||
And known from the data in Table 4. For ARE , none of the income sources are significant predictors in the regression model (p > .05).And known from the data in Table 4 The overall model fit for FATE is high, with an R-squared of .996, indicating that the model explains 99.6% of the variance in these expenditures.
Table 6. Summary of Model Fit Statistics
Model Summary | ||||
Model | R | R Square | Adjusted R Square | Std. Error of the Estimate |
1 | .998a | .996 | .993 | 85.282 |
a. Predictors: (Constant), IFS, NIB, NIP, NIT | ||||
4.4. Granger Causality Analysis Results Interpretation
The Granger causality test results are summarized in the table 7, presenting the statistical evidence for the presence of causality between the variables at different lag orders.
Lag Order 1
• The F-test statistic is 0.3736 with a p-value of 0.1856.
• The Chi-squared test statistic is also provided, with a p-value of 0.2111.
• The Ratio test statistic results in a p-value of 0.3736.
• Conclusion: Given the p-values are greater than the conventional significance level of 0.05, we cannot reject the null hypothesis that there is no Granger causality at lag order 1. This suggests that at the first lag, the variables do not significantly predict each other.
Lag Order 2
• The F-test statistic increases to 0.4138, and the p-value becomes 0.0000, indicating a significant result.
• The Chi-squared test statistic yields a p-value of 0.0050.
• The Ratio test statistic results in a p-value of 0.4138.
• Conclusion: The p-value from the F-test is below the significance level, leading us to reject the null hypothesis. This suggests that at lag order 2, there is evidence of Granger causality between the variables. However, the inconsistency in the test statistics (specifically the Ratio test p-value) does not allow us to draw a consistent conclusion.
It is important to note that while the F-test indicates the presence of Granger causality at lag order 2, the lack of consistency across the test statistics suggests that further investigation is required to confirm the causal relationship. Additional analysis, such as examining the economic theory behind the variables or considering other statistical methods, may provide a more robust understanding of the relationship between the variables.
Table 7. Test p-values for Lag Order and Conclusions
Lag Order | F Test p-value | Chi-squared Test p-value | Likelihood Ratio Test p-value | Parameter F Test p-value | Conclusion |
1 | 0.3736 | 0.1856 | 0.2111 | 0.3736 | Cannot reject null hypothesis |
2 | 0.4138 | 0.0000 | 0.0050 | 0.4138 | Can reject null hypothesis, but no consistent conclusion |
5. Discussion
5.1. Interpretation of Regression Findings
The regression analysis provides valuable insights into the relationship between different income sources and consumption expenditures. The positive coefficient for salary income on FATE underscores the importance of earned income as a determinant of consumption in these categories.
The negative coefficient for NIT suggests that while transfers may provide a buffer against financial hardship, they might not have the same stimulative effect on consumption as earned income. This could be attributed to the fact that NIT is often perceived as less stable and more uncertain, leading consumers to be more cautious with their spending. [6]
The lack of significance for NIB and NIP in the model could indicate that these income sources are less liquid or are directed towards other financial priorities such as savings, debt repayment, or investment.
5.2. Comparison with Existing Literature
Our findings are in line with the permanent income hypothesis, which posits that consumers smooth their consumption over time based on their permanent income rather than transitory fluctuations. [8] However, the distinct impact of IFS and NIT on consumption highlights the need to differentiate between types of income when considering their effect on spending behavior.
The results also resonate with the concept of mental accounting, where consumers may categorize different income sources into different 'mental accounts' and allocate them to various expenditure categories or savings. [3]
5.3. Theoretical and Practical Implications
From a theoretical perspective, our study contributes to the understanding of the heterogeneous effects of income sources on consumption. [10] It suggests that economic models should consider the source of income when predicting consumption behavior, as different sources may have varying propensities to be spent.
Practically, these findings have implications for policymakers aiming to stimulate consumer spending. Policies that increase IFS, such as minimum salary hikes or earned income tax credits, may be more effective in boosting consumption than transfers.
For businesses, understanding the link between income sources and consumption can inform marketing strategies and product positioning. For instance, businesses may target promotions towards consumers with higher IFS for categories like FATE, where the propensity to spend is higher.
Furthermore, the negative impact of transfer income on consumption suggests that while social welfare programs are crucial for financial stability, they may not directly translate into increased consumer spending. Policymakers may need to consider complementary measures to encourage spending from such income sources.
In light of the ongoing digital transformation and the rise of e-commerce, future research should also explore how digital platforms and financial technologies influence the relationship between income sources and consumption behavior. [9]
6. Conclusion and Future Research
6.1. Summary of Key Findings
This study set out to explore the impact of various income sources on consumption expenditures, with a focus on FAT, and AR. The key findings can be summarized as follows:
IFS: There is a significant positive relationship between IFS and FATE. This suggests that earned income is a key driver of consumption in these categories.
NIT: A negative relationship was observed with expenditures on food, alcohol, and tobacco, indicating that while transfers may contribute to financial stability, they may not stimulate consumption to the same extent as earned income.
NIB and NIP: No significant correlation was found with the expenditures on the categories studied, suggesting that these income sources might be allocated to other financial priorities.
ARE: The relationship with salary income was weaker and not statistically significant, indicating that other factors beyond income sources may influence ARE.
6.2. Limitations and Critiques
While this study provides valuable insights, it is not without limitations. Firstly, the sample size of 9 cases, though representative, limits the generalizability of the findings. A larger sample would enhance the robustness of the conclusions.
Secondly, the cross-sectional nature of the data means that causality cannot be inferred from the observed correlations. Longitudinal data could provide a clearer picture of the causal relationships over time.
Additionally, the study did not account for potential confounding variables such as changes in consumer preferences, economic conditions, or demographic factors that could also influence consumption behavior. Future research should aim to control for these factors.
6.3. Directions for Future Research
Building on the findings of this study, future research could take several directions:
Sample Expansion: Increasing the sample size and diversifying the demographic representation could provide a more comprehensive understanding of the relationship between income sources and consumption.
Longitudinal Analysis: Conducting a longitudinal study to observe changes in consumption patterns over time in relation to income sources would offer insights into causality.
Control for Confounders: Future studies should control for variables such as consumer preferences, economic conditions, and demographic factors to better isolate the impact of income sources on consumption.
Cultural and Technological Factors: Exploring the role of cultural differences and technological advancements on consumption behavior in relation to income sources could reveal additional layers of complexity in consumer spending. [15]
Policy Interventions: Examining the effectiveness of different policy interventions aimed at stimulating consumption through various income sources could have practical implications for economic policy.
References
[1]. Berger, D., & Vavra, J. (2015). Consumption dynamics during recessions. Econometrica, 83(1), 101-154.
[2]. Busch, S. H., Jofre-Bonet, M., Falba, T. A., et al. (2004). Burning a hole in the budget: tobacco spending and its crowd-out of other goods. Applied Health Economics and Health Policy, 3, 263-272.
[3]. Cheema, A., & Soman, D. (2006). Malleable mental accounting: The effect of flexibility on the justification of attractive spending and consumption decisions. Journal of Consumer Psychology, 16(1), 33-44.
[4]. Cleveland, M., Papadopoulos, N., & Laroche, M. (2011). Identity, demographics, and consumer behaviors: International market segmentation across product categories. International Marketing Review, 28(3), 244-266.
[5]. Gupta, S., & Kim, H. W. (2010). Value‐driven Internet shopping: The mental accounting theory perspective. Psychology & Marketing, 27(1), 13-35.
[6]. Hajdu, C. (2023). Worried while prospering – A study of the contradictions between consumer confidence and spending in Hungary (Doctoral dissertation). Budapesti Corvinus Egyetem.
[7]. Jappelli, T., & Pistaferri, L. (2014). Fiscal policy and MPC heterogeneity. American Economic Journal: Macroeconomics, 6(4), 107-136.
[8]. Jappelli, T., & Pistaferri, L. (2010). The consumption response to income changes. Annual Review of Economics, 2(1), 479-506.
[9]. Kraus, S., et al. (2021). Digital transformation: An overview of the current state of the art of research. Sage Open, 11(3), 21582440211047576.
[10]. Krusell, P., & Smith, A. A. Jr. (1998). Income and wealth heterogeneity in the macroeconomy. Journal of Political Economy, 106(5), 867-896.
[11]. Lehenchuk, S., Zhyhlei, I., Ivashko, O., et al. (2023). The impact of sustainability reporting on financial performance: Evidence from Turkish FBT and TCL sectors. Sustainability, 15(20), 14707.
[12]. Mustapha, N. H. N., Abd Rashid, N. K., & Nasir, A. (2011). Household income and expenditure relationships: A simultaneous equation approach. Chinese Business Review, 10(6).
[13]. Schandl, H., et al. (2009). Socio-metabolic transitions in developing Asia. Technological Forecasting and Social Change, 76(2), 267-281.
[14]. Scholdra, T. P., et al. (2022). Households under economic change: How micro-and macroeconomic conditions shape grocery shopping behavior. Journal of Marketing, 86(4), 95-117.
[15]. Shavitt, S., & Cho, H. (2016). Culture and consumer behavior: The role of horizontal and vertical cultural factors. Current Opinion in Psychology, 8, 149-154.
Cite this article
Zhou,P. (2024). An empirical study on the impact of income sources of urban residents on consumption in China. Advances in Operation Research and Production Management,2,28-35.
Data availability
The datasets used and/or analyzed during the current study will be available from the authors upon reasonable request.
Disclaimer/Publisher's Note
The statements, opinions and data contained in all publications are solely those of the individual author(s) and contributor(s) and not of EWA Publishing and/or the editor(s). EWA Publishing and/or the editor(s) disclaim responsibility for any injury to people or property resulting from any ideas, methods, instructions or products referred to in the content.
About volume
Journal:Advances in Operation Research and Production Management
© 2024 by the author(s). Licensee EWA Publishing, Oxford, UK. This article is an open access article distributed under the terms and
conditions of the Creative Commons Attribution (CC BY) license. Authors who
publish this series agree to the following terms:
1. Authors retain copyright and grant the series right of first publication with the work simultaneously licensed under a Creative Commons
Attribution License that allows others to share the work with an acknowledgment of the work's authorship and initial publication in this
series.
2. Authors are able to enter into separate, additional contractual arrangements for the non-exclusive distribution of the series's published
version of the work (e.g., post it to an institutional repository or publish it in a book), with an acknowledgment of its initial
publication in this series.
3. Authors are permitted and encouraged to post their work online (e.g., in institutional repositories or on their website) prior to and
during the submission process, as it can lead to productive exchanges, as well as earlier and greater citation of published work (See
Open access policy for details).
References
[1]. Berger, D., & Vavra, J. (2015). Consumption dynamics during recessions. Econometrica, 83(1), 101-154.
[2]. Busch, S. H., Jofre-Bonet, M., Falba, T. A., et al. (2004). Burning a hole in the budget: tobacco spending and its crowd-out of other goods. Applied Health Economics and Health Policy, 3, 263-272.
[3]. Cheema, A., & Soman, D. (2006). Malleable mental accounting: The effect of flexibility on the justification of attractive spending and consumption decisions. Journal of Consumer Psychology, 16(1), 33-44.
[4]. Cleveland, M., Papadopoulos, N., & Laroche, M. (2011). Identity, demographics, and consumer behaviors: International market segmentation across product categories. International Marketing Review, 28(3), 244-266.
[5]. Gupta, S., & Kim, H. W. (2010). Value‐driven Internet shopping: The mental accounting theory perspective. Psychology & Marketing, 27(1), 13-35.
[6]. Hajdu, C. (2023). Worried while prospering – A study of the contradictions between consumer confidence and spending in Hungary (Doctoral dissertation). Budapesti Corvinus Egyetem.
[7]. Jappelli, T., & Pistaferri, L. (2014). Fiscal policy and MPC heterogeneity. American Economic Journal: Macroeconomics, 6(4), 107-136.
[8]. Jappelli, T., & Pistaferri, L. (2010). The consumption response to income changes. Annual Review of Economics, 2(1), 479-506.
[9]. Kraus, S., et al. (2021). Digital transformation: An overview of the current state of the art of research. Sage Open, 11(3), 21582440211047576.
[10]. Krusell, P., & Smith, A. A. Jr. (1998). Income and wealth heterogeneity in the macroeconomy. Journal of Political Economy, 106(5), 867-896.
[11]. Lehenchuk, S., Zhyhlei, I., Ivashko, O., et al. (2023). The impact of sustainability reporting on financial performance: Evidence from Turkish FBT and TCL sectors. Sustainability, 15(20), 14707.
[12]. Mustapha, N. H. N., Abd Rashid, N. K., & Nasir, A. (2011). Household income and expenditure relationships: A simultaneous equation approach. Chinese Business Review, 10(6).
[13]. Schandl, H., et al. (2009). Socio-metabolic transitions in developing Asia. Technological Forecasting and Social Change, 76(2), 267-281.
[14]. Scholdra, T. P., et al. (2022). Households under economic change: How micro-and macroeconomic conditions shape grocery shopping behavior. Journal of Marketing, 86(4), 95-117.
[15]. Shavitt, S., & Cho, H. (2016). Culture and consumer behavior: The role of horizontal and vertical cultural factors. Current Opinion in Psychology, 8, 149-154.