


1 Introduction
The indoor physical environment includes factors such as sound, light, and heat, among which lighting is one of the most fundamental physical factors. A reasonable indoor lighting environment not only provides a good visual experience but also affects people's physiological and psychological comfort [1]. A healthy and comfortable indoor lighting environment is significant for people's learning, work, and daily life. By experimenting to explore the impact of indoor lighting on learning and work efficiency, this study aims to find the optimal lighting solutions and reasonable illumination ranges to provide a basis for future designs that meet human needs and are suitable for learning and work.
2 Measurement Experiment
2.1 Experimental Principle
Learning and work are primarily completed through visual perception and advanced neural activities. The phenomenon of operational decline and mental capacity reduction during these activities is referred to as brain fatigue. Different illumination levels affect physiological parameters and visual efficiency of subjects differently, leading to varying degrees of brain fatigue.
Based on the existing literature on methods to measure brain fatigue, the study can be divided into objective and subjective indicators [2]:
Objective Indicators: Using physiological testing devices to collect EEG waves and comparing the power spectra of different frequency bands of the EEG signals. The larger the ratio of EEG power spectrum (α +θ)/β, the higher the level of fatigue.
Subjective Indicators: Using task performance measurements to gauge learning efficiency. Different illumination levels serve as the single variable, and subjects sequentially complete tasks such as letter recognition (Anfimov character comparison), figure recognition (Landolt ring recognition), and number recognition (number proofreading). By calculating the error rate, mental work index (IMC value), and IMC index change rate under different illumination levels, the study statistically analyzes and reflects the efficiency of work under various lighting conditions to determine the extent of brain fatigue.
2.2 Experimental Materials
1 Bioharness Portable Psychological Signal Tester: Used for collecting EEG signals.
2 Various Testing Materials: Including Anfimov character comparison tables, Landolt ring recognition tables, and number proofreading tables, to test subjects' work efficiency under different lighting conditions.
3 ILLUMINANCE METER T-10: Used to measure the illuminance values at various points within the testing environment to ensure consistency with the experimental settings.
2.3 Experimental Environment Setup
The experiment was conducted at the Smart Lighting Environment Laboratory of North China University of Technology. According to the "Architectural Lighting Design Standards," indoor illuminance values are often set at 300lx and 500lx. Some scholars suggest that color temperatures between 5000K and 6500K help delay visual fatigue and improve learning efficiency. Based on these guidelines and experimental needs, this study uses 200lx, 300lx, and 500lx as variable illuminance levels, with a color temperature set at 5000K. Since the experiment focuses on artificial lighting, windows were completely covered with curtains to block natural light. The lighting fixtures were set at a height of 2500mm with adjustable brightness.
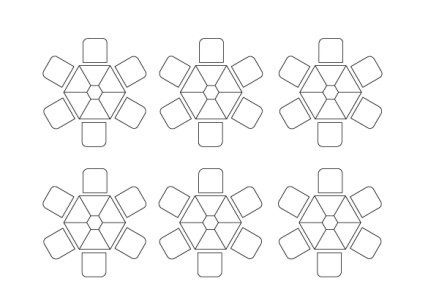
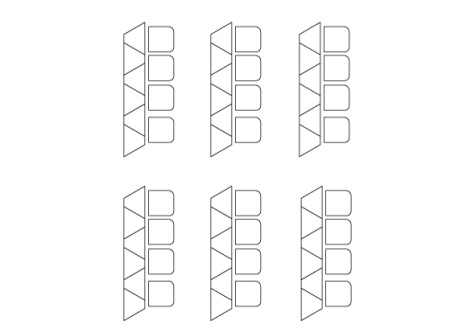
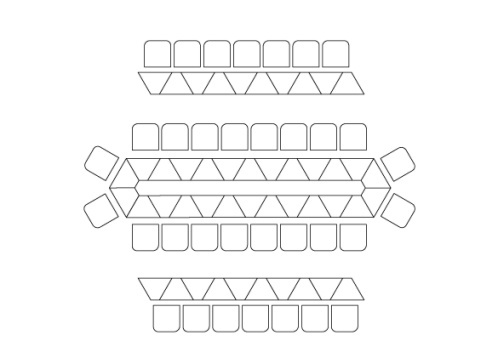
In daily learning and work, people's study behaviors can be divided into three forms: group discussion, independent study, and opinion consultation. Consequently, classroom furniture arrangements include: discussion-type seating for group discussions, parallel seating for independent study, and enclosed seating for opinion consultations. This experiment was conducted using a discussion-type seating arrangement.
|
|
|
Figure 1. Discussion-Type Desk and Chair Arrangement |
Figure 2. Independent Study Desk and Chair Arrangement |
Figure 3. Opinion Consultation Desk and Chair Arrangement |
2.4 Experimental Participants and Tasks
A total of 48 participants were selected from the entire school, covering grades from freshman to third-year graduate students, aged between 18 and 25. The gender ratio was 1:1, with 24 males and 24 females. Participants were healthy, had regular living habits, did not engage in excessive drinking, smoking, or coffee consumption, did not take medications, and were not simultaneously participating in other clinical trials. During the experiment, participants were divided into 4 groups, each consisting of 16 people, with 4 subgroups of 2 males and 2 females in each group, conducting the experiment in a crossover manner.
Each group of experiment personnel was responsible for:
Table 1. Responsibilities and Roles of Experimental Personnel
Experimental Task |
Number of People |
Description of Work |
Lighting Control |
1 person |
Control the lighting equipment in the laboratory to ensure that each experiment reaches the required illumination level. |
Time Control |
1 person |
Control and record the duration of each experimental segment to ensure the data is reasonable and valid. |
Illuminance Recording |
1 person |
Coordinate with the lighting control person to ensure uniform illumination at all positions in the laboratory and achieve the required illumination level. |
EEG Testing |
3 people |
Collect EEG data using physiological devices during task performance for subsequent analysis of the brain fatigue index. |
Test Assistance |
3 people |
Assist the EEG test subjects in collecting EEG data, help them with the setup and adjustment of devices, and record the time. |
Task Performance |
7 people |
Complete the assigned tasks within the specified time for subsequent analysis of the error correction rate, IMC index, and IMC index change rate. |
2.5 Experimental Precautions
Before the experiment, participants should undergo training to understand the specific content and requirements of the lighting environment experiment. They should also become proficient in using the laboratory's lighting adjustment system, the Bioharness portable psychological signal tester, and the illuminance meter.
Participants' physical conditions must be confirmed in advance. Participants should not have engaged in intense physical activity, stayed up late, smoked, consumed alcohol, or taken medications within the previous 72 hours.
Participants should enter the laboratory 20 minutes early to complete adjustments to the arrangement of desks and chairs, the illumination in various areas of the laboratory, and to collect the task measurement sheets and prepare the Bioharness portable psychological signal tester. The experimental time and steps must be strictly followed. Each group’s experiment will last approximately 1 hour. If a participant shows significant sweating or physical discomfort, the experiment should be stopped immediately.
After the experiment, all equipment should be returned to its original place. Task measurement sheets should be sorted by participant to prevent data confusion, which could affect the experimental results. Task measurement data and EEG data should be collected and organized as soon as possible to improve the efficiency of the experiment.
2.6 Experimental Procedure
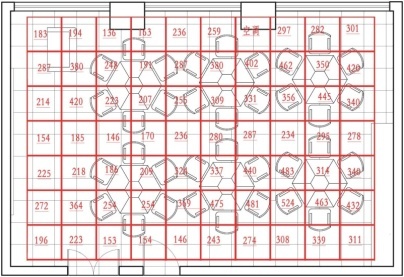
Before the official measurement experiment begins, divide the laboratory into several small areas under normal lighting conditions according to relevant illuminance measurement point methods [3]. Use the illuminance at the midpoint of each small area to represent the illuminance of the entire area. This will allow the creation of an illuminance diagram of the laboratory's various positions.
|
|
|
Figure 4. Division of Sampling Areas in the Classroom |
Figure 5. Measurement and Recording of Illuminance in Sampling Areas |
Figure 6. Illuminance of Various Areas in the Classroom Before the Experiment |

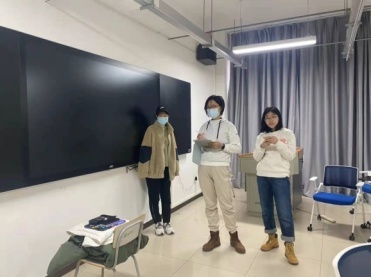
1 Before lighting, participants complete the first task performance measurement and physiological index collection, with physiological parameters measured continuously for 5 minutes.
2 After completing the task and physiological measurements, participants enter the lighting environment and begin independent study, simulating a study state as closely as possible.
3 After 0.5 hours of study, participants complete the second task performance measurement and physiological index collection, with physiological parameters measured continuously for 5 minutes.
4 After the measurements, the day's experiment concludes.
3 Data Collection and Analysis
3.1 Experimental Data
• Error Rate = (Number of Errors / Number of Characters Read) · 100%
• Mental Work Capacity Index (IMC) = (Number of Characters Read / 2) {(Number of Expected Deletions - Number of Incorrect Deletions) / Number of Expected Deletions}
• IMC Index Change Rate = (IMC Index After Lighting - IMC Index Before Lighting) / IMC Index Before Lighting
The arithmetic average of the IMC indices obtained from the three test materials is used as the IMC index result for the participants under that lighting condition. The IMC index change rate is calculated using the above method, and the arithmetic average of the IMC index change rates for all participants is then computed.
First, collect the participants' task error rates, IMC values, and IMC index change rates. Based on the experimental data and related calculation methods, the following results are obtained:
Table 2. Average Values of Task Measurement Data
Measurement |
200 lx |
300 lx |
500 lx |
Error Rate |
0.47% |
1.14% |
0.31% |
IMC Index |
200.4 |
218.3 |
239.4 |
IMC Index Change Rate |
0 |
0.232 |
0.388 |
Noise reduction was applied to the obtained EEG data using an independent component algorithm script, which can intelligently eliminate the interference of eye movements on EEG signals. Next, wave separation was performed, and the power of four types of waveforms was calculated for each frequency band. The data was collected continuously for 5 minutes each time, and the ratio value was recorded as the R value. The R value represents the proportion of the power of each of the four wave frequency bands to the total power of all wave frequency bands.
Table 3. R Values for Each Frequency Band
Data ID |
Factor A Color Temperature (K) |
Factor B Illuminance (Lx) |
Rα |
Rβ |
Rθ |
Rδ |
1 |
5000 |
200 |
0.30 |
0.28 |
0.35 |
0.11 |
2 |
5000 |
200 |
0.29 |
0.25 |
0.32 |
0.12 |
3 |
5000 |
300 |
0.24 |
0.21 |
0.40 |
0.16 |
4 |
5000 |
300 |
0.14 |
0.21 |
0.13 |
0.28 |
5 |
5000 |
500 |
0.19 |
0.31 |
0.20 |
0.33 |
6 |
5000 |
500 |
0.14 |
0.27 |
0.36 |
0.27 |
Table 4. Average R Values for Each Frequency Band
Illuminance |
200lx(Pre-lighting) |
300lx |
500lx |
|
Parameter |
R Value |
R Value |
R Value |
|
R Value Average |
Α Wave |
0.295 |
0.19 |
0.165 |
β Wave |
0.265 |
0.21 |
0.22 |
|
θ Wave |
0.335 |
0.265 |
0.28 |
|
δ Wave |
0.115 |
0.22 |
0.30 |
3.2 Data Analysis
Based on the experimental guidelines, the author has chosen the mental fatigue index and IMC index variation rate as the evaluation metrics for the experimental results. A low level of mental fatigue and a high IMC index variation rate indicate that at this illuminance level, the test subjects have higher work efficiency, and this illuminance level is more comfortable and conducive to their work and study.
Through preliminary literature review and organization, the following indicators were identified for analyzing mental fatigue levels [4]:
• Under normal relaxed conditions, the proportion of alpha waves (α) is 40%-90%.
• An increase in the proportion of theta waves (θ) indicates drowsiness.
• A dominance of beta waves (β) signifies anxiety and tension.
• An increase in both theta (θ) and delta waves (δ) indicates severe mental fatigue.
Based on the above data and analysis indicators, the following conclusions can be drawn from this experiment:
1. Within the illuminance range of 200 lx to 500 lx, the IMC index shows an increasing trend with higher illuminance, reaching its maximum at 500 lx.
2. Within the same illuminance range, the Rα value of the subjects is lower than that under normal relaxed conditions and shows a decreasing trend with increasing illuminance.
3. Within this illuminance range, the Rβ and Rθ values show a decreasing trend with increasing illuminance, though this trend is not very pronounced, and some individual data points may exhibit abnormally high values.
4. Within this illuminance range, the Rδ value shows an increasing trend with higher illuminance, although its overall proportion remains relatively small.
4 Experimental Conclusions
Based on the analysis of the data, it can be concluded that within the illuminance range of 200 lx to 500 lx, an increase in illuminance tends to improve the efficiency of the test subjects and reduce their mental fatigue. Thus, in this experiment, an illuminance of 500 lx is considered optimal compared to the other two levels, with a range of 300 lx to 500 lx being reasonable.
Although the experiment provides preliminary conclusions, several issues remain:
1 The number of trials and test subjects was relatively small, and the range of illuminance levels was limited. The resulting data is minimal, making the analysis results quite incidental.
2 A significant issue lies in the analysis of the mental fatigue index. When analyzing the Rα value, the proportion of alpha wave energy was found to be too low, indicating that the subjects were not in a completely relaxed state during the test but were already experiencing tension and fatigue. This discrepancy suggests that the results may not fully represent those of a normal state, leading to biased experimental data. The subjects' tension and fatigue could be related to unfamiliarity with the experimental procedures and equipment, as well as the duration of the experiment.
3 During the analysis of the mental fatigue index, abnormal results were observed at 500 lx. This anomaly could be due to the fact that the mental fatigue index is influenced by more than just illuminance. Since the 500 lx tasks and EEG data collection were conducted last, the subjects were already fatigued from the previous two rounds of testing, which could have affected the results attributed solely to illuminance.
5 Summary
The lighting environment within a space can influence its comfort level, thereby affecting learning and work efficiency. Therefore, considering natural light and artificial lighting as design factors in architectural planning is essential.
In this experiment, the impact of illuminance on the environment and its occupants was explored to determine whether the lighting environment was comfortable. This provides insights for designing indoor environments with appropriate illuminance levels based on the space’s location, function, and user demographics. Additionally, other criteria such as color temperature, luminous flux, light quality, and uniformity of illumination should be considered to evaluate the comfort and health of the lighting environment.
Combining experimental data with relevant literature [5], the following indoor lighting design strategies are summarized:
1 Color Temperature Design: Although this experiment did not explore color temperature variations, it is a crucial factor in lighting design. Different light colors can affect a person’s psychology and emotions, similar to how colors can be categorized as cool or warm. Cool colors can evoke feelings of melancholy and calm, while warm colors can create a sense of warmth and cheerfulness. Therefore, the choice of light color should be based on the building's function and user demographics. For example, warm light is often used in family dining rooms and bedrooms to create a cozy atmosphere, while cool light is used in hospitals, offices, and classrooms to keep spaces refreshing and promote alertness and rational thinking.
2 Illuminance Design: This experiment demonstrated that illuminance affects the comfort of the lighting environment, thus influencing learning and work efficiency. According to the "Architectural Lighting Design Standards," the typical indoor illuminance values are 300 lx and 500 lx, and the experimental data confirmed that the 300 lx to 500 lx range is optimal. When selecting illuminance levels, factors such as the space's area, volume, and natural light conditions should be considered to adjust the illuminance, enhancing the comfort of the space and the efficiency of its users.
3 Lighting Fixtures Design: Lighting is an artistic element in architectural design. By choosing different lighting fixtures and optimizing actual plans, various artistic lighting effects can be created. Using different combinations of fixtures can produce direct, indirect, and diffuse lighting, offering a rich variety of lighting expressions and enhancing the overall comfort of the lighting environment. Therefore, the form of lighting fixtures, installation angles, reflective materials, and other factors should be thoughtfully considered by designers in relation to the specific space and function.
4 Green Lighting Environment: In recent years, as environmental protection and sustainable development concepts have gained traction, attention to green and energy-efficient buildings has increased. Consequently, green lighting environment design has also become more prominent [6]. In response to green lighting design, designers must consider not only the comfort of the lighting environment but also incorporate eco-friendly and energy-saving principles.
5 This includes using low-energy lighting such as LED fixtures, reducing illuminance to save energy while meeting functional needs, and utilizing natural light sources to meet lighting requirements, thereby reducing the resource consumption associated with artificial lighting.
Sources
The figures in this article are drawn by the author.
References
[1]. Yan, J. (2022). Research on the impact of indoor light environment on students' learning efficiency [Doctoral dissertation, Hebei University of Engineering]. https://doi.org/10.27104/d.cnki.ghbjy.2022.000669
[2]. Sun, L., Zhu, P., Yuan, X., et al. (2018). Comparative experimental research on brain fatigue measurement methods. Human Ergonomics, 24(06), 32-38. https://doi.org/10.13837/j.issn.1006-8309.2018.06.0007
[3]. Zhang, L., Li, M., & Cao, J. (2020). Point layout method in classroom illuminance measurement. China Lighting Appliances, (07), 32-36.
[4]. Xu, M., Jin, L., & Zhang, A. (2020). Research on brain fatigue characteristics of maintenance workers in confined space based on EEG. China Safety Production Science and Technology, 16(06), 171-176.
[5]. Meng, Y. (2021). Natural light environment design ideas for green buildings. Energy Conservation, 40(11), 79-80.
[6]. Sun, B., & Cao, B. (2021). Research on smart lighting design strategies for building interiors. Architecture and Culture, (08), 39-40. https://doi.org/10.19875/j.cnki.jzywh.2021.08.013
Cite this article
Huang,Q. (2024). Exploring the impact of indoor lighting environment on learning and work efficiency. Advances in Operation Research and Production Management,2,50-55.
Data availability
The datasets used and/or analyzed during the current study will be available from the authors upon reasonable request.
Disclaimer/Publisher's Note
The statements, opinions and data contained in all publications are solely those of the individual author(s) and contributor(s) and not of EWA Publishing and/or the editor(s). EWA Publishing and/or the editor(s) disclaim responsibility for any injury to people or property resulting from any ideas, methods, instructions or products referred to in the content.
About volume
Journal:Advances in Operation Research and Production Management
© 2024 by the author(s). Licensee EWA Publishing, Oxford, UK. This article is an open access article distributed under the terms and
conditions of the Creative Commons Attribution (CC BY) license. Authors who
publish this series agree to the following terms:
1. Authors retain copyright and grant the series right of first publication with the work simultaneously licensed under a Creative Commons
Attribution License that allows others to share the work with an acknowledgment of the work's authorship and initial publication in this
series.
2. Authors are able to enter into separate, additional contractual arrangements for the non-exclusive distribution of the series's published
version of the work (e.g., post it to an institutional repository or publish it in a book), with an acknowledgment of its initial
publication in this series.
3. Authors are permitted and encouraged to post their work online (e.g., in institutional repositories or on their website) prior to and
during the submission process, as it can lead to productive exchanges, as well as earlier and greater citation of published work (See
Open access policy for details).
References
[1]. Yan, J. (2022). Research on the impact of indoor light environment on students' learning efficiency [Doctoral dissertation, Hebei University of Engineering]. https://doi.org/10.27104/d.cnki.ghbjy.2022.000669
[2]. Sun, L., Zhu, P., Yuan, X., et al. (2018). Comparative experimental research on brain fatigue measurement methods. Human Ergonomics, 24(06), 32-38. https://doi.org/10.13837/j.issn.1006-8309.2018.06.0007
[3]. Zhang, L., Li, M., & Cao, J. (2020). Point layout method in classroom illuminance measurement. China Lighting Appliances, (07), 32-36.
[4]. Xu, M., Jin, L., & Zhang, A. (2020). Research on brain fatigue characteristics of maintenance workers in confined space based on EEG. China Safety Production Science and Technology, 16(06), 171-176.
[5]. Meng, Y. (2021). Natural light environment design ideas for green buildings. Energy Conservation, 40(11), 79-80.
[6]. Sun, B., & Cao, B. (2021). Research on smart lighting design strategies for building interiors. Architecture and Culture, (08), 39-40. https://doi.org/10.19875/j.cnki.jzywh.2021.08.013