


1. Introduction
1.1. Background of the problem
Figure 1. Information feature extraction
The Olympic Games are global multi-event games organized by the International Olympic Committee, and they are the largest summer comprehensive games in the world. The medal table in the Olympic Games is always the center of attention. The variation of a country's medal count in the Olympic Games is closely related to the athletes' on-field performance, the selection of event programs, the arrangement of the competition system and the influence of coaches. From the point of view of system science, the Olympic Games is a large dynamic and complex system, how to scientifically and accurately establish the prediction model of the competition results, and unveil the law behind the medals, has a wide and far-reaching practical significance.
1.2. Restatement of the problem
1.2.1. Question one
• Based on the constructed prediction model, predict the medal forecast for the 2028 Summer Olympics in Los Angeles, including the prediction interval. Analyze which countries are more likely to make progress in medal acquisition and which countries are likely to underperform.
• Focus on countries that have yet to win an Olympic medal; forecast the number of countries that will win their first medal at the next Olympics and give the likelihood of winning for the first time.
• In addition, the Olympic Games program (including the number and type of events) is explored in depth, analyzing the intrinsic links between events and their relationship to the number of medals won by each country, and exploring the importance of each sport to different countries and the reasons behind it. Finally, how do the events chosen by the host country affect the predicted results?
1.2.2. Question two
Athletes can represent different countries but this does not usually affect the number of medals won, whereas coaches are relatively free to move between countries, so there may be a “great coach” effect. For example, Lang Ping has coached both Chinese and American volleyball teams to astonishing results. Through careful examination of the relevant data, we will look for strong evidence of changes in performance due to the “Great Coach” effect; how to estimate the extent of the contribution of the “Great Coach” effect to the number of medals; and how to select three countries to determine the possible existence of the “Great Coach” effect. “Select three countries, identify sports that may have the Great Coach effect, and reasonably predict the impact of the introduction of the Great Coach on the number of medals won.
1.2.3. Question three
Based on the constructed Olympic medal count prediction model, dig deeper into the unique insights contained therein that have not yet been widely recognized, and further elaborate on how to help the Olympic committees of each country to provide key information to support the formulation of strategic planning, decision-making on resource allocation, and the layout of program development.
2. Modeling preparation
2.1. Modeling assumptions
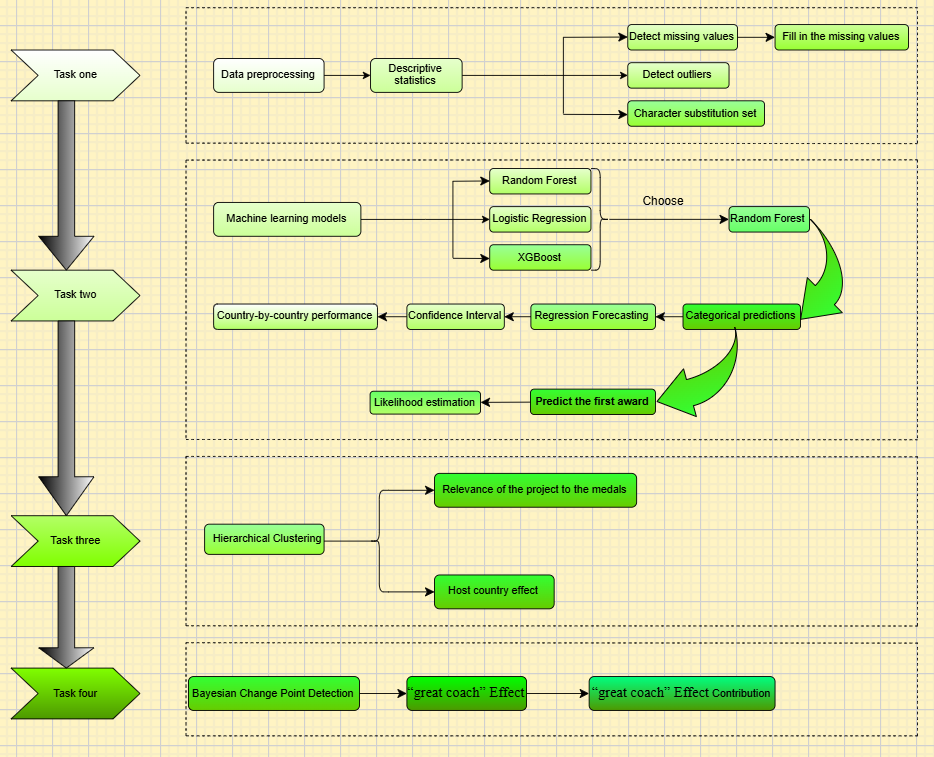
Figure 2. Mind logic map
Assumption 1. When analyzing the number of medals of different countries, it is assumed that the historical data and historical and cultural background of each country will not have a non-negligible impact on the results of the prediction model, and that all countries are analyzed under the same evaluation framework, and the scalars in the model can be applied to all countries.
Assumption 2. In order to ensure the timeliness of the data, it is assumed that the accurate number of medals, number of events, number of athletes and other pertinent information for each country can be provided with high quality. Therefore, the historical data can reflect the real situation of each country at discrete time points.
Assumption 3. It is hypothesized that the characteristics variables have strong correlation for medal count prediction. When predicting the number of gold medals and the total number of medals, each characteristic can effectively predict the consequences. Based on this, a regression model was used to estimate the specific number of medals and a classification model was used to predict the likelihood of each country winning a medal.
Assumption 4. It is assumed that there is some correlation between the number of athletes and the number of medals. However, the impact of the coach is considered to be an independent influence and there is also some correlation between the contribution to medals. In addition, it is hypothesized that changes in coaching will result in significant fluctuations in the number of medals.
Assumption 5. It is assumed that host countries tend to choose their dominant sports when adding new Olympic sports. The addition of new sports may have an impact on the number of medals won by each country. The number of medals won by the host country in some specific sports may be significantly higher than the number of medals won by non-host countries.
2.2. Description of symbols
Table 1. Variable declaration table
Symbol | Implication |
\( NOC \) | National abbreviation |
\( Year \) | Year of competition |
\( Gold \) | The number of gold MEDALS won |
\( Total \) | Total number of MEDALS won |
\( Ggr \) | Gold growth rate |
\( Tgr \) | Total growth rate |
\( Medal-Judge \) | Medal Judgment variable |
\( Host-Judge \) | Host Judgment variable |
\( Medal-per \) | Number of medals won in a given sport |
\( SPN \) | the name of the sport |
\( Pre-Gold \) | Predicted number of gold medals |
\( Pre-Total \) | Predicted the total number of medals |
\( Pre-GoldInterval \) | Confidence interval for predicting the number of gold medals |
\( Pre-TotalInterval \) | Confidence interval for predicting the total number of medals |
\( Prob\_Gold \) | The predicted probability of winning a gold medal |
\( Prob\_Total \) | The predicted Probability of Winning a Medal |
\( Item cluster \) | In the hierarchical clustering model, represents the clustering results of countries on different sports. |
\( η \) | The annual contribution of the host country or non-host country in the number of events to the medal count. |
\( Nocptwm \) | Number of countries predicted to win medals |
\( Tnoc \) | Total number of countries |
2.3. Data processing
Missing values and outliers are detected by performing missing values and outliers on the data given in the title.
2.3.1. Missing values
There are no missing values in all data sets (host data, athlete data, medal data) athletes. There are missing values for some of the Discipline columns and years (2016, 2020, 2024) in the project dataset (programs_df) only, for a total of 2 missing values.
2.3.2. Outliers.
No outliers were found in the medal data or program data.
2.3.3. Filling
The missing values in the Discipline column have been filled using the corresponding Sport column. For missing values in the years (2016, 2020, 2024), the rows containing the missing values were deleted. The dataset contains 72 valid records with complete data after data replenishment is completed.
2.3.4. Mapping table creation
Observe the annex given in the title, the meaning of NOC is inconsistent in different tables, for which we need to preprocess the data: for the data in the title: noc is the full name of the country in medal_counts.csv; noc is the abbreviation in athletes.csv.
We make the following character substitution table, which can be integrated and extracted as feature data in the subsequent paper.
3. Problem One Modeling
3.1. The objective of model building requires
• To be able to predict the probability of whether a participating country will win a medal in 2028
• Be able to predict at least the number of gold medals and the total number of medals for the participating countries in 2028 (the predicted number of gold medals and the number of medals should be an interval range i.e. a problem that includes an uncertainty interval)
• Find the countries that will improve their medal situation in 2028 as well as those that will get worse
• Be able to predict the number and probability of countries winning for the first time at the 2028 Olympics
• Quantify the impact of event selection on medal outcomes
• Explore which each country has a significant advantage on to allow for a more in-depth portrayal of how the hosts go about their arrangements
Since the next model will focus on using the Random Forest model, it is specifically introduced here.
3.2. Introduction of the idea
The general idea is to construct classification and regression models by first predicting whether each country will win the award through the classification prediction model, finding the countries that will win the award based on the classification model, and then predicting the total number of medals for the winning countries according to the regression model.
3.2.1. Classification prediction model
We use the Machine learning [1] classification model to predict whether the 2028 participating countries can win the prize or not, and get the probability of whether the 2028 participating countries can win the prize or not through the Machine learning classification model prediction. The probability is between 0 and 1. If the probability is 0, the country will not win the prize, if the probability is 1, the country will win the prize, if the probability is >0 and <1, the country will win the prize.
\( p(Medal)=\frac{Nocptwm}{Tnoc} \) (1)
Indicators used in the evaluation of classification models
Accuracy [ \( Accuracy=\frac{(TP+TN)}{(TP+TN+FP+FN)} \) ]
AUC-ROCCurve; Evaluation of the level of discrimination of the model, focusing on the assessment regarding unbalanced datasets.
3.2.2. Indicator Interpretation
The accuracy rate is applicable to the case where the distribution of data categories is relatively balanced. However, when the distribution of data categories is not balanced, the accuracy rate may not reflect the performance of the model well.
The AUC value is the area under the ROC curve, and the value ranges from 0 to 1. The closer the AUC value is to 1, the better the performance of the model is; when the AUC value is 0.5, the performance of the model is equivalent to random guessing. the ROC curve and the AUC value are not affected by the distribution of the data categories, so they are applicable to the case of imbalanced distribution of the categories.
The accuracy index is applicable to the case of balanced data distribution, while the AUC-ROC curve is applicable to the case of unbalanced category distribution, and the two are exactly complementary to each other, then the evaluation of the classification prediction model can be completed by the above two indexes.
Regression model for predicting medals (gold vs. total medals)
We construct a Machine learning regression model, on the premise that the previous categorical prediction model predicts whether the participating countries will be able to win a medal or not, which is used to predict the winners of each country in the Olympic Games in 2028 and the total number of medals of the winning countries.
Table 2. Accuracy And AUC of Three Algorithms
Accuracy | AUC | |
Random Forest | 0.9756 | 0.9667 |
Logistic Regression | 0.9512 | 0.9333 |
XGBoost | 0.9512 | 0.9474 |
In order to reduce the uncertainty, we used several regression models such as Random Forest [2] Regression Model, Modellogistic Regression model, XGB-boost regression model, and finally confirmed the selection of Random Forest model for the prediction of the number of medals by the Confusion Matrix and the results of the model evaluation index.
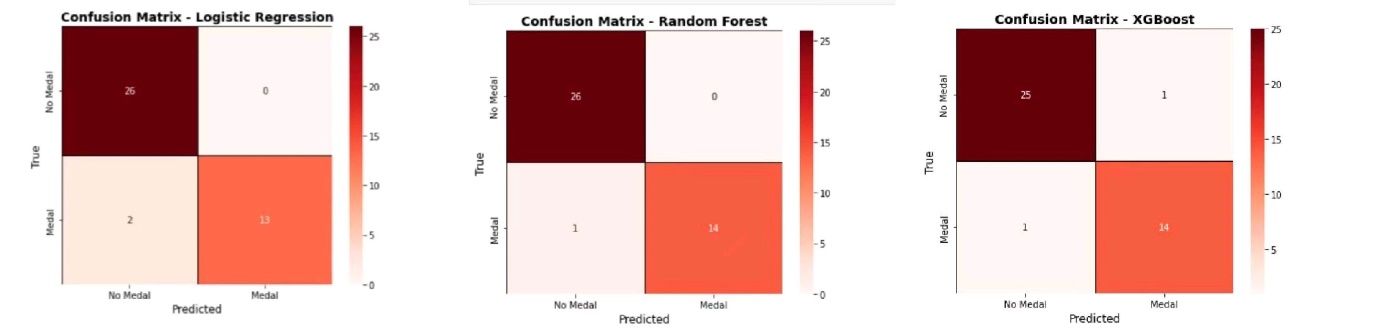
Figure 3. Three algorithms' confusion matrices
3.3. Evaluation of regression models
Evaluation Indicators
• MSE (Mean Square Error): Evaluates the difference between the predicted and actual values.
• MAE (Mean Absolute Error): Estimates the error generated by the model prediction.
• Interval coverage: ensuring that the actual number of medals can be covered by the predicted intervals
3.4. Modeling results
• Prediction of whether the participating countries can win awards
Through the Rand Forest classification prediction model to get the 2028 Olympic Games participating countries to win the probability of winning, where 0 is definitely cannot win, 1 is definitely can win, the rest are likely to win.
• The predicted number of gold medals and total medals
Through the Random Forest regression model, we can get the predicted values and prediction intervals of the number of gold medals and total medals of each participating country. We can also estimate the inaccuracy of the predictions by using different quartiles of the confidence intervals provided by the Random Forest model.
• Analysis of the scenarios of improved or worse performance of the participating countries in 2028
Based on the predicted number of gold medals and total medals for the participating countries (2028) compared to the 2024 results, we can find out whether the performance of each country has improved or gotten worse.
• Predicting the countries that will win for the first time at the 2028 Olympic Games
First time winners are countries that have never won a gold or medal in their history, but are likely to do so in 2028 according to the model's predictions. So, we need to pick out countries that have a high predicted probability of winning and have not won a medal before
4. Practical solution of the model of problem
4.1. Date selection
Regarding the use of data, the data provides the participation data of athletes from 1896 to 2024, but we only use the data of three years, 2016, 2020, and 2024, to solve the model.
The reasons for this are articulated below.
4.1.1. Data timeliness and relevance
Reflecting the current level of competition: the competitive environment of sports events, the level of athletes, and the rules of competition all change over time. Newer data can better reflect the current athletes' competitive status, training methods, technical level and the overall sports development trend.
4.1.2. Conform to the characteristics of recent events
The organization of sports events and competition rules may be adjusted at different times. Take the Olympic Games as an example, each Olympic Games may be different in terms of program settings and competition rules. The data of the last three Olympic Games can better reflect the characteristics and requirements of the current events, thus making the model more accurate in predicting the results of future competitions.
4.1.3. Accuracy and Reliability of Predictions
Reducing the impact of uncertainty in long-term trends: Using earlier data for model training may introduce too many uncertainties that can affect the accuracy and reliability of the model's predictions. Data from the last three years is relatively less affected by these long-term uncertainties, and can more consistently reflect the athletes' participation performance and competition results, helping to improve the model's prediction accuracy.
4.1.4. Enhancing the model's adaptability to recent fluctuations
The results of sports events are often affected by some short-term factors, such as athletes' injuries and illnesses, and the clinical status during the games. The data of the last three years contains more recent information, which can better capture the impact of these short-term factors and make the model more adaptable and flexible, thus improving the prediction accuracy.
We extracted the data from the last three sessions using python. and generated seven tables as needed, but the features in the above seven tables are not the best prediction features, after going through the tedious consideration and selection of data features, we chose the following features for the prediction of the number of gold medals as well as the total number of medals: athlete Number of athletes; growth rate of number of athletes; number of gold medals; number of total medals; growth rate of gold medals; growth rate of total medals; whether it is the host country or not; and whether it is an award winner or not.
Let's answer the specific questions in Question 1 separately.
4.2. Classification to predict whether to win or not
Random Forest classification model is used to predict whether the participating countries will win medals in 2028.
Target variable Medal (whether or not it won a medal, 1 means it won, 0 means it didn't win a medal)
Equation:
\( p(medal)=classification model (X)where p(medal) ∈\lbrace 0,1\rbrace \) (2)
The output gets the probability of each country winning a medal, and the decision to win or not to win is based on the determination of the threshold, which is taken to be 0.6, i.e., a probability of more than 0.6 wins a medal, and a probability of less than 0.6 cannot win a medal.
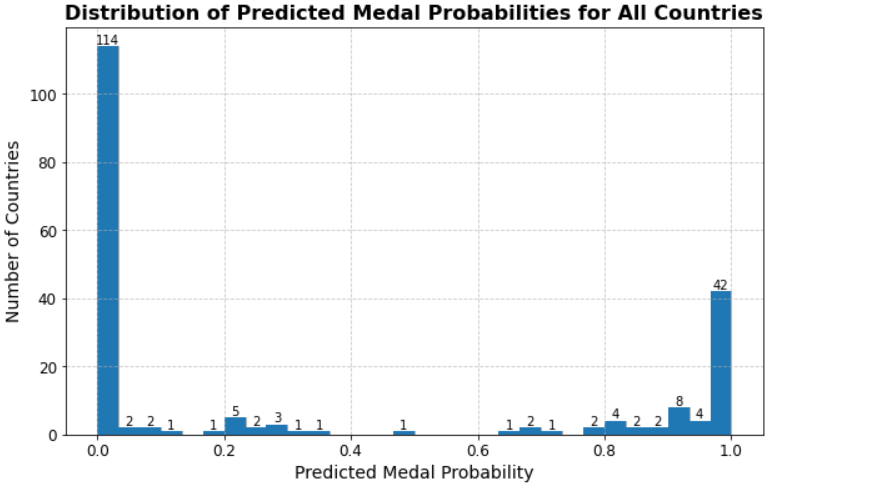
Figure 4. All countries' predicted medal tally
There are 42 countries with probability 1 There are 114 countries with probability 0, and the rest are countries with probability between 0 and 1.
The rest are countries with probabilities between 0 and 1, and some of the data are shown below.
A total of 68 countries have predicted values greater than 0.6, so only 68 countries are predicted to win the award.
Table 3. Selected countries' predicted medal tally
FIN | BAH | EST | SGP | MDA | TJK | ALG | KGZ | BOT | ECU | VEN | HKG |
0.17 | 0.2 | 0.2 | 0.2 | 0.21 | 0.22 | 0.26 | 0.26 | 0.28 | 0.28 | 0.29 | 0.32 |
4.3. The regression forecasting
For the predicted winning country, we further predict the number of gold medals and total medals for this country by using the Random Forest regression model.
The target variables are selected as the number of gold medals and the total number of medals.
Formula:
\( Gold prediction=f(FEATURES)where f is the regression model \) (3)
\( Total prediction=g(FEATURES)where g is the regression model \) (4)
Some of Gold's predicted results:
Table 4. Selected countries' predicted gold medals
AUS | JPN | FRA | GBR | CHN | USA |
25 | 22 | 15 | 12 | 42 | 48 |
Selected predicted results for overall medals:
Table 5. Top 8 countries in medal tally
United States | 135 |
China | 94 |
Japan | 52 |
Australia | 50 |
France | 58 |
Netherlands | 30 |
Great Britain | 59 |
South Korea | 34 |
In addition to quantify the uncertainty of the model, we use quantile regression to give the required prediction intervals, we use different quantiles for prediction, selecting the number of gold medals and the total number of medals for the 10%, 50%, and 90% quantiles as a way of providing prediction intervals that reflect the uncertainty in the predicted results.
Formula:
\( the gold prediction level=[{gold_{0.1}}, {gold_{0.9}}] \) (5)
\( the total prediction level=[{total_{0.1}},{total_{0.9}}] \) (6)
4.4. National awards
Change in number of gold medals for participating countries = 2028 gold medals - 2024 gold medals.
Change in total number of medals for participating countries = total number of medals in 2028 - total number of medals in 2024.
For change in gold medals:
If the change in the number of gold medals for participating countries is > 0, then the performance of that country in terms of winning gold medals at the 2028 Olympic Games will become better, i.e. the situation will improve.
If the change in the number of gold medals for a participating country is <0, the country's performance in winning gold medals at the 2028 Olympic Games will become worse, i.e. the situation will be worse.
For a change in the total number of medals (similar to the change in gold medals):
If the change in the total number of medals for a participating country is >0, then the country's performance in winning total medals at the 2028 Olympic Games will become better, i.e., the situation will improve.
If the change in the number of total medals of the participating countries is <0, then the performance of that country in terms of total medals won at the 2028 Olympic Games will become worse, i.e. the situation will be bad.
Analysis of results (this partial medal data was rounded):
Table 6. Rising medal counts for selected countries
NOC | gold2024 | total2024 | goldpred2028 | totalpred2028 | Gold change | Total change |
United States | 40 | 126 | 48 | 140 | 8 | 14 |
China | 40 | 91 | 42 | 94 | 2 | 3 |
Japan | 20 | 45 | 22 | 52 | 2 | 7 |
South Korea | 13 | 32 | 15 | 38 | 2 | 6 |
There is a total of 30 improving countries, and the partial results are shown in the figure.
The total number of countries that have regressed is 29, and some of the results are shown in the figure below.
Table 7. Declining medal counts for selected countries
NOC | gold2024 | Total 2024 | Goldpred 2028 | Totalpred 2028 | Gold change | Total change |
France | 16 | 64 | 14 | 58 | -2 | -6 |
Netherlands | 15 | 34 | 14 | 30 | -1 | -4 |
Great Britain | 14 | 65 | 12 | 59 | -2 | -6 |
Germany | 12 | 33 | 11 | 30 | -1 | -3 |
• Analyze the countries that improved
United States: as the host country for the next edition, the expected growth in the number of gold medals is 8, and the expected growth in the number of medals is 14, and because the United States offers the most specialized baseball program, the growth of the United States is reasonable, and it will continue to be in the leading position in the next edition;
China: gold medals expected to grow by 2, medals expected to grow by 2, and will continue its bonus momentum in 2028;
South Korea: gold medal count expected to grow by 2, medal count expected to grow by 6, will make great progress in 2028;
Japan: expected growth of 2 in the number of gold medals, expected growth of 3 in the number of medals, and will make great progress in 2028.
• Analyze the lagging countries
France: expected decrease in the number of gold medals by 2 and in the number of medals by 6;
Great Britain: expected decrease of 2 in the number of gold medals and 6 in the number of medals;
Germany: expected decrease of 1 in the number of gold medals and 3 in the number of medals;
Netherlands: expected decrease in the number of gold medals by 1 and expected decrease in the number of medals by 4.
The above countries are at risk of decline in the coming 2028.
4.5. Prediction of first-time winning countries (predicting their number)
By using the Random Forest classification model, predict all the countries that will win the 2028 Olympics and filter out the countries that did not win before 2028 to get the countries we need for the first time winners of the 2028 Olympics.
Formula:
\( medal of the first time=\begin{cases} \begin{array}{c} 1 if predicted medal=1 and gold=0 and total=0 \\ 0 otherwise \end{array} \end{cases} \) (7)
4.5.1. Analysis of results
The number of first-time winners was predicted to be 0. The number of medals won by each country in the three Olympic Games studied in this paper has fluctuated little, with the vast majority of winners being countries with a history of winning medals, and only a handful of countries winning for the first time; furthermore, the sample is too small and the number is close to 0, so the number of first-time winners for the 2028 Olympics may still be zero.
4.6. Interaction effects between events, number of medals and hosts
The data was first processed in a consolidated manner by collating the number of medals won by each country in each sport in each edition and calculating the difference in the number of each specific sport between the two Olympic Games, for example the change in 2026 compared to the 2024 Games.
4.6.1. Correlation between number of events and medals
This paper first explores the correlation between the number of events and medals, using the Pearson correlation coefficient
\( R=\frac{\sum _{i=1}^{n}{(x_{i}}-\bar{x}){(y_{i}}-\bar{y})}{\sqrt[]{\sum _{i=1}^{n}{{(x_{i}}-\bar{x})^{2}}}\sqrt[]{\sum _{i=1}^{n}{{(y_{i}}-\bar{y})^{2}}}} \) (8)
to derive the correlation data, if:
The closer the absolute value of R is to 1, the stronger the correlation is;
The closer the absolute value of R is to 0, the weaker the correlation is or there is a non-linear correlation.
Analysis of results: correlation between the change in the number of events and the number of medals from 2016-2024: 0.03
Correlation between the change in the number of programs and the number of medals in 2020-2024: 0.02
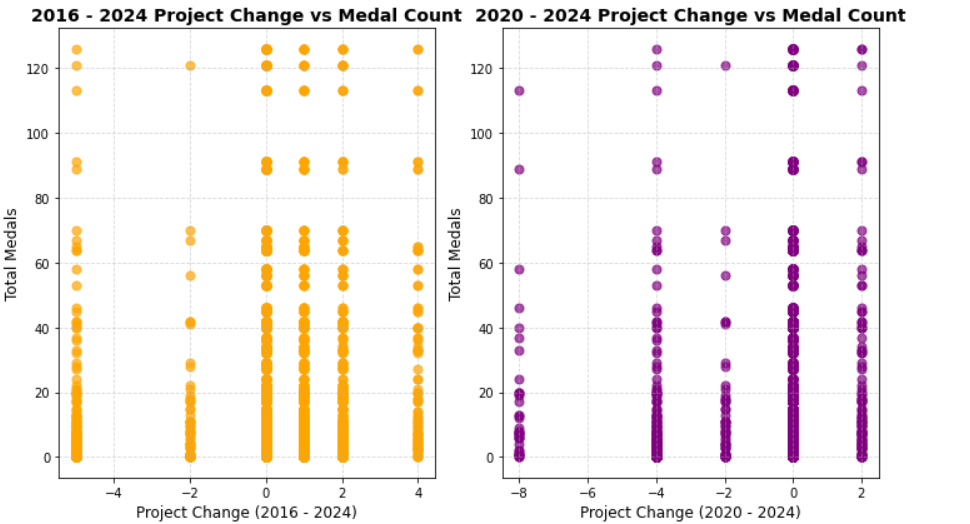
Figure 5. Correlation analysis table
Thus, we went to look at the scatterplot to see if there is a non-linear correlation, and found that in the scatterplot, the data is mostly in a uniform distribution with no distinctive features, and thus we concluded that there is no correlation between the change in the number of items and the number of medals.
4.6.2. Differences between host and non-host countries
Secondly, we in order to quantify the difference between host and non-host countries, for each item we use the average of the two types of countries to compare the difference between the two, in order to better grasp the host country in which items are more advantageous.
\( ∆N=\frac{\sum _{i∈Host}Total-{medal_{i}}}{Host number}-\frac{\sum _{i∈non-Host}Total-{medal_{i}}}{non-Host number} \) (9)
From the formula we can get the following figure, we find that the host country and non-host country in the number of medals in the difference between the host country and non-host country is large, the host country nearly almost higher than the non-host country 300% times the number of prizes, we feel that this is reasonable, the
Reason 1: Since the host country has a certain say and influence in prescribing the program, it can go ahead and prescribe the program in favor of the host country according to the national situation;
Reason 2: For the selection of the host country, every year the Olympic Games organizer countries are selected, there is a certain international status and economic strength, thus they can arrange better resources to their players.
Hierarchical Clustering [3]
After analyzing the reason one, we prefer to explore the host country about the significant difference between different projects, thus we adopt the method of Hierarchical Clustering to portray this difference, compared with the traditional K-means Clustering and K++ Clustering algorithms, the user does not need to declare the number of clusters to be generated in advance, but rather, through the elbow rule, the optimal number of clusters is roughly estimated by graphs and secondly, it is less sensitive to the initial value and the isolation point, more stable and less sensitive to the initial value and isolation point. less sensitive to initial values and isolated points, and more stable and efficient.
Based on the above analysis, we carried out systematic clustering from the top 12 countries with medal counts, and classified the same characteristic advantageous items into the same category.
From the internal point of view of the countries: the advantages of each project are uneven, indicating that many countries have their own excellent projects, but there are still weak related projects, when the host country for these projects to add, then the countries about the weak project will not achieve a good ranking;
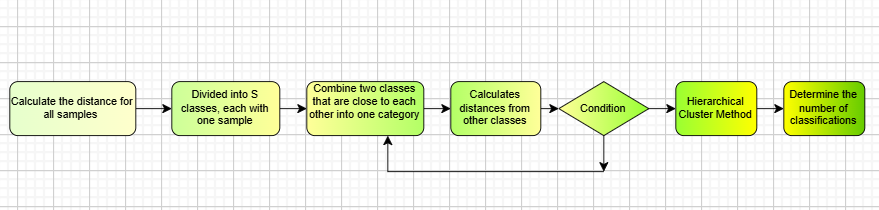
Figure 6. Cluster analysis flowchart
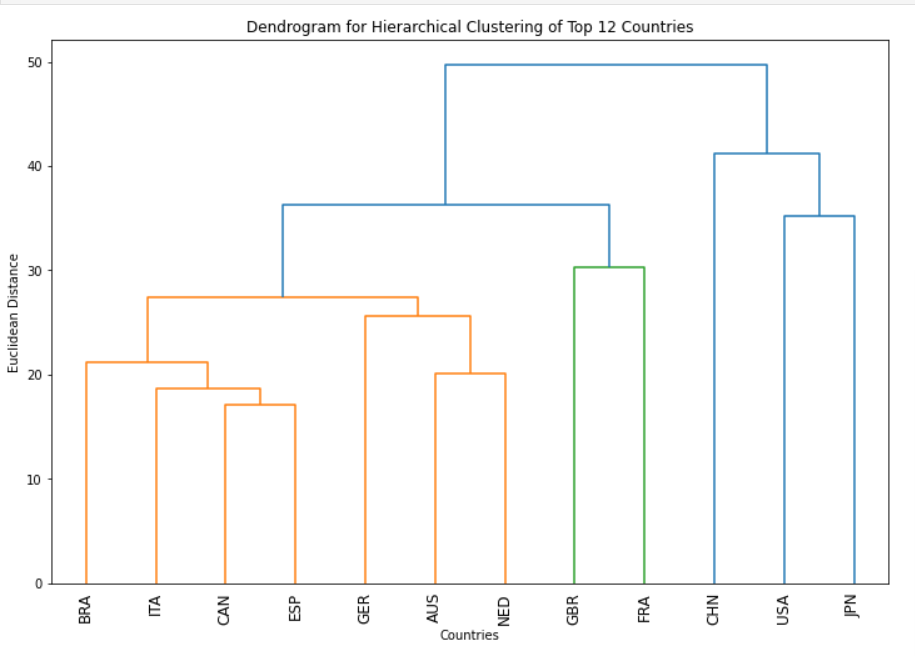
Figure 7. Dendrogram for hierarchical clustering of top 12 countries
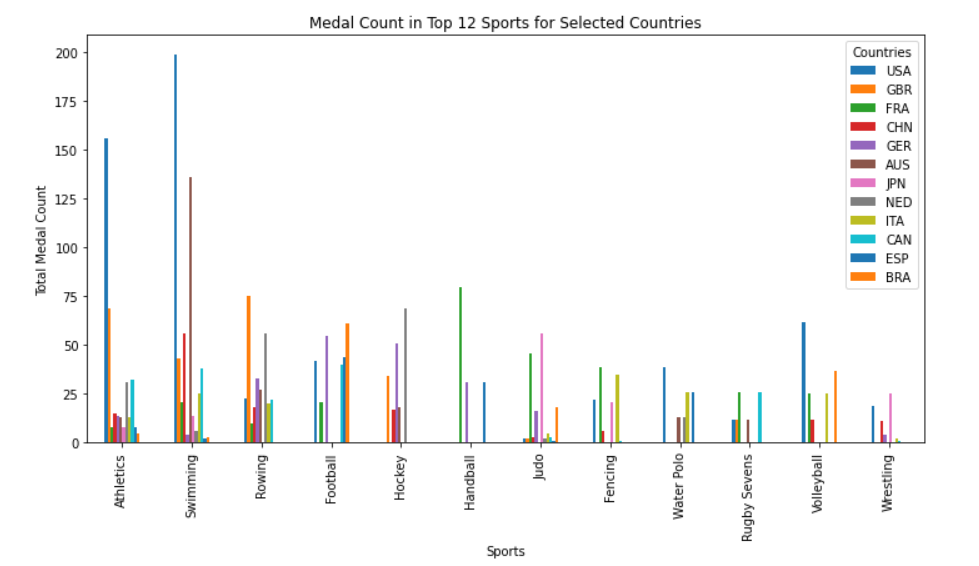
Figure 8. Medal count in top 12 sports for selected countries
From the country before: each country's advantageous programs are different, for example, USA in Athletics and Swimming expressed a significant advantage, if USA as the host country can increase the number of programs in this category, in order to the next Olympic Games, the existence of a greater advantage;
4.6.3. Host country's contribution in a particular sport
Based on the previous analysis, we go to explore the relationship between host programs and awards, and from this we derive the percentage contribution of the host country and non-host country in a particular program
For Olympic Games that are hosted by the host country, a correlation analysis is done between the amount of change in the program and the amount of change in the medals to see if the host country boosts the number of medals in a particular program.
The correlation results found:
Table 8. The correlation results of the sports
Cycling | 8.03E-18 |
Canoeing | -1.54E-08 |
Basketball | 2.176269E-18 |
• All of them are uncorrelated, indicating that the linear correlation between the change of items and the number of medals is weak, and the amount of change of items is not a determinant of the number of medals.
• The graph shows that there is still a clear difference between host and non-host countries in terms of programs, and generally speaking for most programs the overall level of the host country is higher than that of the non-host country, and these will form a guiding new strategy for future Olympic Games.
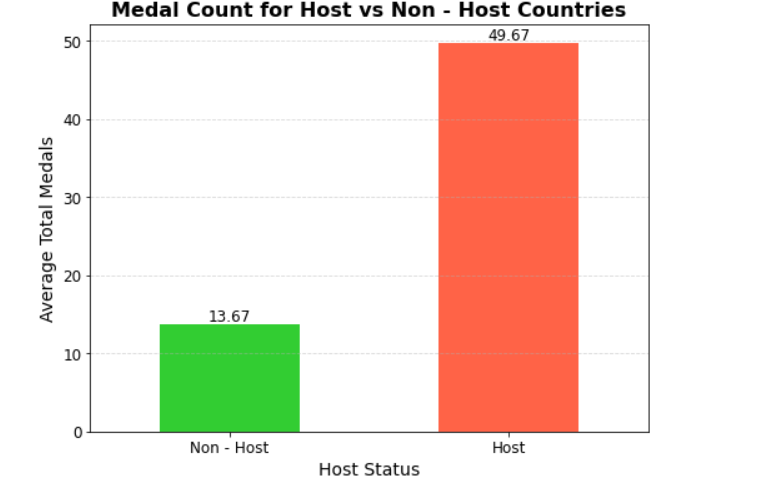
Figure 9. Medal count for host vs non-host countries
5. Exciting coaching
5.1. Analysis and processing of data
For the data we used all the gold, silver and bronze medals as well as the total number of medals in each sport for each country in each Olympics.
Therefore, we constructed a weighted score model based on gold, silver and bronze medals to make an indicator for quantitatively assessing the country's excellence in a particular sport at a particular Olympics.
\( {Score_{t}}=W×{N_{t}} \) (10)
\( W=({w_{1}},{w_{2}},{w_{2}}) \) : Represents the weights corresponding to the corresponding gold, silver and bronze medals, which are specified as constants in this paper \( W=(3, 1, 0.5) \) ,We believe that the gold medalist carries more weight than the gold medal itself, because he has reached a ceiling and his strength does not stop at the gold medal.
\( {N_{t}}=({n_{tgold}},{n_{tsilver}},{n_{tbronze}})\underset{x∈R}{max} \) represents the actual number of gold and silver medals corresponding to a particular event at a particular session.
5.2. Bayesian online change point detection
In this problem, we wanted to investigate the intrinsic link between a coach and a medal, i.e., to monitor whether an “exciting” coach has a significant positive impact on the number of medals won by a country. We then hypothesized that when something is not externally influenced, it always tends to be relatively stable, but after a shocking event, the quantity of the correlation qualitatively jumps (or falls as never before), and the number of medals won by the country is significantly affected by the coach.
leaps (or unprecedented falls), but it is difficult to detect the corresponding changes with the help of general models, and this paper is based on this principle, citing Adam and MacKay’s Bayesian Online Changepoint Detection [4], whose advantage is precisely that it solves this problem well: we are able to quantify our uncertainty in a natural way and update our beliefs about unknown quantities based on incoming data.
The standard Bayesian approach to change point detection is to estimate the posterior distribution of the length of the current state run. Essentially, we want to know how long it has been since the last change point based on observations up to that point.
Based on the requirements in the question, we want to address the following two points in this problem:
For what period of time did a program in a particular country have a significant “great coaching” effect;
How to quantitatively assess the impact of an “exciting” coach.
Modeling:
For a time series \( {Score_{t}}(t=1, 2, 3…T) \) ,we have to find Bayesian online change point detection \( M \) , and then the corresponding time \( {t_{i}}(i=1, 2, 3…M) \) respectively, divides the data sequence into segments and assumes that the data within each segment follows a normal distribution. By calculating the posterior probabilities of the different segmentation schemes, the most likely segmentation can be determined to locate the change point. The advantage of this approach is that it can handle uncertainty and noise and can provide confidence in the existence of the change point.
For the \( t \) moment \( {Score_{t}} \) the mean and variance of its normal distribution change with change. At the first interval, the mean and variance of the corresponding normal distribution are distributed as \( {μ_{m}}, {σ_{m}} \) .
\( {Score_{t}}~N({μ_{m}} {σ_{m}}), t∈[{t_{m-1}} {t_{m}}] \) (11)
Then, according to Bayesian Inference, there is a Bayesian formula to get
\( P({t_{m}} | Score)=\frac{P({t_{m}}, Score)}{P(Score)}=\frac{P({t_{m}})P(Score | {t_{m}})}{P(Score)} \) (12)
\( P(Score |{t_{m}}) \) is the likelihood function about \( {t_{m}} \)
\( P(Score) \) is the marginal likelihood probability, we use Monte Carlo to estimate the
\( P({t_{m}}) \) is the prior distribution of \( {t_{m}} \) . We assume that the premise of not being subject to external influences has been a steady state of.
\( P({t_{m}})=\frac{1}{T} \) (13)
After finding the effect point, then the contribution margin of the quantitative team coach can be constructed at \( {t_{m}} \) . At the effect point, the score function should be \( {Score_{tm}} \) , before the effect point \( {Score_{tm-1}} \) , then the contribution rate.
\( Contribution-rate=\frac{{Score_{tm}}- {Score_{tm-1}}}{{Score_{tm-1}}} \) (14)
The role of the coach in influencing the program can then be obtained.
5.3. Case study
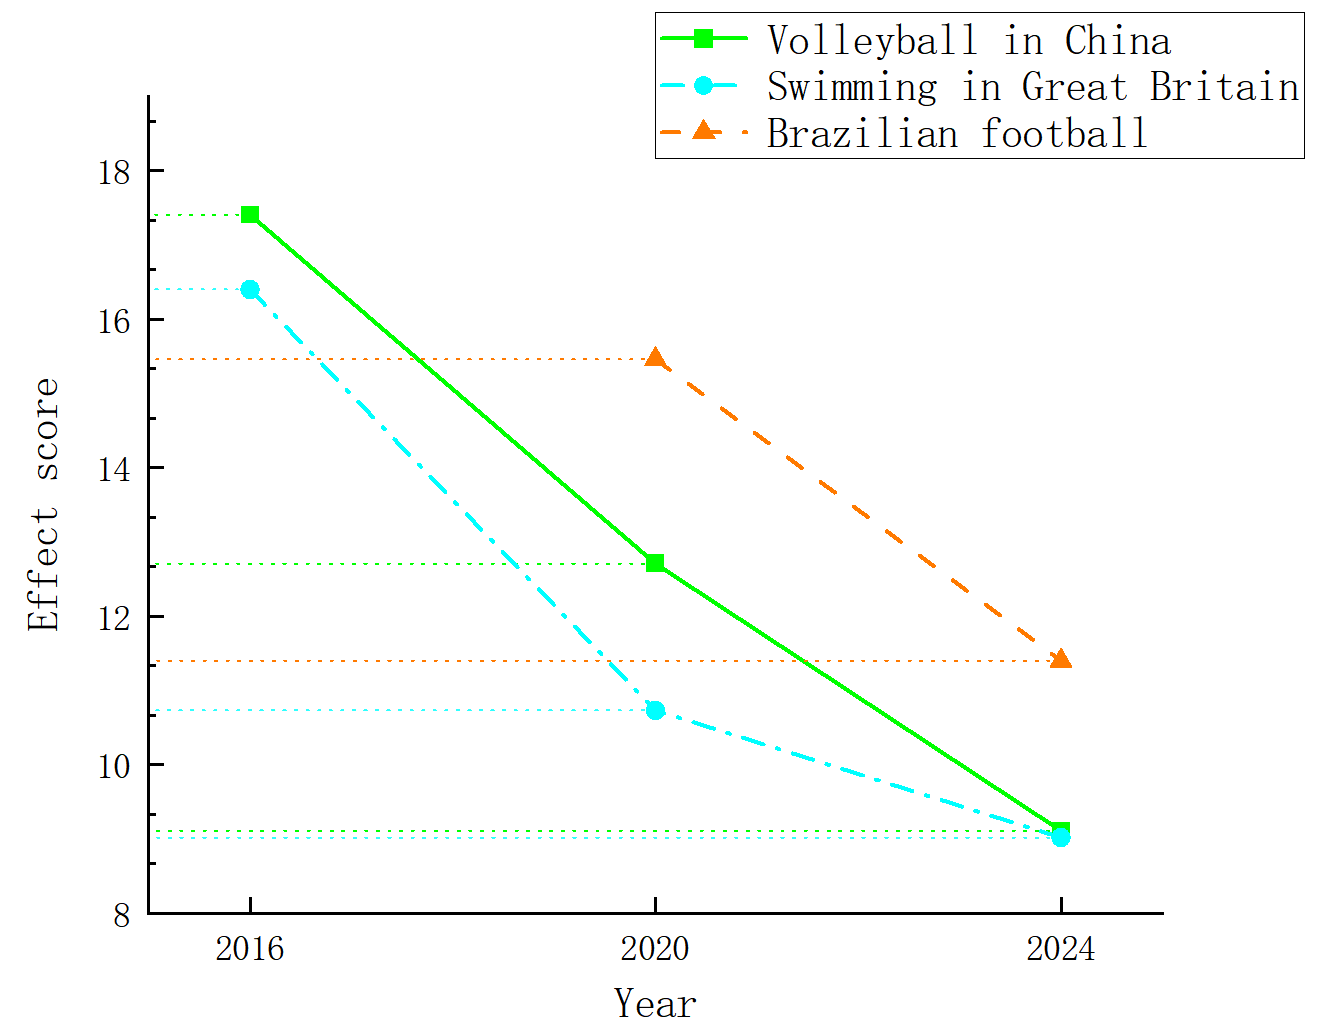
Figure 10. The influence of different sports played in different countries
5.3.1. Interpretation of result
Table 9. The contribution rate of different sports played in different countries
Country | ConRate |
Volleyball in China | 0.73 |
Swimming in Great Britain | 10.29 |
Brazilian football | 4.05 |
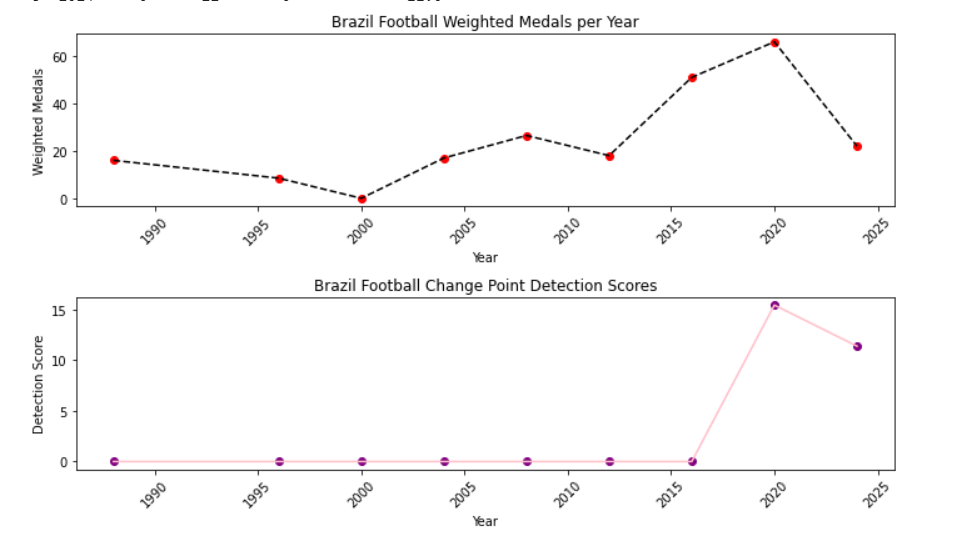
Figure 11. Brazil football change point detection score
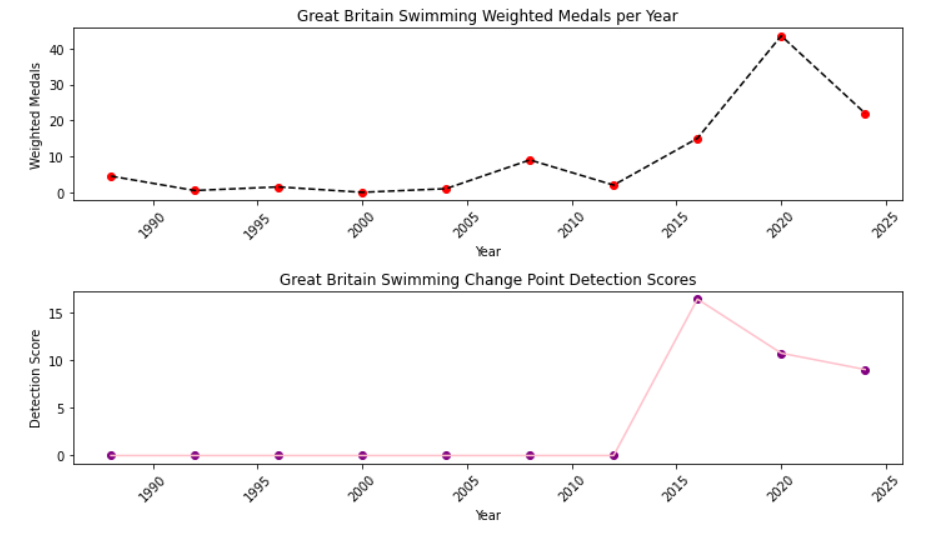
Figure 12. Great Britain change point detection score
It is not difficult to find that all three countries generated monitoring points, and each country experienced significant changes before and after the corresponding points. For example, for China, Lang Ping has been the head coach of Chinese volleyball for three consecutive terms since 2016, from which we can infer that Lang Ping as a coaching effect is significant. For Britain's head swimming coach, before 2016 Britain's former head coach Dennis Pugsley, the main responsibility is to work with training centers and swimming coaches around the world, rather than directly training athletes, but since the 2016 session, Furniss took office after the 2016 Olympic Games, the 2016 Olympic Games won 1 gold and 5 silver. For Brazil's soccer head coach, some data show that Brazil in for soccer's head coach turnover is particularly fast, which leads to many Brazilian coaches are internationally more excellent coach is going to have a certain coaching effect.
In this paper, Bayesian online change-point monitoring is conducted for Chinese volleyball, British swimming and Brazilian soccer, and the possible contribution rates at the change points are obtained.
6. Other insights about medals obtained
6.1. The host country effect has a significant impact on medals
The host country effect refers to the fact that the host country tends to achieve better medal results in major sporting events such as the Olympics than in non-hosting periods, and this effect has a significant impact on medal winning, as shown below and for the following reasons:
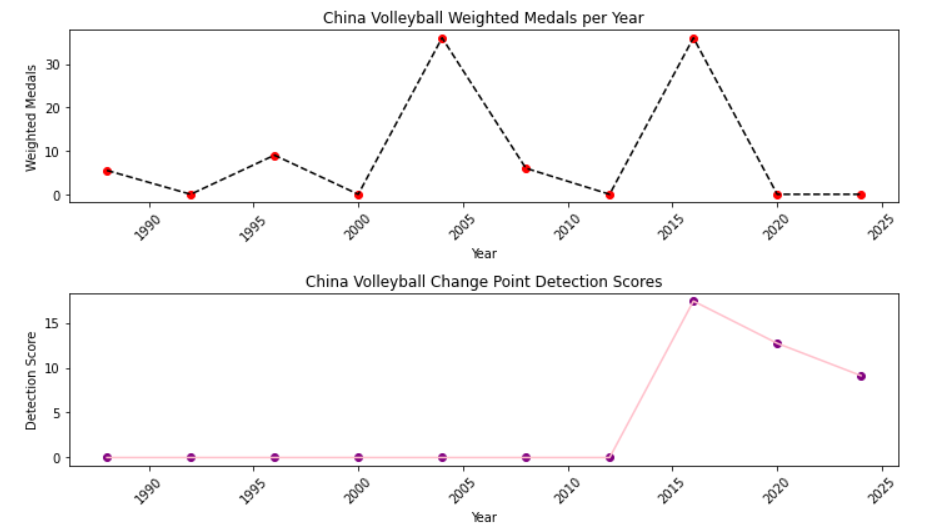
Figure 13. China change point detection score
6.1.1. Performance
Historical data shows that the host country's medal counts and rankings at the Olympic Games have often improved dramatically. Take the 2008 Beijing Olympics as an example, China won 51 gold medals and 100 medals, topping the list in terms of gold medals, which is a significant improvement compared with the previous and subsequent Olympics; in the 2016 Rio Olympics, host country Brazil won 7 gold medals and 26 medals, ranking 13th, which is also its better performance in recent Olympics.
6.1.2. Reasons
Home field advantage: Host athletes competing in a familiar environment can reduce the pressure and discomfort of playing away from home, making it easier for them to perform at their best. At the same time, the support of a large number of spectators from their home country can also boost the morale and motivation of the athletes.
Tilted resource investment: In order to achieve excellent results in the locally organized Olympic Games, the host country will increase investment in sports personnel training, training facilities construction, scientific research support, etc., which will help to improve the competitive level of its athletes.
Advantage of participating programs: To a certain extent, the host country has a certain say in the setting of Olympic programs, and may promote some of its dominant programs to enter the Olympic Games, or make adjustments to the rules of the competition to make them more conducive to the performance of its athletes.
Influence of national economic strength on medals
Take the 2020 Olympic Games as an example. The GDP (2020) of the 15 countries with the most medals in the 2020 Olympics accounts for 68.65% of the world total, and the total number of gold, silver, bronze and medals account for 69.41%, 63.02%, 58.96% and 64.81% of the total number of medals awarded at this Olympics, respectively. Of the top 15 countries in terms of medals, all 12 are developed countries, except China, Russia and Brazil (BRICS members) and Hungary.
6.1.3. Reference opinion
6.1.3.1. Based on host country effects
Feedback from venues and facilities: In the process of building and using Olympic venues and facilities, hosts are able to learn about the adaptability of different venues for different sports, the strengths and weaknesses of the facilities, and so on. For example, in the 2008 Beijing Olympic Games, the actual use of the “Bird's Nest” and “Water Cube” venues, including their spatial layout and equipment operation, can provide information for other NOCs to plan and build venues for future Olympic Games or large-scale sports events. This information will provide reference for other NOCs in their planning and construction of venues for future Olympic Games or large-scale sports events, so that they can better meet the needs of athletes and events when designing and constructing venues.
Logistical experience: The host's experience and feedback on logistical support during the event, such as the management of the Athletes' Village, catering, transportation arrangements, etc., can serve as a reference for other NOCs. For example, in the case of the Tokyo 2020 Olympic Games, there were some problems with the accommodation and catering arrangements in the Athletes' Village, from which other NOCs can learn lessons to better optimize the logistical support system when hosting future events and to provide athletes with a more comfortable and convenient living and training environment.
6.1.3.2. Resource Input Reference
Influence on medals based on economic strength
Funding allocation basis: Generally speaking, countries with stronger economic power tend to be able to invest more money in sports, including athlete training, training facilities construction, scientific research support and other aspects.
Facility construction standards: Countries with strong economic strength can build more advanced and professional sports training facilities, for example, Australia has built a high-performance aquatic center for athletes of aquatic sports. This provides a standard and direction for other NOCs to understand the importance of good training facilities for athletes' performance, and to build and upgrade sports facilities according to their own economic conditions to create better training conditions for athletes.
7. Strengths the weakness
7.1. Advantages
In this paper, we use Random Forest, Logistic Regression and XGBoost for Machine learning, and compare them with each other, and use the best fitting Random Forest as the prediction algorithm for our regression model and classification model, which fully illustrates the rigor of our model.
In this paper, we use the Random Forest model, compared with other algorithms, to deal with big data, can better prevent the phenomenon of overfitting, has a very good robustness, improves the stability of the model and generalization ability.
In this paper, in order to unify the full name of the country with the abbreviation, we built a conversion table, which can better modify the variable name, and it is convenient for us to go to the data processing.
In this paper, for the distribution of medals of each country in each project, we carried out a cluster analysis, using Systematic Clustering to classify countries with the same “preferred projects”. Compared with traditional clustering methods, we do not need to declare the number of clusters in advance, which reduces the subjective judgment of individuals.
In this paper, we use a combination of Bayesian point monitoring and Bayesian inference to get a better result based on historical experience.
7.2. Weaknesses
1. Using the Random Forest regression model for forecasting requires taking into account all the countries, targeting all the countries, measuring the overall accuracy, and sometimes some individuals have to be discarded in order to take care of the whole. As a result, the error of individual countries is large, especially for some powerful countries such as the United States, China and other countries ranked very high, the deviation between the predicted and actual value of the medal will be larger.
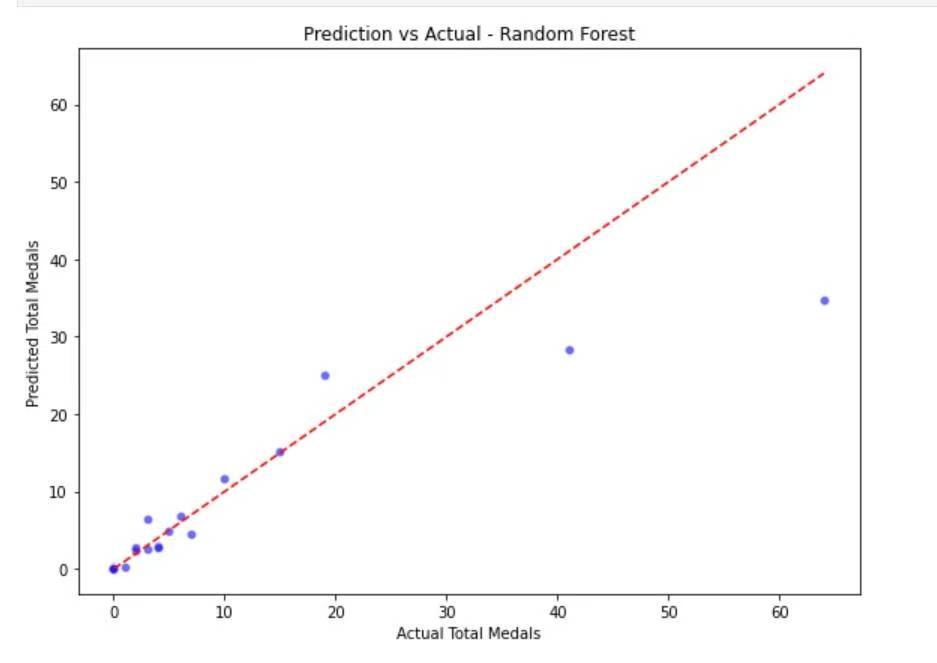
Figure 14. Predicted vs. actual scatter plot - Random Forest
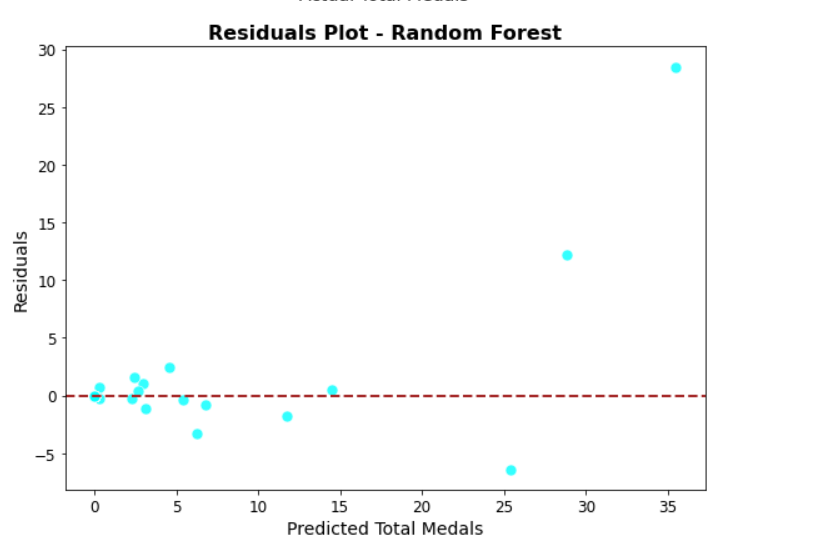
Figure 15. Residual plot - Random Forest
As shown in the figure: the prediction of most countries' awards basically matches the actual awards, but there are a very small number of data points with large residuals.
2. Although the Random Forest model has a certain degree of resistance to overfitting, when dealing with the complex problem of Olympic medal prediction, because of the presence of some special noise or anomalies in the data, as well as the reasonableness of the choice of the model parameters, the phenomenon of overfitting may still occur, resulting in the poor performance of the model on the test data.
References
[1]. Wikipedia contributors. (n.d.). Machine learning. In Wikipedia. Retrieved January 27, 2025, from https://en.wikipedia.org/wiki/Machine_learning
[2]. Sruthi, E. R. (2024). Understanding random forest algorithm with examples. Analytics Vidhya.
[3]. Omarzai, F. (2024). XGBoost regression in depth. Medium. https://medium.com/@fraidoonomarzai99/xgboost-regression-in-depth-cb2b3f623281
[4]. Wikipedia contributors. (n.d.). Hierarchical clustering. In Wikipedia. Retrieved November 11, 2024, from https://en.wikipedia.org/wiki/Hierarchical_clustering
[5]. Adams, R. P., & MacKay, D. J. C. (2007). Bayesian online changepoint detection [arXiv:0710.3742]. arXiv. https://doi.org/10.48550/arXiv.0710.3742
Cite this article
Liu,H. (2025). Medal prediction model based on machine learning and Bayes. Advances in Operation Research and Production Management,4(1),23-40.
Data availability
The datasets used and/or analyzed during the current study will be available from the authors upon reasonable request.
Disclaimer/Publisher's Note
The statements, opinions and data contained in all publications are solely those of the individual author(s) and contributor(s) and not of EWA Publishing and/or the editor(s). EWA Publishing and/or the editor(s) disclaim responsibility for any injury to people or property resulting from any ideas, methods, instructions or products referred to in the content.
About volume
Journal:Advances in Operation Research and Production Management
© 2024 by the author(s). Licensee EWA Publishing, Oxford, UK. This article is an open access article distributed under the terms and
conditions of the Creative Commons Attribution (CC BY) license. Authors who
publish this series agree to the following terms:
1. Authors retain copyright and grant the series right of first publication with the work simultaneously licensed under a Creative Commons
Attribution License that allows others to share the work with an acknowledgment of the work's authorship and initial publication in this
series.
2. Authors are able to enter into separate, additional contractual arrangements for the non-exclusive distribution of the series's published
version of the work (e.g., post it to an institutional repository or publish it in a book), with an acknowledgment of its initial
publication in this series.
3. Authors are permitted and encouraged to post their work online (e.g., in institutional repositories or on their website) prior to and
during the submission process, as it can lead to productive exchanges, as well as earlier and greater citation of published work (See
Open access policy for details).
References
[1]. Wikipedia contributors. (n.d.). Machine learning. In Wikipedia. Retrieved January 27, 2025, from https://en.wikipedia.org/wiki/Machine_learning
[2]. Sruthi, E. R. (2024). Understanding random forest algorithm with examples. Analytics Vidhya.
[3]. Omarzai, F. (2024). XGBoost regression in depth. Medium. https://medium.com/@fraidoonomarzai99/xgboost-regression-in-depth-cb2b3f623281
[4]. Wikipedia contributors. (n.d.). Hierarchical clustering. In Wikipedia. Retrieved November 11, 2024, from https://en.wikipedia.org/wiki/Hierarchical_clustering
[5]. Adams, R. P., & MacKay, D. J. C. (2007). Bayesian online changepoint detection [arXiv:0710.3742]. arXiv. https://doi.org/10.48550/arXiv.0710.3742