


1. Research status
1.1. Research on Fuzzy Analytic Hierarchy Process (FAHP) in China and abroad
The evaluation of financial risks for enterprises requires a combination of qualitative and quantitative indicators to provide more valuable results for financial risk assessment. Duan [1] divides the financial risk evaluation system into qualitative evaluation, quantitative evaluation, and comprehensive evaluation. Liao [2] pointed out that the Fuzzy Analytic Hierarchy Process (FAHP) integrates fuzzy mathematics theory and analytic hierarchy process, using triangular fuzzy numbers to generate fuzzy sets, thereby enhancing data processing capabilities. Cebi Selcuk [3] reduced the inconsistency of expert judgments through the decomposition of fuzzy sets (DFS), making pairwise comparisons in AHP more reliable. Liu [4] employed FAHP to evaluate enterprise performance, optimizing the indicator system and weight calculations to improve evaluation accuracy. Nguyen Thi Anh Van [5] applied the analytic hierarchy process to assign weights to each factor and indicator in the indicator system. Al Fozaie Mohammad Tariq and Wahid Hairunnizam [6] reduced the subjectivity of expert weights in FAHP by calculating fuzzy weights, thus addressing the problem of selecting the weight system.
1.2. Research on the factors influencing enterprise financial risk
Liu and Li [7] argued that financial risk evaluation for enterprises should integrate both financial and non-financial information. Liu, Li, and Wen [8] suggested that the goal level in the evaluation system can be divided into four financial indicators: solvency, operating ability, profitability, and growth ability, and their corresponding sub-indicators form the evaluation system plan. Zhu and Mei [9] added the indicator of cash flow ability to the enterprise financial risk evaluation system based on the aforementioned financial risk indicators. Li [10] subdivided the operating ability indicator in the evaluation system into accounts receivable turnover, inventory turnover, current asset turnover, and total asset turnover. Li and Zhu [11] further divided the profitability indicator into capital return rate, total asset return rate, and sales profit margin. Guo and Li [12] subdivided the development ability indicator into total asset growth rate, net asset growth rate, and fixed income growth rate, among others.
2. Research significance
2.1. Theoretical significance
The FAHP, combining fuzzy mathematics and analytic hierarchy process, overcomes the shortcomings of the DuPont analysis in terms of indicators and the strong subjectivity of weights in the Walford scoring method. It has been widely applied in financial risk evaluation. Its core idea is to establish a hierarchical decision structure and perform a comprehensive evaluation through weight calculation, ensuring that the evaluation results are more reasonable. This study selects BYD Co., Ltd. (Company A) as the object of study, constructs a financial risk evaluation system, and analyzes solvency, profitability, asset operation ability, development ability, cash flow ability, and non-financial factors. Through a vertical analysis of BYD’s financial trends and a horizontal comparison with peer companies, this study aims to provide reference value for the new energy vehicle industry.
2.2. Practical significance
This study selects BYD Co., Ltd. (Company A) as the object of study, constructs a financial risk evaluation system, and analyzes solvency, profitability, asset operation ability, development ability, cash flow ability, and non-financial factors. Through a vertical analysis of BYD’s financial trends and a horizontal comparison with peer companies, this study aims to provide reference value for the new energy vehicle industry.
3. Financial risk evaluation indicator system
3.1. Drawing on the hierarchical structure
To ensure the accuracy and reliability of financial risk evaluation results, the financial risk evaluation model must present a progressive hierarchical structure. The first step is to establish the goal layer (A) for financial risk evaluation, with the overall objective being the evaluation of the enterprise's financial risk. This overall goal layer (A) is then broken down into two sub-goal layers: quantitative financial indicators (B1) and qualitative non-financial indicators (B2). On the basis of comprehensively considering various financial and non-financial influencing factors, and referring to the classification of related financial indicators from the Guotai An database, 23 specific financial indicators are selected to form the plan layer of the financial risk evaluation indicator system. The financial risk evaluation indicator system is shown in Figure 1.
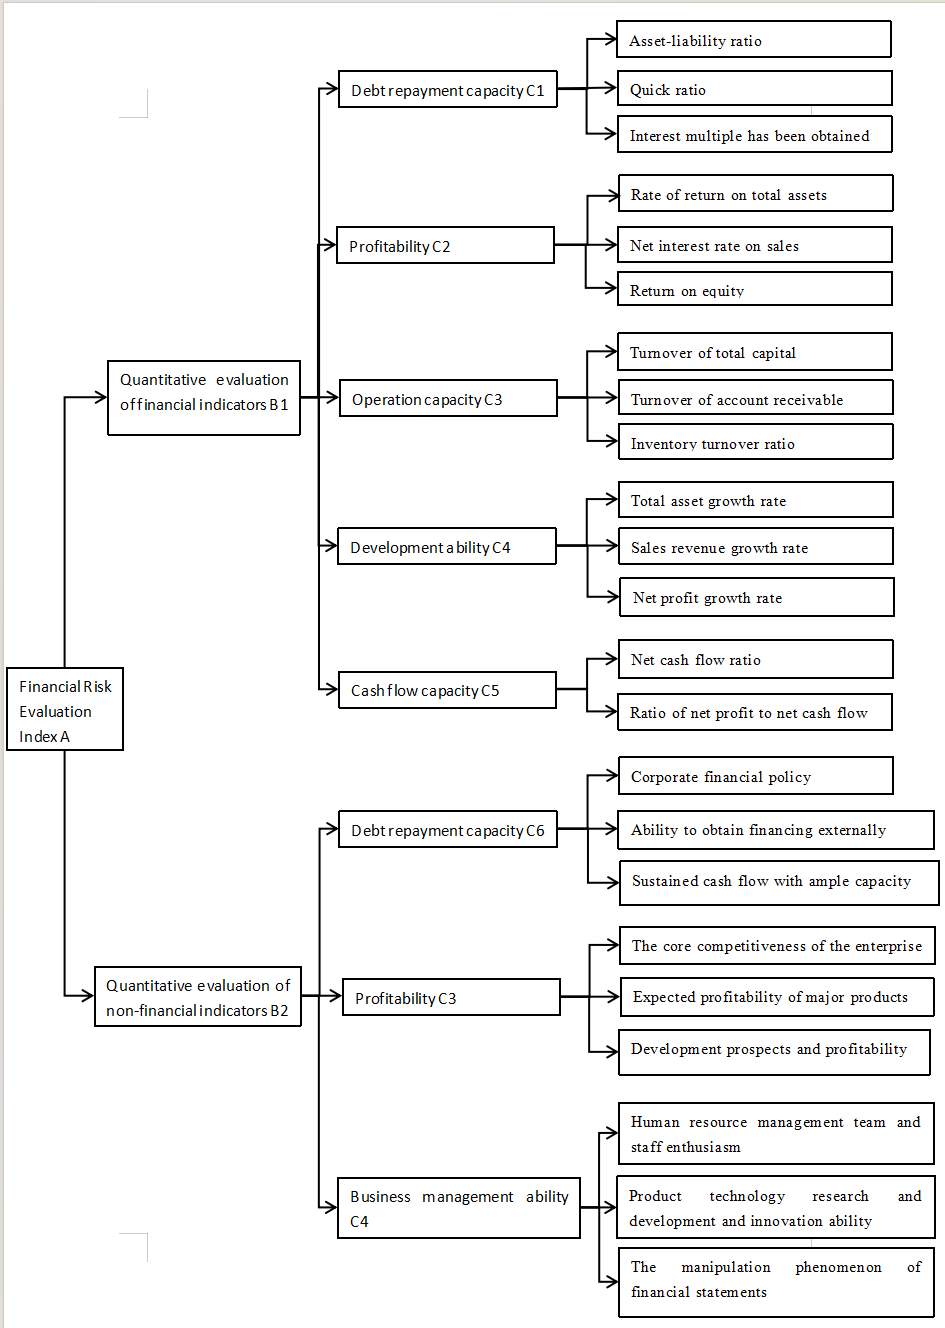
Figure 1. Financial risk evaluation index system
3.2. Referencing pairwise comparison judgment matrix
The expert group for the evaluation consists of relevant enterprise management personnel, department heads, financial professionals, regulatory experts, and accountants from accounting firms. The members of the expert group, based on the relative importance of the pairwise comparison of indicators, use a 1-9 scale method in the Analytic Hierarchy Process (AHP) to quantify the importance of different indicators, thus generating a quantitative judgment matrix. Then, by integrating the opinions of the various evaluators, the values for the elements of the judgment matrix are determined. After confirming the values for the elements of the judgment matrix, the weights for the evaluation indicators are calculated. The judgment matrix and weights for the sub-goal layer (B1) are shown in Table 1. Similarly, the judgment matrix and weights for other indicators can be obtained [2].
Table 1. Judgment matrix and weight of sub-level indicators of financial indicators (B1)
Indicator | Debt paying ability | Profitability | Operation capacity | Development ability | Cash flow ability |
Debt paying ability | 1 | 1 | 2 | 2 | 2 |
Profitability | 1 | 1 | 2 | 2 | 2 |
Operation capacity | 1/2 | 1/2 | 1 | 1 | 1 |
Development ability | 1/2 | 1/2 | 1 | 1 | 1 |
Cash flow ability | 1/2 | 1/2 | 1 | 1 | 1 |
Weight | 0.2857 | 0.2857 | 0.1429 | 0.1429 | 0.1429 |
3.3. Selection of weighted weights for each layer and indicator
The financial risk evaluation indicator system is divided from top to bottom into four levels: goal layer (A), sub-goal layer (B), criterion layer (C), and plan layer (D). The sub-goal layer (B) is further divided into quantitative financial indicators (B1) and qualitative non-financial indicators (B2), with weights Y1 and Y2, respectively. Referencing the research by Cao and Li in "Research on the Weight Design Between Quantitative and Qualitative Indicators in Credit Rating," the weight for the quantitative indicators is set as Y1 = 0.7 and for the qualitative indicators as Y2 = 0.3. The weights for each specific evaluation indicator, calculated using the Analytic Hierarchy Process, are multiplied by the weight of the indicator in the previous layer, and then multiplied by 100 for rounding. The results are shown in Table 2.
Table 2. Weighted weight of the evaluation indicators
Sub-goal | Evaluation criterion | Weighted factor | Evaluating indicator | Weighted factor |
Financial indicators(70) | Debt paying ability | 20 | Asset-liability ratio | 6.176 |
Quick ratio | 3.236 | |||
Interest multiple has been obtained | 10.588 | |||
Profitability | 20 | Rate of return on total assets | 3.236 | |
Net interest rate on sales | 6.176 | |||
Return on equity | 10.588 | |||
Operation capacity | 10 | Turnover of total capital | 5 | |
Turnover of account receivable | 2.5 | |||
Inventory turnover ratio | 2.5 | |||
Development ability | 10 | Total asset growth rate | 2.5 | |
Sales revenue growth rate | 2.5 | |||
Net profit growth rate | 5 | |||
Cash flow ability | 10 | Net cash flow ratio | 5 | |
Ratio of net profit to net cash flow | 5 | |||
Non-financial indicators(30) | Debt paying ability | 12 | Corporate financial policy | 2.4 |
Ability to obtain financing externally | 4.8 | |||
Sustained cash flow with ample capacity | 4.8 | |||
Profitability | 12 | The core competitiveness of the enterprise has | 4 | |
Expected profitability of major products | 4 | |||
Development prospects and profitability | 4 | |||
Operation and management ability | 6 | Human resource management team and staff enthusiasm | 2.4 | |
Product technology research and development and innovation ability | 2.4 | |||
The manipulation phenomenon of financial statements | 1.2 |
3.4. Selection of evaluation criteria
When determining the financial risk status of an enterprise, this study chooses to use the five-color traffic light analysis method. This method clearly identifies the type of financial risk the enterprise is facing. The specific evaluation criteria are shown in Table 3.
Table 3. Five-color signal lamp analysis method
Comprehensive score value | The color system | The risk situation |
W≥90 | Green light | low risk |
75≤W<90 | Yellow light | Lower risk |
60≤W<75 | Blue light | Medium risk |
45≤W<60 | Orange lamp | Higher risk |
W<45 | Red light | High risk |
4. Financial status of BYD over the last three years
Based on the financial risk evaluation indicator system shown in Figure 1, the financial data for BYD from 2020 to 2022 were organized. The initial values for each financial indicator were calculated, and the results are shown in Table 4.
Table 4. Initial value of BYD's financial indicators from 2020 to 2022
Sub-goal | Evaluation criterion | Evaluating indicator | 2022 | 2021 | 2020 |
Financial indicators(70) | Debt paying ability | Asset-liability ratio | 75.42 | 64.76 | 67.94 |
Quick ratio | 0.485 | 0.717 | 0.754 | ||
Interest multiple has been obtained | 17.02 | 3.37 | 3.20 | ||
Profitability | Rate of return on total assets | 4.49 | 1.60 | 3.03 | |
Net interest rate on sales | 4.18 | 1.84 | 3.84 | ||
Return on equity | 16. 14 | 3.73 | 7.43 | ||
Operation capacity | Turnover of total capital | 1.074 | 0.870 | 0.790 | |
Turnover of account receivable | 11.30 | 5.580 | 3.678 | ||
Inventory turnover ratio | 4.869 | 4.244 | 3.644 | ||
Development ability | Total asset growth rate | 66.97 | 47.16 | 2.76 | |
Sales revenue growth rate | 96.25 | 38.02 | 22.59 | ||
Net profit growth rate | 346.43 | -34.04 | 183.81 | ||
Cash flow ability | Net cash flow ratio | 0.422 | 0.382 | 0.426 | |
Ratio of net profit to net cash flow | 0.1257 | 0.0606 | 0.1325 | ||
Non-financial indicators(30) | Debt paying ability | Corporate financial policy | 6.4 | 6.2 | 6.2 |
Ability to obtain financing externally | 8.2 | 7.2 | 7.0 | ||
Sustained cash flow with ample capacity | 9.4 | 9.0 | 8.2 | ||
Profitability | The core competitiveness of the enterprise has | 8.2 | 6.8 | 6.2 | |
Expected profitability of major products | 7.8 | 6.2 | 7.0 | ||
Development prospects and profitability | 9.4 | 6.4 | 7.4 | ||
Operation and management ability | Human resource management team and staff enthusiasm | 7.0 | 6.8 | 6.4 | |
Product technology research and development and innovation ability | 8.0 | 7.8 | 7.0 | ||
The manipulation phenomenon of financial statements | 8.2 | 7.6 | 7.2 |
5. Calculation of BYD's financial risk comprehensive score
5.1. Calculation of standard values for quantitative indicators
The financial risk evaluation result for BYD is composed of the calculated results for both quantitative and qualitative indicators in the financial risk evaluation system. The initial values for BYD's financial risk quantitative indicators were calculated using the 2022 annual report data of BYD from Eastmoney.com. The industry average values for the quantitative indicators were selected from the corresponding indicators of twelve other high-quality new energy vehicle companies in the industry, as shown in Table 5. The standard values for the quantitative indicators were then calculated using the formula (1):
\( Si=\frac{Si}{St}×100\% \) (1)
Where: St represents the industry average value for the financial evaluation indicators, Si represents the initial value of the financial evaluation indicators, Si represents the standard value of the financial evaluation indicators.
Table 5. Initial values of the financial indicators ofthe 13 new energy vehicle enterprises
Evaluating indicator | BYD | GWM | SAIC | Changan | Guangzhou | Seres | FAW Jiefang | JAC Motors | Lifan Technology | Dongfeng | Jiangling | Haima | Shuguang |
Asset-liability ratio | 75.42 | 64.82 | 65.99 | 56.90 | 35.67 | 74.20 | 58.22 | 69.18 | 43.48 | 52.04 | 66.36 | 44.82 | 41.40 |
Quick ratio | 0.485 | 0.890 | 1.003 | 1.198 | 1.404 | 0.786 | 1.027 | 0.958 | 1.106 | 1.419 | 0.899 | 0.743 | 0.738 |
Interest multiple has been obtained | 17.02 | 13.29 | 12.42 | 148.71 | 23.75 | -16.66 | 33.82 | -1.66 | 2.68 | 32.49 | 19.24 | -37.46 | -11.52 |
Rate of return on total assets | 4.49 | 4.58 | 1.82 | 4.92 | 4.65 | -9.44 | 0.58 | -1.80 | 0.89 | 1.57 | 3.21 | -2.70 | -4.50 |
Net interest rate on sales | 4.18 | 6.01 | 3.25 | 8.04 | 7.27 | -15.49 | 0.96 | -3.09 | 1.97 | 2.42 | 2.87 | -12.39 | -14.08 |
Return on equity | 16.14 | 12.66 | 4.57 | 11.71 | 7.93 | -29.64 | 1.50 | -5.29 | 1.51 | 3.52 | 10.28 | -5.45 | -7.77 |
Turnover of total capital | 1.074 | 0.76 | 0.56 | 0.61 | 0.64 | 0.61 | 0.61 | 0.58 | 0.45 | 0.65 | 1.12 | 0.22 | 0.32 |
Turnover of account receivable | 11.30 | 15.30 | 8.845 | 2.901 | 12.50 | 23.60 | 32.67 | 7.766 | 4.461 | 3.087 | 7.430 | 5.907 | 3.382 |
Inventory turnover ratio | 4.869 | 6.049 | 6.194 | 8.348 | 9.934 | 5.337 | 4.486 | 4.805 | 3.446 | 5.894 | 12.58 | 2.055 | 2.851 |
Evaluating indicator | BYD | GWM | SAIC | Changan | Guangzhou | Seres | Jiefang | JAC Motors | Lifan Technology | Dongfeng | Jiangling | Haima | Shuguang |
Total asset growth rate | 66.97 | 5.70 | 5.55 | 6.13 | 23.22 | 36.98 | -18.63 | 4.55 | 3.98 | -11.02 | 4.21 | -5.09 | -14.72 |
Sales revenue growth rate | 96.25 | 0.66 | -4.58 | 7.77 | 45.37 | 101.96 | -61.18 | -10.38 | 117.59 | -21.61 | -14.54 | 47.56 | -30.86 |
Net profit growth rate | 346.43 | 22.72 | -49.50 | 90.48 | 8.21 | -128.15 | -90.57 | -734.35 | 25.55 | -22.87 | 50.28 | -27.09 | 2.29 |
Net cash flow ratio | 0.422 | 0.129 | 0.010 | 0.050 | -0.095 | 0.043 | -0.184 | 0.078 | -0.042 | -0.035 | -0.087 | 0.153 | -0.140 |
Ratio of net profit to net cash flow | 0.1257 | 0.6704 | 3.3608 | 1.8147 | -1.4952 | -2.9924 | -0.0716 | -0.4281 | -0.6681 | -1.0166 | -0.5681 | -0.4236 | 1.0218 |
Corporate financial policy | 6.4 | 6.2 | 6.0 | 6.2 | 6.4 | 5.6 | 6.0 | 6.0 | 5.4 | 6.4 | 6.6 | 4.0 | 6.0 |
Ability to obtain financing externally | 8.2 | 6.0 | 9.0 | 7.4 | 9.2 | 9.2 | 5.8 | 9.0 | 5.8 | 8.8 | 5.6 | 8.0 | 2.8 |
Sustained cash flow with ample capacity | 9.4 | 6.0 | 9.6 | 7.8 | 9.6 | 9.4 | 6.0 | 9.2 | 5.8 | 9.0 | 5.8 | 8.2 | 3.0 |
The core competitiveness of the enterprise has | 8.2 | 6.4 | 4.0 | 8.0 | 8.0 | 5.8 | 3.0 | 3.8 | 7.0 | 4.0 | 3.8 | 3.8 | 2.2 |
Expected profitability of major products | 7.8 | 7.8 | 6.2 | 8.0 | 7.8 | 2.2 | 3.2 | 2.6 | 4.2 | 4.0 | 5.0 | 4.0 | 2.4 |
Development prospects and profitability | 9.4 | 6.2 | 3.8 | 8.2 | 7.8 | 6.0 | 2.8 | 3.8 | 7.6 | 3.2 | 3.6 | 2.4 | 5.0 |
Human resource management team and staff enthusiasm | 7.0 | 6.4 | 4.0 | 6.2 | 6.2 | 5.8 | 6.0 | 6.0 | 5.6 | 6.2 | 6.8 | 4.2 | 5.8 |
Product technology research and development and innovation ability | 8.0 | 6.0 | 4.8 | 7.8 | 8.0 | 6.2 | 2.8 | 3.8 | 7.2 | 3.2 | 3.8 | 2.2 | 6.0 |
The manipulation phenomenon of financial statements | 8.2 | 6.4 | 6.0 | 6.0 | 6.2 | 5.8 | 6.0 | 6.0 | 5.6 | 6.4 | 6.8 | 4.2 | 5.8 |
Data Source: East Money Choice Data
5.2. Calculation of standard values for qualitative indicators
For the qualitative indicators in the financial risk evaluation system, the expert group’s ratings for BYD's financial indicators from Eastmoney.com were referenced. The average rating from the expert group was used as the initial value for each qualitative indicator. The industry average values for these indicators were calculated using the corresponding indicators from twelve other high-quality new energy vehicle companies in the industry. Finally, the standard values for the qualitative indicators in the financial risk evaluation system were calculated using formula (1).
5.3. Calculation of the comprehensive financial risk score
After the above analysis and calculations, the standard values for each financial risk evaluation indicator for BYD in 2022 were obtained. By combining the detailed weighted weights for each indicator from Table 2, the comprehensive financial risk evaluation score for BYD in 2022 can be calculated using formula (2). The calculation result is shown in Table 6.
Comprehensive score:
\( N=\sum _{i=1}^{23}WiRi \) (2)
Where: N represents the comprehensive financial risk score, Ri represents the standard value for each financial risk evaluation indicator, Wi represents the weighted weight for each financial risk evaluation indicator.
Table 6. Comprehensive score of BYD's financial evaluation indicators in 2022
Primary indicators | Score | Secondary indicators | Standard value | Weight | Score |
Debt paying ability | 19.72 | Asset-liability ratio | 134.46 | 6.176 | 8.30 |
Quick ratio | 47.83 | 3.236 | 1.55 | ||
Interest multiple has been obtained | 93.21 | 10.588 | 9.87 | ||
Profitability | 359.68 | Rate of return on total assets | 417 | 3.236 | 13.49 |
Net interest rate on sales | -409.80 | 6.176 | -25.31 | ||
Return on equity | 3,508.70 | 10.588 | 371.50 | ||
Operation capacity | 13.78 | Turnover of total capital | 182.03 | 5 | 9. 1 |
Turnover of account receivable | 106.06 | 2.5 | 2.65 | ||
Inventory turnover ratio | 81.18 | 2.5 | 2.03 | ||
Development ability | 39.36 | Total asset growth rate | 1,963.93 | 2.5 | 49.10 |
Sales revenue growth rate | 649.90 | 2.5 | 16.25 | ||
Net profit growth rate | -519.74 | 5 | -25.99 | ||
Cash flow ability | -213.6 | Net cash flow ratio | -4220 | 5 | -211 |
Ratio of net profit to net cash flow | -189.60 | 5 | -9.48 | ||
Debt paying ability | 14.09 | Corporate financial policy | 108.48 | 2.4 | 2.60 |
Ability to obtain financing externally | 113.89 | 4.8 | 5.47 | ||
Sustained cash flow with ample capacity | 125.33 | 4.8 | 6.02 | ||
Profitability | 20.58 | The core competitiveness of the enterprise has | 164 | 4 | 6.56 |
Expected profitability of major products | 162.5 | 4 | 6.50 | ||
Development prospects and profitability | 188 | 4 | 7.52 | ||
Operation and management ability | 8.26 | Human resource management team and staff enthusiasm | 120.69 | 2.4 | 2.90 |
Product technology research and development and innovation ability | 153.85 | 2.4 | 3.69 | ||
The manipulation phenomenon of financial statements | 138.98 | 1.2 | 1.67 | ||
Comprehensive financial risk score | 261.87 | ||||
Data Source: East Money Choice Data
According to the calculation results shown in Table 6, the comprehensive financial risk evaluation score for BYD in 2022 is 261.87. Referring to the evaluation criteria in the five-color traffic light analysis method (Table 3), it can be concluded that BYD is in the green light zone for financial risk. This indicates that BYD has strong risk resistance ability. Compared to other companies in the new energy vehicle industry, BYD has strong profitability, excellent growth potential, good operating and debt repayment ability, sufficient cash flow, and overall sound financial health. Currently, BYD ranks 2nd out of 23 companies in the new energy vehicle industry. The financial risk assessment results are consistent with the actual status of BYD.
6. Horizontal comparative analysis of BYD’s financial risk evaluation results
6.1. Horizontal comparison of financial indicator data
To visually demonstrate the gap between BYD and the overall average level of the new energy vehicle industry, thirteen high-quality companies, including Great Wall Motors, SAIC Motor Corporation, Changan Automobile, and GAC Group, were selected as comparison subjects. By comparing the average financial and non-financial evaluation indicator data of these companies with BYD's respective data, a comprehensive analysis of BYD's financial risk level was conducted.
6.1.1. Comparison of Financial Evaluation Indicators
The financial risk evaluation indicators in the system were compared between BYD’s values and the corresponding average values of other high-quality companies in the new energy vehicle industry. A radar chart was used to visually reflect the differences between them, as shown in Figure 2.
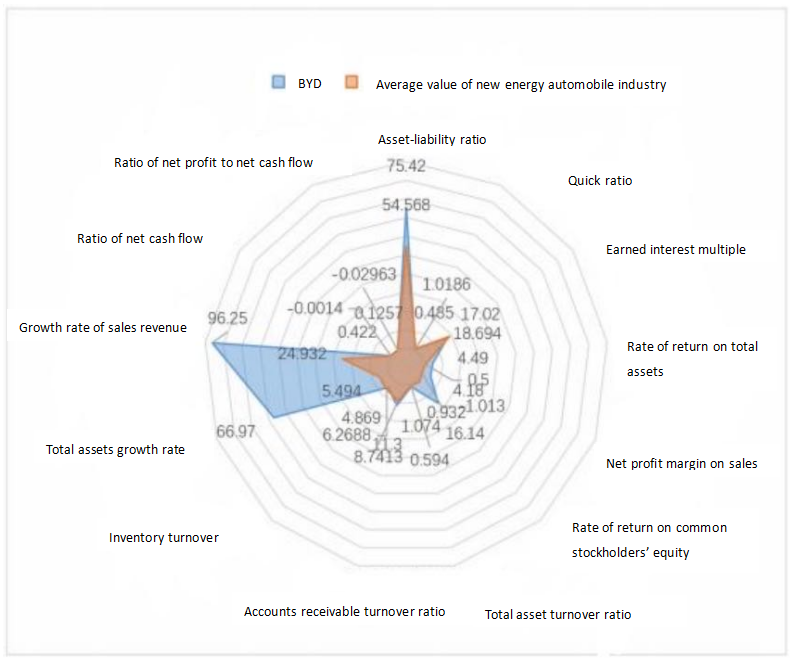
Figure 2. Comparison with radar chart of financial evaluation indicators
From Figure 2, it can be seen that nearly all of BYD’s financial evaluation indicators exceed the industry average, especially the sales growth rate, total asset growth rate, debt-to-asset ratio, and net profit margin. BYD’s exceptionally high sales growth rate and total asset growth rate reflect its strong profitability and development capacity. These results not only confirm BYD's leading position in the new energy vehicle industry but also demonstrate its strong market influence and positive development outlook. However, BYD shows some weakness in inventory turnover and quick ratio, indicating a need to improve the efficiency and turnover speed of inventory operations across various production and operational stages. There is significant room for improvement in enhancing the company’s performance.
6.1.2. Comparison of Non-Financial Evaluation Indicators
The non-financial evaluation indicators were compared between BYD’s values and the corresponding average values of other high-quality companies in the new energy vehicle industry. Again, a radar chart was used to visually represent the differences between them, as shown in Figure 3.
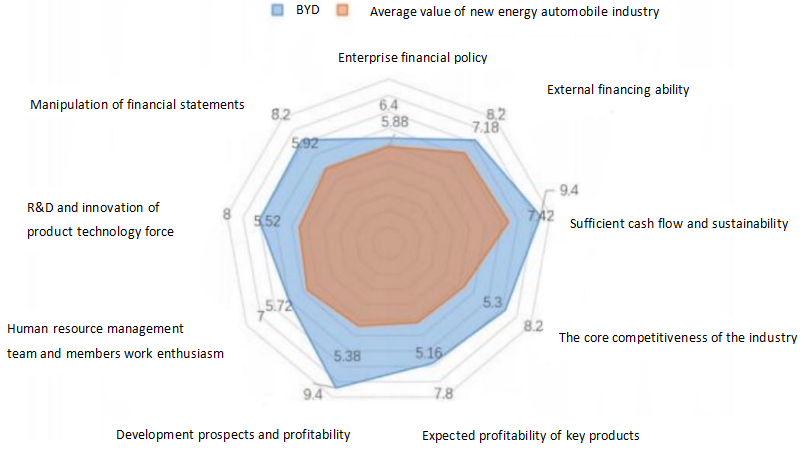
Figure 3. Comparison of radar chart of non-financial evaluation indicators
From Figure 3, it can be observed that all of BYD’s non-financial evaluation indicators exceed the industry average, especially the development prospects and profitability, expected profitability of major products, core competitiveness, and research and innovation capabilities in product technology. These factors comprehensively reflect BYD's advantages in debt repayment ability, profitability, and development potential, showing its capacity for long-term stable development and low financial risk. Compared to other non-financial evaluation indicators, BYD’s corporate financial policies are somewhat weaker and could be further optimized to enhance the company’s overall strength.
7. Vertical comparative analysis of BYD’s financial status over the past three years
By analyzing and comparing the financial status of BYD in 2022, 2021, and 2020, the development trend of the company can be determined. The initial values for BYD's financial risk quantitative and qualitative indicators were calculated using the 2022 annual report data from Eastmoney.com. The average values for the quantitative indicators were selected from the corresponding indicators in BYD’s 2021 and 2020 financial data. Finally, the standard values for both quantitative and qualitative indicators were calculated using formula (1). Similarly, combining the detailed weighted weights for each indicator from Table 2-2, the comprehensive financial risk evaluation scores for BYD’s past three years of vertical comparison were calculated using formula (2), with the results shown in Table 7.
Table 7. Comprehensive score of BYD's financial risk evaluation in recent three years
Primary indicators | Score | Secondary indicators | Standard value | Weight | Score |
Debt paying ability | 64.01 | Asset-liability ratio | 113.67 | 6.176 | 7.02 |
Quick ratio | 65.94 | 3.236 | 2.13 | ||
Interest multiple has been obtained | 518. 11 | 10.588 | 54.86 | ||
Profitability | 46 | Rate of return on total assets | 193.95 | 3.236 | 6.28 |
Net interest rate on sales | 147.18 | 6.176 | 9.09 | ||
Return on equity | 289.25 | 10.588 | 30.63 | ||
Operation capacity | 15.66 | Turnover of total capital | 129.40 | 5 | 6.47 |
Turnover of account receivable | 244. 11 | 2.5 | 6.10 | ||
Inventory turnover ratio | 123.45 | 2.5 | 3.09 | ||
Development ability | 37.78 | Total asset growth rate | 268.31 | 2.5 | 6.71 |
Sales revenue growth rate | 317.60 | 2.5 | 7.94 | ||
Net profit growth rate | 462.62 | 5 | 23.13 | ||
Cash flow ability | 11.73 | Net cash flow ratio | 104.46 | 5 | 5.22 |
Ratio of net profit to net cash flow | 130.19 | 5 | 6.51 | ||
Debt paying ability | 13.27 | Corporate financial policy | 103.23 | 2.4 | 2.48 |
Ability to obtain financing externally | 115.49 | 4.8 | 5.54 | ||
Sustained cash flow with ample capacity | 109.30 | 4.8 | 5.25 | ||
Profitability | 15.23 | The core competitiveness of the enterprise has | 126.15 | 4 | 5.05 |
Expected profitability of major products | 118.18 | 4 | 4.73 | ||
Development prospects and profitability | 136.23 | 4 | 5.45 | ||
Operation and management ability | 6.47 | Human resource management team and staff enthusiasm | 106.06 | 2.4 | 2.55 |
Product technology research and development and innovation ability | 108. 11 | 2.4 | 2.59 | ||
The manipulation phenomenon of financial statements | 110.81 | 1.2 | 1.33 | ||
Comprehensive financial risk score | 210.15 | ||||
As shown in Table 7, BYD' s financial resilience has continued to increase in the past three years, especially in debt servicing. This is especially true for the interest earned multiple in the debt-servicing capacity indicator, the return on net assets in the profitability indicator, the accounts receivable turnover ratio in the operating capacity indicator, and the total assets growth rate, sales revenue growth rate, and net profit growth rate in the development capacity indicator.
8. Conclusion
Based on the results of the financial risk evaluation system in this study, it can be concluded that BYD’s current financial risk status is low. The financial and non-financial evaluation indicators show that BYD has strong profitability, sufficient cash flow, good operating debt repayment capacity, and excellent development prospects and sustainability. From the comprehensive evaluation results, it is evident that BYD is in good overall condition, which is consistent with the company’s actual financial status in 2022. This indicates that the fuzzy analytic hierarchy process (AHP) used in this study provides an accurate evaluation of the company’s financial risk and has certain reference value for BYD’s sustainable development.
9. Suggestions and outlook
9.1. Maintain Adequate Cash Flow
To keep BYD’s financial status in a low-risk state, the company needs to continuously reduce its debt ratio and improve its cash flow ratio, ensuring the maintenance of sufficient cash flow. This will strengthen the company’s risk resistance. BYD should prioritize technological research and development and upgrades, with a focus on reducing battery costs. As one of the most expensive components in new energy vehicles, reducing battery costs can effectively control production costs. Additionally, scaling up production can help reduce the cost of component procurement. Finally, BYD can optimize its logistics network to control logistics and transportation costs of components, thereby saving on labor costs. These measures will help reduce costs and increase revenue, enhancing the company’s cash flow reserves.
9.2. Improve Operating Debt Repayment Ability
Adjust the company’s financial policies and continuously expand channels for external financing. By increasing the quick ratio and current ratio, BYD can enhance its short-term debt repayment ability. Reducing the debt-to-equity ratio and improving the interest coverage ratio will strengthen the company’s long-term debt repayment capacity. Additionally, enhancing the management of working capital, improving the liquidity of assets, and strengthening the company’s ability to resist financial risks will enable BYD to fundamentally prevent and control financial risks, even in a complex economic environment.
9.3. Improve Supply Chain Risk Resistance
Strengthen daily management of product inventory, reasonably arrange production and sales, and control the impact of supply chain risks on the delivery ability, product safety, and quality of new energy vehicle companies. To improve supply chain risk resistance, the company should first thoroughly explore suppliers, expand the pool of qualified suppliers, and reduce reliance on a single supplier. Furthermore, BYD should fully assess warehousing and procurement costs, establish a safety stock system, and avoid material shortages caused by supplier capacity issues that could lead to production halts.
References
[1]. Duan, S. F. (2015). Research on financial risk evaluation of small and medium-sized enterprises: A perspective based on the analytic hierarchy process. Financial and Accounting Communications, 2015(17), 92-95.
[2]. Liao, S. X. (2013). Enterprise financial risk identification based on fuzzy analytic hierarchy process. Enterprise Economy, 2013(10), 76-79. https://doi.org/10.13529/j.cnki.enterprise.economy.2013.10.031
[3]. Cebi, S., Gündoğdu, F. K., & Kahraman, C. (2023). Consideration of reciprocal judgments through Decomposed Fuzzy Analytical Hierarchy Process: A case study in the pharmaceutical industry. Applied Soft Computing Journal, 134.
[4]. Liu, K. (2023). A fuzzy AHP-based performance evaluation method for mixed ownership enterprises. Computer Informatization and Mechanical System, 6(1).
[5]. Nguyen Thi Anh Van, Tucek, D., & Pham Nhat Tan. (2023). Indicators for TQM 4.0 model: Delphi Method and Analytic Hierarchy Process (AHP) analysis. Total Quality Management & Business Excellence, 34(1-2).
[6]. Al Fozaie, M. T., & Wahid, H. (2022). A Guide to Integrating Expert Opinion and Fuzzy AHP When Generating Weights for Composite Indices. Advances in Fuzzy Systems, 2022.
[7]. Liu, M., & Li, Q. (2017). Evaluation of non-financial information for small and micro enterprises based on the analytic hierarchy process. Wuhan Finance, 2017(4), 75-77.
[8]. Liu, X. J., Li, P., & Wen, F. F. (2013). Enterprise financial evaluation based on analytic hierarchy process and fuzzy comprehensive evaluation method. Financial and Accounting Communications, 2013(11), 34-36. https://doi.org/10.16144/j.cnki.issn1002-8072.2013.11.022
[9]. Zhu, B. M., & Mei, H. (2012). Financial risk evaluation of construction enterprises based on fuzzy analytic hierarchy process. Financial and Accounting Communications, 2012(23), 110-111. https://doi.org/10.16144/j.cnki.issn1002-8072.2012.23.002
[10]. Li, J. (2008). Application of the analytic hierarchy process in comprehensive financial analysis. Business Accounting, 2008(1), 55-56.
[11]. Li, Y. Z., & Zhu, Q. L. (2004). Application of improved analytic hierarchy process in comprehensive financial analysis of enterprises. Journal of Hebei University (Philosophy and Social Science Edition), 2004(2), 65-67.
[12]. Guo, Y. M., & Li, T. S. (2022). Construction of a financial risk evaluation system for public hospitals based on the analytic hierarchy process. Chinese Health Economics, 41(9), 88-90.
Cite this article
Zhang,S. (2025). Research on financial risk assessment of company based on fuzzy hierarchy analysis method. Advances in Operation Research and Production Management,4(1),49-60.
Data availability
The datasets used and/or analyzed during the current study will be available from the authors upon reasonable request.
Disclaimer/Publisher's Note
The statements, opinions and data contained in all publications are solely those of the individual author(s) and contributor(s) and not of EWA Publishing and/or the editor(s). EWA Publishing and/or the editor(s) disclaim responsibility for any injury to people or property resulting from any ideas, methods, instructions or products referred to in the content.
About volume
Journal:Advances in Operation Research and Production Management
© 2024 by the author(s). Licensee EWA Publishing, Oxford, UK. This article is an open access article distributed under the terms and
conditions of the Creative Commons Attribution (CC BY) license. Authors who
publish this series agree to the following terms:
1. Authors retain copyright and grant the series right of first publication with the work simultaneously licensed under a Creative Commons
Attribution License that allows others to share the work with an acknowledgment of the work's authorship and initial publication in this
series.
2. Authors are able to enter into separate, additional contractual arrangements for the non-exclusive distribution of the series's published
version of the work (e.g., post it to an institutional repository or publish it in a book), with an acknowledgment of its initial
publication in this series.
3. Authors are permitted and encouraged to post their work online (e.g., in institutional repositories or on their website) prior to and
during the submission process, as it can lead to productive exchanges, as well as earlier and greater citation of published work (See
Open access policy for details).
References
[1]. Duan, S. F. (2015). Research on financial risk evaluation of small and medium-sized enterprises: A perspective based on the analytic hierarchy process. Financial and Accounting Communications, 2015(17), 92-95.
[2]. Liao, S. X. (2013). Enterprise financial risk identification based on fuzzy analytic hierarchy process. Enterprise Economy, 2013(10), 76-79. https://doi.org/10.13529/j.cnki.enterprise.economy.2013.10.031
[3]. Cebi, S., Gündoğdu, F. K., & Kahraman, C. (2023). Consideration of reciprocal judgments through Decomposed Fuzzy Analytical Hierarchy Process: A case study in the pharmaceutical industry. Applied Soft Computing Journal, 134.
[4]. Liu, K. (2023). A fuzzy AHP-based performance evaluation method for mixed ownership enterprises. Computer Informatization and Mechanical System, 6(1).
[5]. Nguyen Thi Anh Van, Tucek, D., & Pham Nhat Tan. (2023). Indicators for TQM 4.0 model: Delphi Method and Analytic Hierarchy Process (AHP) analysis. Total Quality Management & Business Excellence, 34(1-2).
[6]. Al Fozaie, M. T., & Wahid, H. (2022). A Guide to Integrating Expert Opinion and Fuzzy AHP When Generating Weights for Composite Indices. Advances in Fuzzy Systems, 2022.
[7]. Liu, M., & Li, Q. (2017). Evaluation of non-financial information for small and micro enterprises based on the analytic hierarchy process. Wuhan Finance, 2017(4), 75-77.
[8]. Liu, X. J., Li, P., & Wen, F. F. (2013). Enterprise financial evaluation based on analytic hierarchy process and fuzzy comprehensive evaluation method. Financial and Accounting Communications, 2013(11), 34-36. https://doi.org/10.16144/j.cnki.issn1002-8072.2013.11.022
[9]. Zhu, B. M., & Mei, H. (2012). Financial risk evaluation of construction enterprises based on fuzzy analytic hierarchy process. Financial and Accounting Communications, 2012(23), 110-111. https://doi.org/10.16144/j.cnki.issn1002-8072.2012.23.002
[10]. Li, J. (2008). Application of the analytic hierarchy process in comprehensive financial analysis. Business Accounting, 2008(1), 55-56.
[11]. Li, Y. Z., & Zhu, Q. L. (2004). Application of improved analytic hierarchy process in comprehensive financial analysis of enterprises. Journal of Hebei University (Philosophy and Social Science Edition), 2004(2), 65-67.
[12]. Guo, Y. M., & Li, T. S. (2022). Construction of a financial risk evaluation system for public hospitals based on the analytic hierarchy process. Chinese Health Economics, 41(9), 88-90.