


1. Introduction
In recent years, with China’s modernization process and development, the issue of population aging has become increasingly severe [1]. Particularly in first-tier and new first-tier cities, the number of elderly individuals (aged 60 and above) has been rising annually (as shown in Figure 1), and most urbanized areas in China have entered the “silver age” era [2]. To adequately prepare for the challenges and issues brought about by population aging, numerous scholars have conducted research addressing the economic pressures, urban development planning, and elderly care demands resulting from the growing elderly population. Early studies, such as those by Mo Long, forecasted the population aging problem, identified the economic and demographic pressures it entails, and proposed relevant countermeasures [4]. Scholar Li He similarly pointed out the fiscal burden population aging imposes on China’s government expenditure and innovatively suggested measures such as encouraging the reemployment of retired elderly individuals [5]. Li Chenghua proposed an “age-friendly” urban development model against the backdrop of aging, exploring a sustainable development path [6]. Scholars including Sang Tong have focused on the cultural needs of elderly groups and promoted cultural elderly care at the community level [7]. Additionally, research has been conducted on strategies concerning the adequacy of elderly service facilities and specialized elderly care models [8]. Overall, academic research on population aging has become relatively extensive.
Research on population structure within the domain of aging issues also holds practical significance. Scholars such as Ni Xuanming have employed the Leslie matrix as a tool to derive population dynamic systems based on demographic assumptions, predicting the future convergence of China’s elderly population proportion [11]. Su Changgui and colleagues utilized elderly population structure data from Chenzhou to forecast future structural information of the elderly population group [12]. Generally, population studies related to aging focus on the elderly population group in relation to the total population size. However, addressing the severe aging trend anticipated in the future requires more in-depth research on the internal age distribution proportions within the elderly population. At present, there is a scarcity of academic research on the changing trends in age structure within the elderly group, representing a research gap in the field of population aging. Therefore, this paper stratifies the elderly population proportion, examining the issue by analyzing the proportions of different elderly age segments alongside the future development trends of the total population, and puts forward relevant recommendations.
2. Elderly population quantity prediction model
Predictions related to the economic data and developmental trends of the elderly population are relatively rich and comprehensive; however, studies forecasting the population size within different age structures of the elderly group remain scarce. In this paper, the data is drawn from the elderly population statistics of Shanghai, sourced from the Shanghai Municipal Bureau of Statistics website, covering the period from 2015 to 2022. The population numbers of three elderly age groups—60 to 64 years old, 65 to 79 years old, and 80 years and above—are separately predicted, enabling a more detailed exploration of the depth of the aging issue. According to the age stratification of the elderly, we classify them into three categories:
1. Aged 60–64 (Young-old population): Characterized by relatively good health and certain labor capabilities; some individuals remain employed. Attention is focused on the issue of reemployment for this group.
2. Aged 65–79 (Middle-old population): Characterized by declining health but retaining a certain degree of self-care ability; most are retired and primarily rely on pensions. Key concerns for this group include medical security, community services, and elderly care.
3. Aged 80 and above (Old-old population): Characterized by significant decline in physical abilities, with many requiring care; the family caregiving burden is substantial. Critical issues include medical care and psychological support for the elderly within communities.
Given that elderly populations in different age groups have distinct care needs, social roles, and corresponding policy responses, researching the population size within each age segment holds practical significance. Such research can assist relevant stakeholders in making adequate preparations to address the severe aging challenges anticipated in the future.
Regarding the aforementioned age stratification, different elderly age groups correspond to distinct government policy responses. By statistically analyzing and forecasting the proportion of the elderly population aged 65 and above relative to the total elderly population, it is possible to evaluate the current and future elderly population size and the age distribution within a given region. For first-tier cities in China, such as Shanghai, which face severe aging challenges, a significant future increase in the population aged 65 and above would imply substantial elderly care demands and economic growth pressures in the coming years. Conversely, forecasting the proportion of the elderly aged 60 to 64 provides insight into potential solutions for aging-related issues; if the number of elderly individuals in this age group continues to rise, it could effectively promote the reemployment of the “young-old” elderly population and create new economic growth poles within the elderly demographic.
In this study, the forecasting for each elderly age group is based on recent data from the past several years. Since the emergence of the aging issue occurred approximately around the year 2000, the demographic data related to the aging population have experienced rapid changes, with a significant increase in the elderly population size. Therefore, short-term forecasting for the coming years is the primary focus of this research. Using the recent data from 2015 to 2022 as the known actual population baseline, this study predicts relevant elderly population data for the near future five years (2023–2027). Employing recent short-term datasets to forecast mid- to long-term elderly population trends constitutes the core of the elderly population prediction model developed in this paper.
3. Construction of the GM(1,1) prediction model
Using short-term data to predict mid- to long-term trends requires specialized forecasting methods. The grey prediction GM(1,1) model is a computationally simple yet highly accurate forecasting approach, commonly employed for estimating future values over the mid- to long-term horizon. This model and its variants have been widely applied in data prediction studies across various fields.
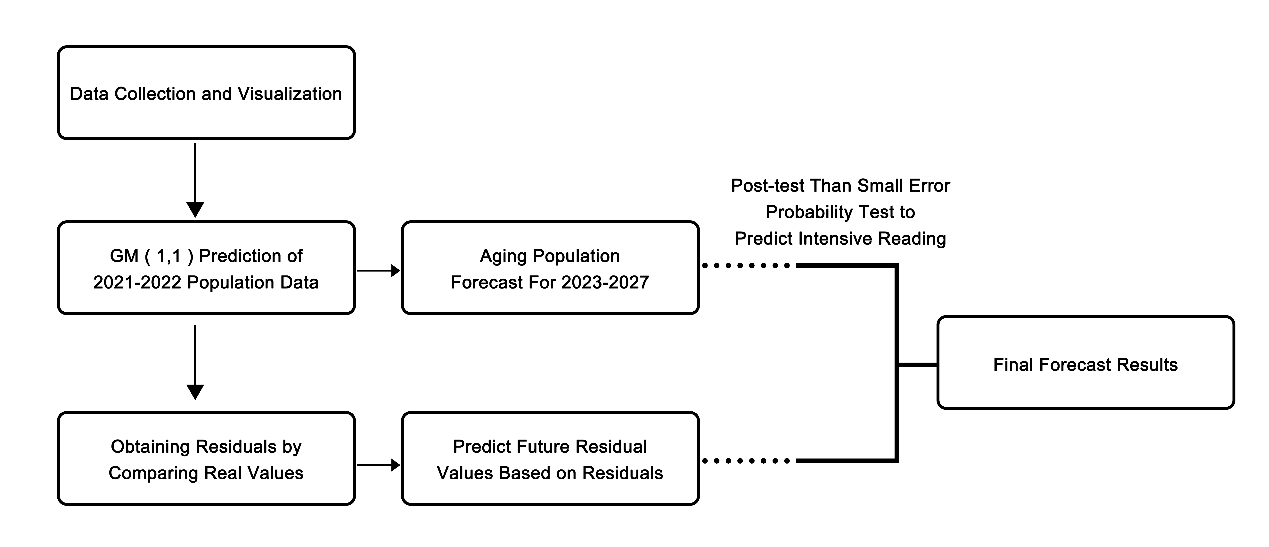
To improve prediction accuracy, this study employs an enhanced grey prediction GM(1,1) model. First, using actual data, the grey prediction model is applied to derive the prediction equation and obtain preliminary forecast results. By comparing these predicted values with the actual data, residuals
3.1. Data preparation
Based on the model described above, the analysis utilizes data from Shanghai [13]. First, the necessary information is obtained from the relevant Shanghai government statistical websites to form the sample set required for predicting the age structure of the elderly population in Shanghai (as shown in Table 1). This data serves as the foundation for constructing the GM(1,1) prediction model, providing a reference for future strategies to address the serious aging issue.
|
Elderly Population\Year |
2015 |
2016 |
2017 |
2018 |
2019 |
2020 |
2021 |
2022 |
|
Total Elderly Population |
435.95 |
457.79 |
483.60 |
503.28 |
518.12 |
533.49 |
542.22 |
553.66 |
|
Age 60–64 |
152.57 |
158.77 |
165.93 |
166.38 |
156.46 |
151.05 |
139.85 |
129.26 |
|
Age 65–79 |
205.33 |
219.36 |
237.09 |
255.23 |
279.68 |
299.92 |
318.49 |
341.25 |
|
Age 80 and above |
78.05 |
79.66 |
80.58 |
81.67 |
81.98 |
82.53 |
83.88 |
83.15 |
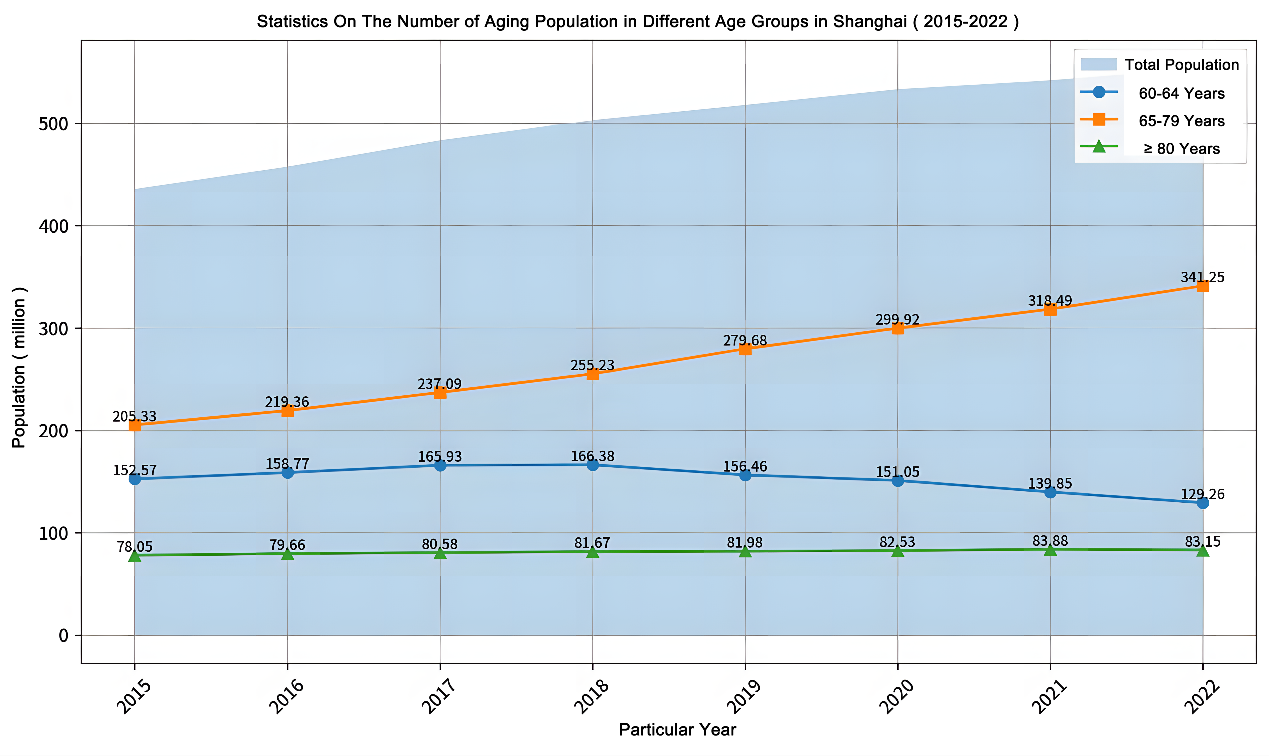
The above population data were cleaned and visualized to provide an intuitive representation of the actual dataset, as shown in Figure 3. The data from the table indicate a significant increase in Shanghai’s elderly population over the past seven years, while the number of “young-old” elderly (aged 60–64) has markedly declined. This pattern is characteristic of a region experiencing severe population aging. Therefore, Shanghai serves as an authentic case study for analysis in this research.
3.2. Initial time series and testing
Taking the total population prediction as an example, the initial time series
First, the sequence undergoes a ratio test, denoted as the ratio
|
Year |
2016 |
2017 |
2018 |
2019 |
2020 |
2021 |
2022 |
|
Ratio |
0.9523 |
0.9466 |
0.9609 |
0.9714 |
0.9712 |
0.9839 |
0.9793 |
After passing the ratio test, to verify that data fluctuations fall within an acceptable range, the smoothness ratio is calculated. If the majority of the smoothness ratios are less than 0.5, the data are considered relatively stable. The smoothness ratio for the k-th data point is
|
Year |
2016 |
2017 |
2018 |
2019 |
2020 |
2021 |
2022 |
|
Ratio |
1.0501 |
0.5411 |
0.3654 |
0.2755 |
0.2224 |
0.1849 |
0.1594 |
3.3. Residual calculation for initial data
Using the sequence
(1) Generate the 1-AGO Sequence and Establish the ModelBy cumulatively summing the first
Generated Adjacent Mean Sequence
The adjacent mean sequence is obtained as follows:
Establish the GM(1,1) differential whitening equation, where
(2) Construct the Matrix to Solve the Differential Equation
Construct the Matrix
With
The predicted values obtained in this study are
|
Year |
Actual Value |
Predicted Value |
Residual |
Relative Error |
|
2015 |
435.95 |
435.95 |
0 |
0 |
|
2016 |
457.79 |
447.54 |
10.25 |
2.24 |
|
2017 |
483.60 |
463.23 |
20.37 |
4.21 |
|
2018 |
503.28 |
479.63 |
23.65 |
4.70 |
|
2019 |
518.12 |
496.73 |
21.39 |
4.13 |
|
2020 |
533.49 |
514.56 |
18.93 |
3.55 |
|
2021 |
542.22 |
533.12 |
9.10 |
1.68 |
|
2022 |
553.66 |
552.43 |
1.23 |
0.22 |
3.4. Residual prediction and model validation
Building upon the previous application of the GM(1,1) prediction model, an initial time series
The GM(1,1) grey prediction method is similarly applied to the residuals, with computational steps analogous to those described above. Solving yields
|
Year |
Original Predicted Value |
Residual Predicted Value |
Corrected Predicted Value |
|
2015 |
435.95 |
0 |
435.95 |
|
2016 |
447.54 |
9.53 |
457.07 |
|
2017 |
463.23 |
18.23 |
481.46 |
|
2018 |
479.63 |
23.57 |
503.20 |
|
2019 |
496.73 |
25.54 |
522.27 |
|
2020 |
514.56 |
24.35 |
538.91 |
|
2021 |
533.12 |
20.32 |
553.44 |
|
2022 |
552.43 |
13.83 |
566.26 |
|
2023 |
572.47 |
5.44 |
577.91 |
|
2024 |
593.24 |
-3.78 |
589.46 |
|
2025 |
614.80 |
-12.58 |
602.22 |
|
2026 |
637.18 |
-21.04 |
616.14 |
|
2027 |
660.42 |
-29.17 |
631.25 |
Based on the data presented in Table 5, a line chart was plotted, as shown in Figure 4.
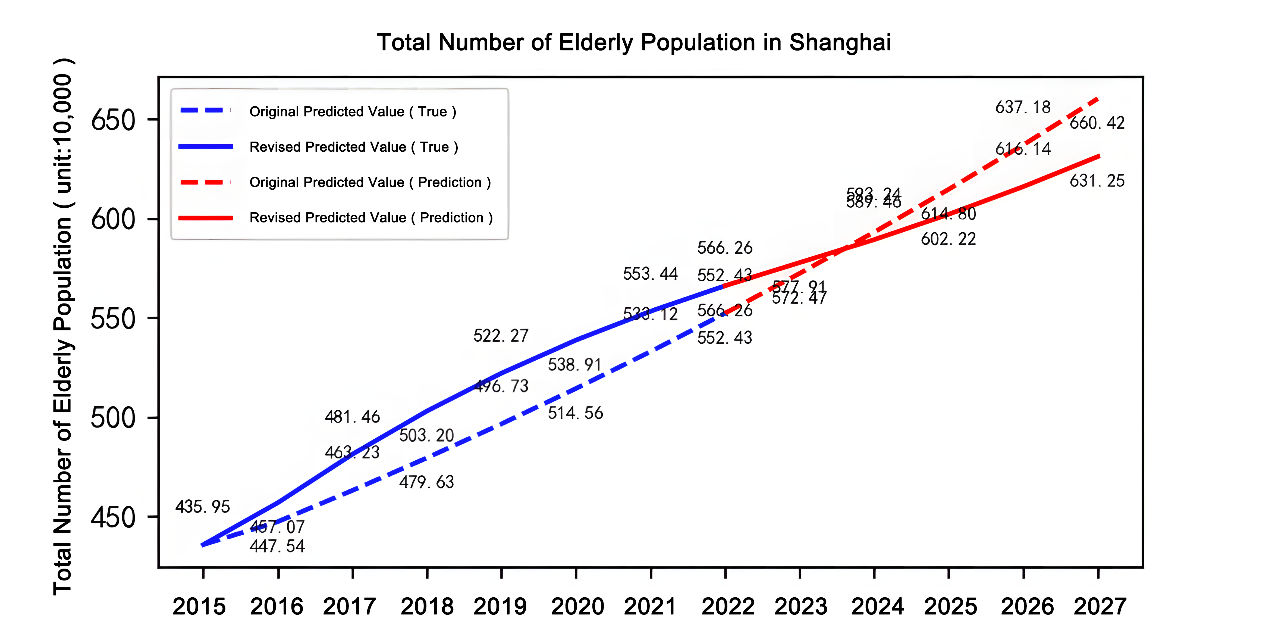
The uncorrected forecast data are evaluated due to the presence of prediction errors. A comparison is made between the actual and predicted values from 2015 to 2022. In this study, two methods are used to assess the accuracy of the prediction: the posterior error ratio and the small error probability test.
First, the standard deviation
Next, the small error probability is calculated to further verify the prediction accuracy. For the residual values, the small error probability
4. Forecast and structural analysis of the elderly population in Shanghai
4.1. Population forecast results
Based on the overall forecast results presented above, the predicted population figures for the elderly in the age groups 60–64, 65–79, and 80 and above are as follows (see Tables 6(a), 6(b), and 6(c)).
|
Year |
Original Predicted Value |
Residual Predicted Value |
Corrected Predicted Value |
|
2015 |
152.57 |
0 |
152.57 |
|
2016 |
154.35 |
3.89 |
158.24 |
|
2017 |
157.45 |
7.19 |
164.64 |
|
2018 |
160.70 |
8.92 |
169.62 |
|
2019 |
164.12 |
8.26 |
172.38 |
|
2020 |
167.71 |
5.52 |
173.23 |
|
2021 |
171.47 |
0.09 |
171.56 |
|
2022 |
175.40 |
-5.47 |
170.03 |
|
2023 |
179.51 |
-11.77 |
167.74 |
|
2024 |
183.80 |
-18.65 |
165.15 |
|
2025 |
188.29 |
-25.94 |
162.35 |
|
2026 |
192.97 |
-33.54 |
159.43 |
|
2027 |
197.87 |
-41.34 |
156.53 |
|
Year |
Original Predicted Value |
Residual Predicted Value |
Corrected Predicted Value |
|
2015 |
205.33 |
0 |
205.33 |
|
2016 |
218.11 |
1.23 |
219.34 |
|
2017 |
233.08 |
3.92 |
237.00 |
|
2018 |
249.19 |
5.94 |
255.13 |
|
2019 |
266.48 |
12.99 |
279.47 |
|
2020 |
284.99 |
14.67 |
299.66 |
|
2021 |
304.76 |
13.48 |
318.24 |
|
2022 |
325.83 |
15.14 |
340.97 |
|
2023 |
348.23 |
14.67 |
362.90 |
|
2024 |
372.04 |
12.95 |
384.99 |
|
2025 |
397.35 |
10.14 |
407.49 |
|
2026 |
424.24 |
6.41 |
430.65 |
|
2027 |
452.78 |
1.05 |
453.83 |
|
Year |
Original Predicted Value |
Residual Predicted Value |
Corrected Predicted Value |
|
2015 |
78.05 |
0 |
78.05 |
|
2016 |
79.42 |
0.23 |
79.65 |
|
2017 |
80.81 |
-0.22 |
80.59 |
|
2018 |
82.21 |
-0.53 |
81.68 |
|
2019 |
83.63 |
-1.61 |
82.02 |
|
2020 |
85.06 |
-2.48 |
82.58 |
|
2021 |
86.51 |
-2.57 |
83.94 |
|
2022 |
87.98 |
-4.73 |
83.25 |
|
2023 |
89.47 |
-4.43 |
85.04 |
|
2024 |
90.98 |
-3.35 |
87.63 |
|
2025 |
92.51 |
-2.07 |
90.44 |
|
2026 |
94.06 |
-0.72 |
93.34 |
|
2027 |
95.64 |
0.87 |
96.51 |
Summarizing the above work, the predicted data are visualized alongside the actual population figures (as shown in Figure 5). In the figure, the light blue shaded area represents the actual and forecasted total elderly population in Shanghai (2015–2022 actual values and 2023–2027 predictions), while the three colored lines correspond to the population numbers for each elderly age group. It should be noted that the total population forecast does not equal the sum of the forecasts for the three age groups, as the total population and each age segment were predicted separately using the error-corrected GM(1,1) models described above.
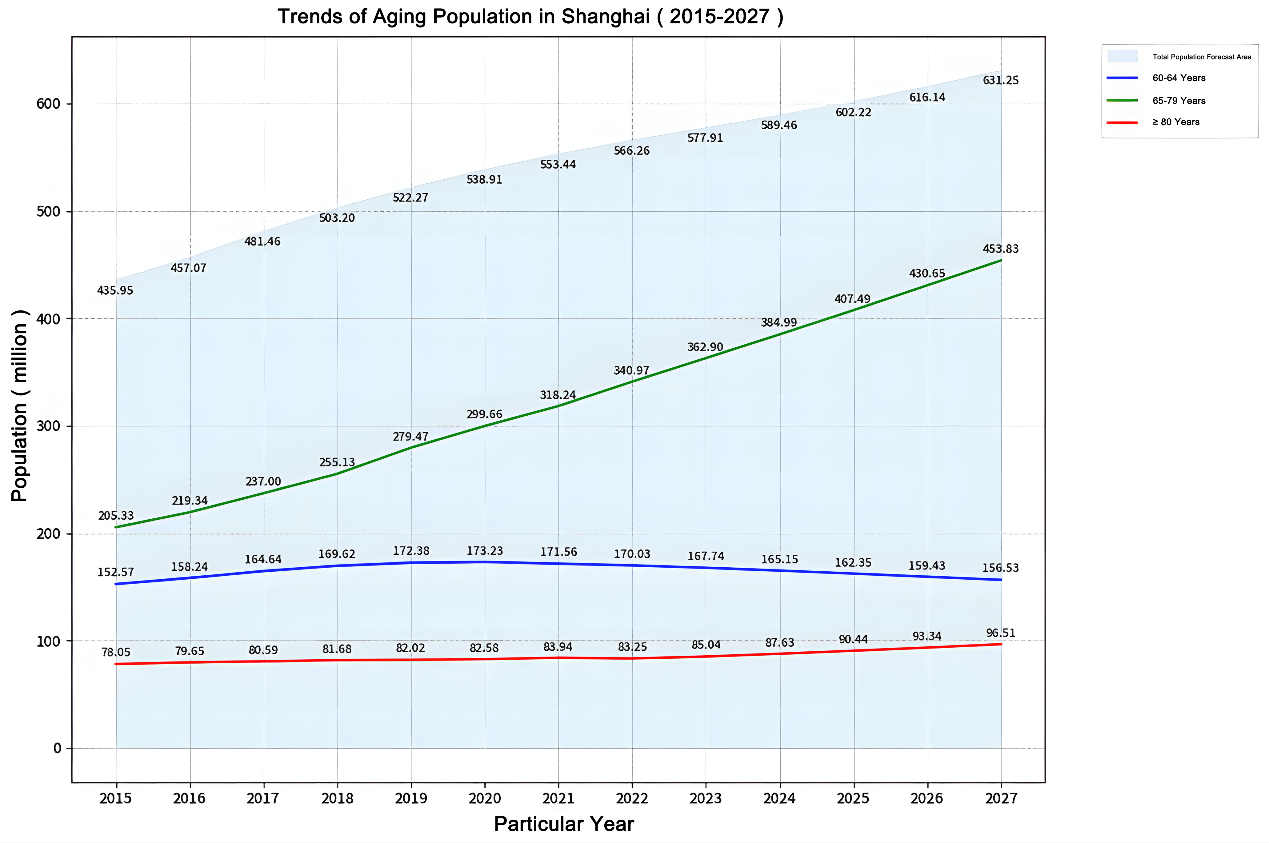
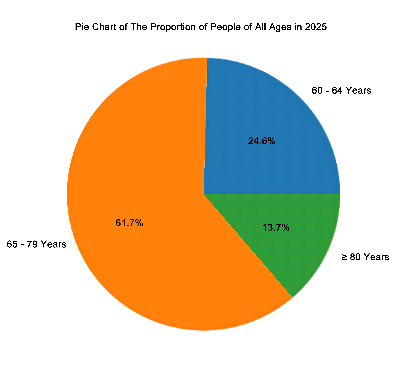
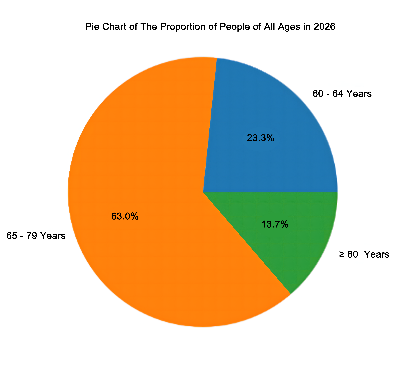
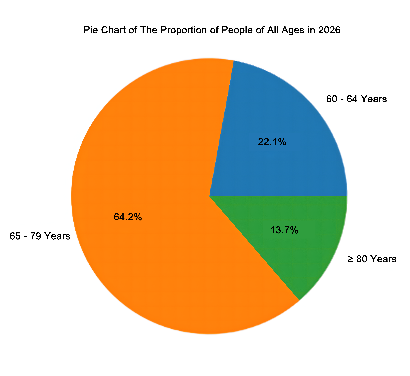
To gain a deeper understanding of the future development trends of Shanghai’s elderly population and to provide reference suggestions for relevant policy-making departments, it is necessary to study the proportions of elderly population across different age groups. The following discussion focuses primarily on the age group proportions within the elderly population. The proportions of each age segment in the elderly group are shown in Figures 6 and 7.

4.2. Future analysis and policy recommendations
4.2.1. Intensification of the aging population problem
1. Increased Longevity and Pressure on Healthcare and Nursing Systems
The proportion of the population aged 80 and above is projected to rise from 12.3% (850,400 individuals) in 2023 to 13.4% (965,100 individuals) in 2027, with an average annual growth rate of 3.2%. Nearly half of this group experiences disability or partial disability, leading to a surge in demand for long-term medical and nursing care services.
2. Continued Contraction of the Labor Supply
The proportion of the “young-old” aged 60–64 is expected to decline from 24.2% in 2023 to 22.1% in 2027. Coupled with the slowdown in the growth of the migrant labor force, the shrinking number of “young-old” elderly workers will pose challenges for economic growth. Although flexible retirement policies allow employees to extend their working years beyond the statutory retirement age, labor shortages persist in sectors such as manufacturing and services.
4.2.2. Countermeasures and policies
1. Promote the Construction of “15-Minute Elderly Care Service Circles” (Targeting the 80+ Age Group)
Fully utilize community-embedded elderly care by integrating community comprehensive elderly service centers with health centers and cultural centers to provide one-stop services including meal assistance, rehabilitation, and recreational activities. Promote home care beds equipped with smart mattresses and fall detection devices, with service fees covered under long-term care insurance.
2. Develop the Smart Elderly Care Industry (Targeting the 65–79 Age Group)
Actively promote the “Smart Home Elderly Care” platform, integrating telemedicine, health monitoring, and other functions to cover as many home-based elderly as possible throughout the city. Leverage Shanghai’s suburban landscapes to attract elderly tourists from the Yangtze River Delta region—for example, develop a “Health + Cultural Tourism” demonstration zone on Chongming Island, featuring elderly-friendly accommodations and traditional Chinese medical therapies to attract senior visitors. Provide income tax exemptions for companies engaged in the research and development of medical, nursing, and health products for the elderly, and establish an industrial fund for the silver economy.
3. Implement Flexible Retirement Policies (Targeting the 60–64 Age Group)
Based on the predicted proportions of elderly population in each age group, flexibly adjust retirement ages for different job positions, with incentives for rehiring in certain roles. Provide additional pension benefits for “young-old” retirees who delay retirement and allow continued contributions to housing provident funds.
In summary, first-tier cities such as Shanghai and Guangzhou will face significant challenges related to population aging, which will also extend to new first-tier cities and inland regions of China. To address this issue, this study proposes a forecasting method that effectively analyzes the development trends of the elderly population over the coming years. The proportions of different age groups within the elderly population are also predicted and analyzed to gain a deeper understanding of the population structure, thereby enabling the flexible formulation of policies to respond accordingly.
References
[1]. Zhu, C. M. (2021). Research on population aging issues and responses in the process of China’s modernization[Master’s thesis, Jilin University].
[2]. He, X. W. (2023). Research on the supply and demand status, problems, and countermeasures of home-based elderly care services in X Street community, Guiyang [Master’s thesis, Guizhou University].
[3]. Zhang, M. X., Guanyu, D., Zhang, Y. N., et al. (2025). Survey on medical services in nursing homes under the background of population aging in China: A case study of two nursing homes in Beijing.China Market, (02), 56–59.
[4]. Mo, L. (2013). Constraints and countermeasures of population aging on China’s population development strategy.Population and Development,19(01), 52–63.
[5]. Li, H. (2023). Mitigating the impact of population aging on China’s fiscal sustainability.Macroeconomic Management, (08), 85–92.
[6]. Li, C. H. (2025). Strategic opportunities and implementation paths for “age-friendly” urban transformation in China.Nanjing Social Sciences, (02), 55–64+106.
[7]. Sang, T., & Liu, A. B. (2024). Exploring urban community cultural elderly care development path from the perspective of integration of elderly care and education.Heilongjiang Science,15(15), 26–28+32.
[8]. Xiao, T. Q., Li, R. R., Ma, J. M., et al. (2024). Quantitative analysis of coupling coordination degree and influencing factors between aging population and elderly care facilities in Ninghe metropolitan area.Journal of Anhui Jianzhu University, 32(03), 35–42.
[9]. Ma, Z. X., Yu, Y., & Li, Z. R. (2023). Analysis of the current status of community elderly rehabilitation medical service facilities in Japan and its implications for China.China Hospital Architecture and Equipment, 24(11), 9–14.
[10]. Wang, H. Q., Wang, J. J., & Zhan, M. X. (2023). Research on the “big city, big elderly care” model based on elderly population needs: A case study of Guangzhou.In Proceedings of the China Urban Planning Society(pp. 785–792).
[11]. Ni, X. M., Shen, X. R., Huang, S., et al. (2020). Study on China’s population structure and the convergence trend of aging.Journal of Mathematical Statistics and Management,39(02), 191–205.
[12]. Su, C. G., Liu, Y. J., Wu, W., et al. (2018). Prediction and analysis of aging population structure changes in Chenzhou City.Journal of Xiangnan University, 39(01), 1–6.
[13]. Shanghai Municipal Bureau of Statistics. (2023).Shanghai Statistical Yearbook 2023. Retrieved from https: //tjj.sh.gov.cn/tjnj/20240321/5a35a44acace471f87c75393133fa142.html
Cite this article
Shen,F. (2025). Research on the prediction of elderly population structure in Shanghai based on GM(1,1). Advances in Operation Research and Production Management,4(1),92-103.
Data availability
The datasets used and/or analyzed during the current study will be available from the authors upon reasonable request.
Disclaimer/Publisher's Note
The statements, opinions and data contained in all publications are solely those of the individual author(s) and contributor(s) and not of EWA Publishing and/or the editor(s). EWA Publishing and/or the editor(s) disclaim responsibility for any injury to people or property resulting from any ideas, methods, instructions or products referred to in the content.
About volume
Journal:Advances in Operation Research and Production Management
© 2024 by the author(s). Licensee EWA Publishing, Oxford, UK. This article is an open access article distributed under the terms and
conditions of the Creative Commons Attribution (CC BY) license. Authors who
publish this series agree to the following terms:
1. Authors retain copyright and grant the series right of first publication with the work simultaneously licensed under a Creative Commons
Attribution License that allows others to share the work with an acknowledgment of the work's authorship and initial publication in this
series.
2. Authors are able to enter into separate, additional contractual arrangements for the non-exclusive distribution of the series's published
version of the work (e.g., post it to an institutional repository or publish it in a book), with an acknowledgment of its initial
publication in this series.
3. Authors are permitted and encouraged to post their work online (e.g., in institutional repositories or on their website) prior to and
during the submission process, as it can lead to productive exchanges, as well as earlier and greater citation of published work (See
Open access policy for details).
References
[1]. Zhu, C. M. (2021). Research on population aging issues and responses in the process of China’s modernization[Master’s thesis, Jilin University].
[2]. He, X. W. (2023). Research on the supply and demand status, problems, and countermeasures of home-based elderly care services in X Street community, Guiyang [Master’s thesis, Guizhou University].
[3]. Zhang, M. X., Guanyu, D., Zhang, Y. N., et al. (2025). Survey on medical services in nursing homes under the background of population aging in China: A case study of two nursing homes in Beijing.China Market, (02), 56–59.
[4]. Mo, L. (2013). Constraints and countermeasures of population aging on China’s population development strategy.Population and Development,19(01), 52–63.
[5]. Li, H. (2023). Mitigating the impact of population aging on China’s fiscal sustainability.Macroeconomic Management, (08), 85–92.
[6]. Li, C. H. (2025). Strategic opportunities and implementation paths for “age-friendly” urban transformation in China.Nanjing Social Sciences, (02), 55–64+106.
[7]. Sang, T., & Liu, A. B. (2024). Exploring urban community cultural elderly care development path from the perspective of integration of elderly care and education.Heilongjiang Science,15(15), 26–28+32.
[8]. Xiao, T. Q., Li, R. R., Ma, J. M., et al. (2024). Quantitative analysis of coupling coordination degree and influencing factors between aging population and elderly care facilities in Ninghe metropolitan area.Journal of Anhui Jianzhu University, 32(03), 35–42.
[9]. Ma, Z. X., Yu, Y., & Li, Z. R. (2023). Analysis of the current status of community elderly rehabilitation medical service facilities in Japan and its implications for China.China Hospital Architecture and Equipment, 24(11), 9–14.
[10]. Wang, H. Q., Wang, J. J., & Zhan, M. X. (2023). Research on the “big city, big elderly care” model based on elderly population needs: A case study of Guangzhou.In Proceedings of the China Urban Planning Society(pp. 785–792).
[11]. Ni, X. M., Shen, X. R., Huang, S., et al. (2020). Study on China’s population structure and the convergence trend of aging.Journal of Mathematical Statistics and Management,39(02), 191–205.
[12]. Su, C. G., Liu, Y. J., Wu, W., et al. (2018). Prediction and analysis of aging population structure changes in Chenzhou City.Journal of Xiangnan University, 39(01), 1–6.
[13]. Shanghai Municipal Bureau of Statistics. (2023).Shanghai Statistical Yearbook 2023. Retrieved from https: //tjj.sh.gov.cn/tjnj/20240321/5a35a44acace471f87c75393133fa142.html