


1 Introduction
In our lifetime, we have captured numerous videos documenting valuable and fascinating events, locations, people, and so on [1]. In the digital era, the way we document life's journey has evolved significantly. With smartphones always at hand and recording tools advancing rapidly, capturing the fleeting moments of childhood has become more accessible. For parents, video recordings provide a priceless method to record both the significant milestones and the everyday nuances of their children's lives.
The affinity diagram (AD) method is a tool that gathers large amounts of data and information and organizes them into groupings based on their similarity Relationships [2]. The AD method is also known as KJ method which was developed by Professor Jiro Kawakita from Tokyo Institute of Technology. Originating from anthropology and social science, the AD method is a tool used to externalize, comprehend, and structure large volumes of unstructured, diverse qualitative data [3]. Common applications of affinity diagram include analyzing contextual inquiry data, clustering user attributes into profiles or requirements, problem framing and idea generation, and so on [4]. In this study, we employed the affinity diagram to examine the problem framing related to parents using videos to document their children's lives.
Our study concentrated on parents (aged 40 and above) with children, investigating their use of technology to capture and preserve significant moments in their children's lives, exploring their motivations and subsequent behavior with these recordings, and assessing whether these digital materials hold emotional significance in their lives.
2 Related Works
The AD method, commonly referred to as KJ method, was innovated by Japanese anthropologist Jiro Kawakita as a robust data analysis tool. The method expertly reorganizes raw data obtained from analytical work to uncover new hypotheses and findings. The AD method is a widely recognized and effective data analysis and problem-solving approach in research, invention, and design [5].
Affinity diagrams serve as a paper-based hierarchical representation of data. The AD method comprises four fundamental steps. In label-making, key facts or issues related to the data are recorded on separate pieces of paper (or sticky notes). In label grouping, individual notes are placed one by one on a spacious empty table or blank wall, forming teams of labels (or clusters). These clusters are subsequently assigned titles. In chart making, the arranged clusters are transferred to a large sheet of paper and annotated with symbols and signs (such as connection, cause, effect and contradiction) to illustrate the interrelations between groups. Finally, in explanation, the resulting chart is verbally explained followed by a written description [4].
Chan Ting et al. used an AD method to effectively analyze and enhance the usability of the in-line performance website, providing a simple and visually appealing method that proves beneficial for individuals requiring a swift and straightforward usability testing tool to manage fast system development [6]. Anitawati Mohd Lokman utilized the AD method to gather and categorize comments and inquiries, forming a model on workplace well-being and critical factors. The factors were grouped to enable a comprehensive study [7].
Beyer and Holtzblatt employed the affinity diagram approach to evaluate the observational and interview data obtained from contextual surveys [8]. To ensure each team member actively participated in the interviews and captured essential points through affinity notes, numerous interpretation sessions and work models were conducted. The team adeptly analyzed the consolidated data by reviewing and visualizing it, simplifying and reshaping user work. Subsequently, storyboards were developed with detailed text descriptions, followed by a user test conducted using physical modeling and interviews. The digitized process helped build cognitive models of the data through social and spatial awareness, demonstrating our expertise in using technology to enhance traditional methods.
William Widjaja et al. conducted a study and confidently proposed a digital affinity diagram system that leverages the concept of parallel engineering in distributed systems. After conducting a series of experiments, the system was tested and demonstrated to achieve significantly higher brainstorming output rates when compared to traditional paper-based simulation methods. The results of the experiment provide conclusive evidence that, in terms of usability, digital methods surpassed analog methods, except for the teamwork condition, which could be attributed to the challenges of resource coordination in a distributed computing setup. Additionally, the utilization of digital tools led to substantially greater productivity when compared to analog methods. The proposed system design for digital systems by William Widjaja and Makoto Takahashi holds promise in fostering the adoption of digital tools in team affinity diagram collaboration. The authors present a compelling argument for embracing digital tools in group affinity diagram collaboration [9].
3 Methods
3.1 Study Design
The study of this subject takes user research as the center. The primary step of this research is to collect data through semi-structured interviews to obtain comprehensive and detailed datasets from the participants. The interviewer can make necessary adjustments flexibly according to the actual situation during the interview. There are no specific requirements for the way and order of questions, the way the interviewee answers, the method of recording the interview, and the time and place of the interview. These aspects are handled flexibly by the interviewer based on the situation. To gain valuable insights, the data collected from interviews was analyzed by organizing an affinity diagram. Data analysis is the main focus of this study, and after a scientific analysis of the data, there are several key findings. The reporting of this research follows the guidelines provided by the Consolidated Criteria for Reporting Qualitative Research (CQREQ) [10].
3.2 Participants
In alignment with our research focus, we targeted to research how parents use videos to document children’s lives. Therefore, the participants should be aged 40 and above, each with at least one child. To recruit participants for our interviews, we created and distributed posters in public spaces (Fig. 1). Prospective participants who expressed interest and met our specified demographic criteria were welcome to take part. Before the interviews started, we provided an opportunity for potential participants to answer questions so that they could raise any personal questions or doubts, offering a comprehensive overview of the interview process and the range of questions that would be asked. Upholding ethical standards, we ensured that all participants and interviewers signed consent forms (Fig. 2), thereby demonstrating a commitment to ethical integrity throughout the research process. At the same time, the rights and culture of Indigenous Australians are respected.
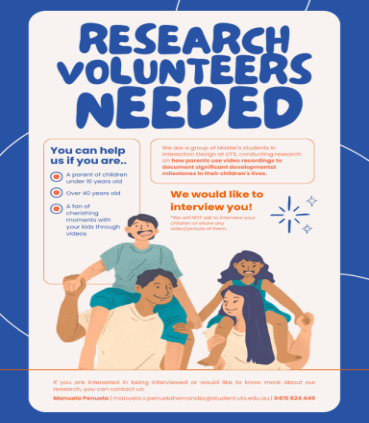
Figure 1. Poster of volunteers
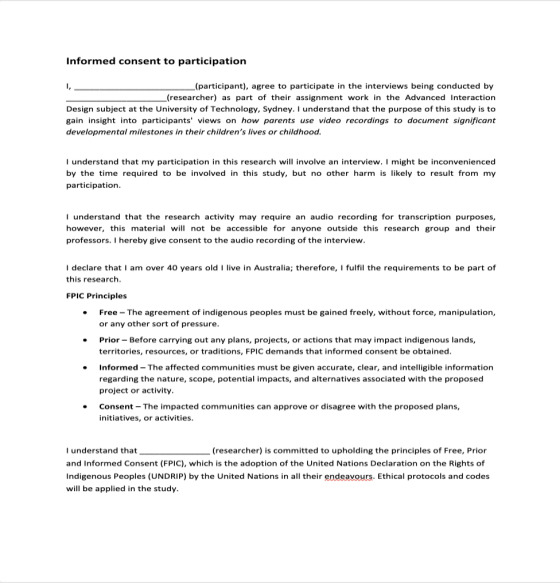

Figure 2. Consent form of interviews
3.3 Interview Design
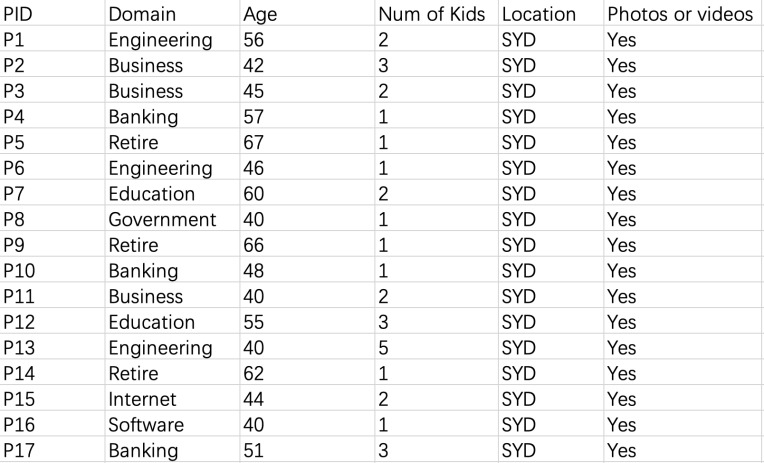
Our interviews covered a wide array of subjects, delving into basic demographics as well as intricate details about family structures, relationships with children, cherished moments, and habits related to video recording and its subsequent use. Initially, we had 32 willing respondents for our interviews. To ensure a more focused and meaningful data collection process, we carefully selected 17 participants based on both their ages and the ages of their children. The information on the 17 participants is shown in Table 1.
Table 1. Participants information
Our interview questions were semi-structured and thoughtfully organized into three distinct phases, allowing for a comprehensive exploration of the chosen topics. All interviews are face-to-face and the entire interview process will be recorded audio. Each participant was actively contacted and scheduled for an interview. We then conducted and audio-recorded face-to-face interviews, each lasting between 30 and 45 minutes. All recordings are treated as the initial datasets, which will be used in subsequent data analysis. The main questions for semi-structured interviews are as follows.
Q1: What is your favorite device to take your kid’s videos? Why is that?
Q2: What milestone do you remember most about your child? What it is? Why did you think this moment could be the milestone of your kid’s life?
Q3: Have you lost any videos or photos of your kids? How did you feel when this mistake happened?
3.4 Data Analysis
The data analysis phase began after all the interviews were completed. Data analysis is divided into three stages. Initially, we transcribed all audio records. In the process of converting the text, we transcribe each sentence from the recording and attribute it to the speaker. Additionally, we ensure that any grammatical errors are corrected. Following the step as shown in Fig. 3, we commenced the transcript coding process, extracting substantial data based on a data-driven inductive method [11]. This phase involves generating succinct labels (codes) that capture and evoke important features of the data that might be relevant to addressing the research question. It involves coding the entire dataset, with two or more rounds of coding, and after that, collating all the codes and all relevant data extracts, together for later stages of analysis. These singletons or sentences are the key information that is extracted from the transcript. Different types of key information are marked by different colors, which is the simplest and most primitive classification for the initial datasets. This approach facilitated a comprehensive analysis of the interviews, allowing for a thorough exploration of the collected information. This research focuses on the final step, creating an affinity diagram. An affinity diagram is a highly effective human-centered design research method for analyzing large datasets.
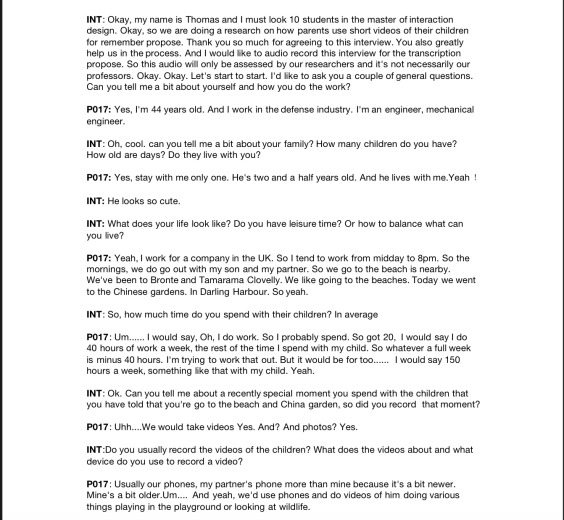
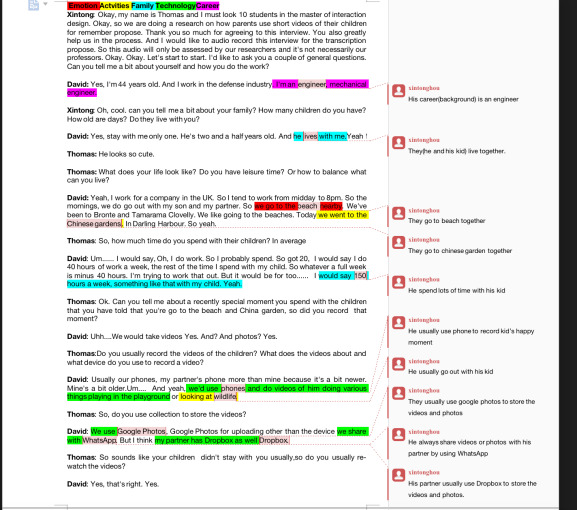
Figure 3. The step of extracting code
3.5 Affinity Diagram
3.5.1 Digital Tool
In the modern landscape, numerous digital tools are available for creating affinity diagrams. Digital tools are preferred over traditional paper for constructing affinity diagrams. While paper notes can be written manually, they can become voluminous and wasteful as they are discarded after data analysis. Digital tools allow for convenient dragging and dropping or moving of notes, making the process more efficient and resource-neutral [2].
After thorough deliberation among our group members, we utilized Miro for this purpose. Miro stands out as an online platform that not only furnishes a private workspace but also encompasses a rich array of data visualization components [12]. Within this dynamic environment, we established an affinity diagram space that accommodates an infinite canvas for organizing and reorganizing the data sourced from our transcripts. It features an adaptive layout and a customised zooming function, ensuring a tailored and flexible user experience. Each team member contributed significantly, generating a substantial volume of sticky notes, each distinguished by a unique color (Fig. 4).
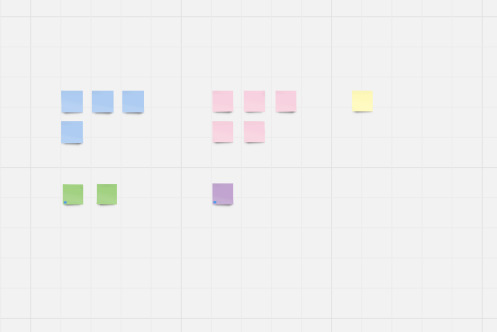
Figure 4. Miro workspace
3.5.2 Analysis process
Firstly, we assigned codes that we collected from interview transcripts to these sticky notes, aligning them with the corresponding color, thereby creating an organized and visually engaging representation of our data (Fig. 5).
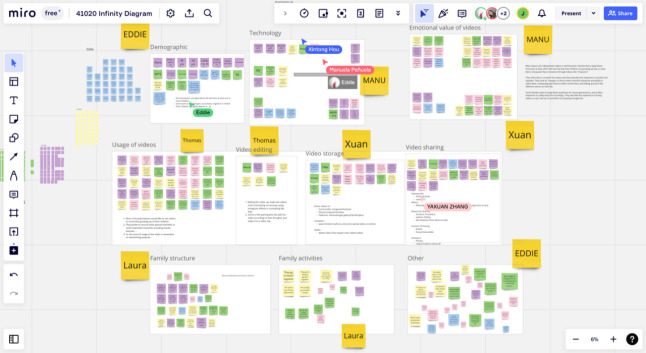
Figure 5. Miro’s team works procedure
Once everyone has completed this step, we will begin the process of re-grouping the sticky notes based on content. If we come across any extremely similar or duplicate sticky notes during the execution process, we will simply delete them. If there is any confusion about the content of a sticky note and we don't know which group it belongs to, we will discuss it with each other to try and resolve the issue. At the same time, we will create secondary or even tertiary groupings for some groups. This will allow us to get more hierarchical insights. At this point, the basic architecture of the affinity diagram has been obtained.
After reorganizing all the sticky notes, some categories that still retain a large amount of data are divided into sub-categories. As shown in the following Fig. 6, the classes of technology include Devices, Apps, and Beliefs on technology, while the subclasses of storage class include online storage, physical storage, and so on (Fig. 6).
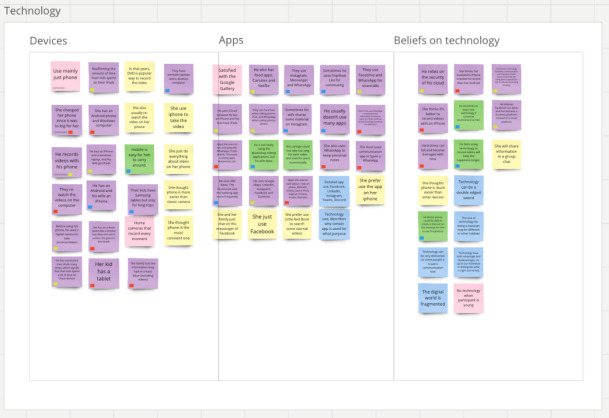

Figure 6. Affinity diagram
To find the information and conclusions more easily, we created a coding table (Fig. 7) in which each code category is clearly labelled, as well as the first, second, and third levels. Once the table was completed, each member of the team selected the categories to be analyzed in depth and wrote up the main findings.
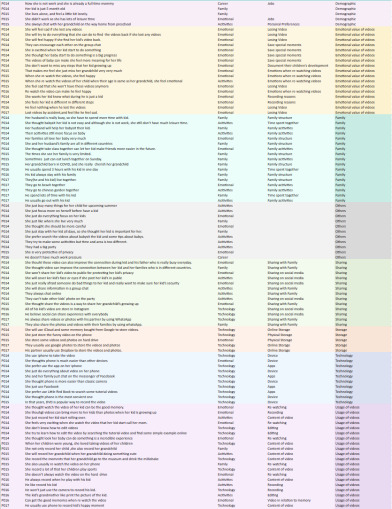
Figure 7. Coding table
3.6 Key Findings
Based on the affinity diagram we constructed, statistical analysis of the notes in the affinity diagram is shown in Fig. 8. Relying on statistical analysis, we identified six primary categories, resulting in six main themes. Therefore, our key findings are presented in six sections corresponding to these themes. These six categories are technology, content of videos, Storage, Sharing, Memory of video, and Emotional value of videos.

Figure 8. notes the statistic of the affinity diagram
3.6.1 Technology
Fig. 9 shows that most participants used their cell phones for video recording, although a few participants preferred to use a camera because of its superior video quality. Most participants (82.4%) preferred to use their phones for video recording. Social media is a fantastic platform to share people’s life. Therefore, many parents share their kid’s videos on social media. According to the results of the interview (Fig. 10), Instagram was the most popular application for communication among participants, with Tik-tok and Instagram being the preferred applications for content sharing.
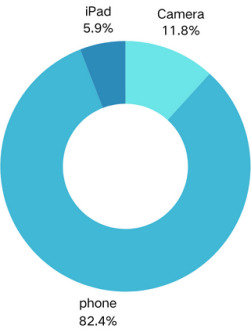
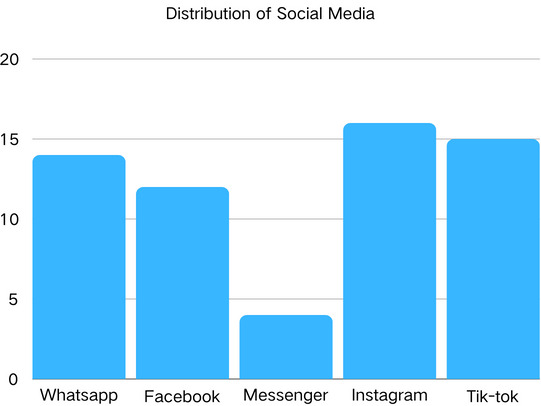
Figure 9. distribution of video tool Figure 10. Distribution of social media
3.6.2 Content of Video
All the participants (17 people) often want to capture spontaneous moments, especially milestones that involve their children, Fig. 11 can prove that. Both family members and professionals may photograph important events. From family gatherings to important occasions such as weddings, memories are often associated with events.

Figure 11. distribution of video content
3.6.3 Video Storage
According to Fig. 12, 58 percent of respondents preferred cloud storage when it comes to video. They cited its advantages over local storage, which is often limited. While hard drives, cell phones, and laptops continue to be popular physical storage options, a segment of users are using social media platforms, although some are expressing privacy concerns. It was observed that the frequency of backing up varies among participants and largely depends on the size and quality of the videos.
Many respondents indicated that with today's technology, they are no longer concerned about video loss. Most respondents delete redundant or unimportant videos. Others prefer to keep all of their videos. It was noted, however, that some respondents expressed a preference for keeping all their videos, with one respondent stating "Every moment is worth keeping".
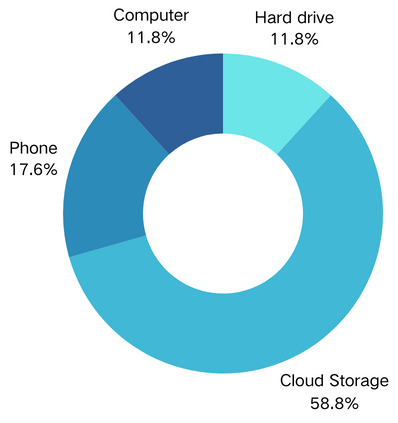
Figure 12. distribution of storage
3.6.4 Sharing
Most of the participants (82.4%) tend to share their videos with their family members or close acquaintances. It is worth noting that some of the immigrant participants are still using social media platforms from their home countries to share visual memories with their family members and friends.There can be privacy concerns for families when sharing videos on social media platforms, especially because of concerns about the safety of their children. For this reason, some users might prefer sharing videos within private groups, ensuring limited access across these platforms. However, some parents are reluctant to share videos of their children on the internet to protect their children's privacy (Fig. 13), especially videos that contain their children's facial features.

Figure 13. distribution of share
3.6.5 Memory Value of Video
There are 12 participants (70.6%) who mentioned they would like to re-watch videos with their kids (Fig. 14). Re-watching video enhances the experience and reinforces memories, making it an effective memory builder. Photographs and videos are powerful tools to help us remember, preserve our memories, and connect with our past experiences. They create a bridge between the present day and the precious moments of the past.

Figure 14. distribution of re-watching video
3.6.6 Emotional Value of Videos
Capturing key moments for sharing, documentation and future reflection is the primary reason parents record videos of their children. These recordings allow parents to relive precious moments, compare past and present experiences, and witness the emotional resonance that these memories have for their children. Watching these videos is a treasured activity for parents, often a source of pleasure, but sometimes a source of sadness because of how quickly their child has grown. As shown in Fig. 15, 82.4% of the responses mentioned that they felt happy when they saw the video being watched, but there were also still 11.8% of responses that mentioned feeling slightly sad. Many families consider these videos to be irreplaceable treasures and want to preserve them for future generations, taking precautions to ensure their safety and security and to avoid the pain of a possible loss.
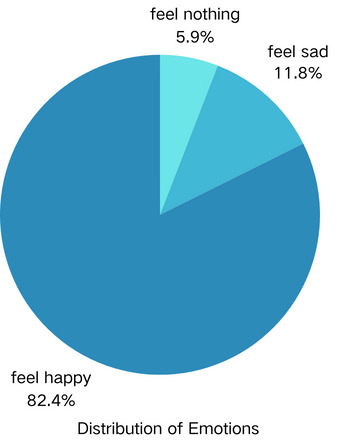
Figure 15. Distribution of emotions
4 Discussion
Among all the results of this experiment, the emotional value and content of the video are relatively important themes.The results of these two parts and the graphical analysis can be used to visualize the factors that influence parents to take videos of their children. The others, including technology, storage, etc., are analyzed and explored for some objective factors of this research topic. According to the graphs, even if they are only objective factors, they still have an impact on the videos taken by parents. For example, the choice of mobile phone and camera will affect the quality of the video. And the different methods of filming can also affect the method of storage.
The most valuable finding of this study is that the emotional value of videos has the greatest impact. This can give other researchers an idea of the value of exploring emotions. At the same time, the use of an affinity diagram and the construction of a multi-level affinity diagram and even a code table in this study can facilitate the data analysis in the subsequent research, and we hope that the use of an affinity diagram in this study can also provide some new ideas to other researchers. I hope the use of an affinity diagram can also provide some new ideas for other researchers.
There are a lot of things that are lacking in this study, that is, the question set for the semi-structured interview and the classification of the affinity diagram. In semi-structured interviews, the question setting still needs to be improved, because in the interviews, we found that many of the questions we set are redundant, and the useless information will consume a lot of our time and energy. In the affinity diagram, we have a class called “others”. This is because there are many tags that we don’t know where to put them. Maybe this is also because the code in the interview transcripts does not make sense.
The impact of these videos on emotions and memories will continue to be explored in future work. As was found in the interview many people mentioned memories, this is an area that could be expanded upon.
5 Conclusion
The motivation and techniques of parents recording videos of their children reveal some interesting findings. These videos serve as tools for reminiscing, capturing significant milestones and moments in their children's lives for sharing, documentation, and future reflection. Private phones are the preferred recording devices due to their technological advancements. Although sharing such content on social media is popular, privacy issues still exist. Participants frequently referred to 'memories' when discussing the profound value of these videos. Throughout the entire research process, we confidently tackled various challenges, including participant recruitment, setting interview questions, and handling large datasets. This study on the emotional significance of videos provides a foundation for further exploration and insights applicable to the field of digital tools.
References
[1]. Jin Yuan, Y., Zhao, Y.-L., Luan, H., Wang, M., & Chua, T.-S. (2014). Memory recall based video search: Finding videos you have seen before based on your memory. ACM Transactions on Multimedia Computing, Communications and Applications, 10(2).
[2]. Takahashi, M. (2016). Distributed interface for group affinity-diagram brainstorming. Concurrent Engineering: Research and Applications, 24(4), 344–358.
[3]. Hartson, R., & Pyla, P. S. (2012). The UX book: Process and guidelines for ensuring a quality user experience. Morgan Kaufmann.
[4]. Lucero, A. (2015). Using affinity diagrams to evaluate interactive prototypes. In 15th Human-Computer Interaction (INTERACT) (pp. 231-248). Bamberg, Germany.
[5]. Kawakita, J. (1991). The original KJ method. Kawakita Research Institute.
[6]. Chan, T., Chew, L., & Ong, L. (2022). A practical usability study framework using the SUS and the affinity diagram: A case study on the online roadshow website. Pertanika Journal of Science and Technology, 30, 1439-1455.
[7]. Lokman, A. M., et al. (2018). Modeling factors and importance of happiness using KJ method. In Advances in Intelligent Systems and Computing (pp. 870-877).
[8]. Koskinen, I., Zimmerman, J., Binder, T., Redström, J., & Wensveen, S. (2011). Design research through practice: From the lab, field, and showroom. Morgan Kaufmann.
[9]. Widjaja, W., Yoshii, K., Haga, K., & Takahashi, M. (2013). Discusys: Multiple user real-time digital sticky-note affinity-diagram brainstorming system. Procedia Computer Science, 22, 113-122.
[10]. Tong, A., Sainsbury, P., & Craig, J. (2007). Consolidated criteria for reporting qualitative research (COREQ): A 32-item checklist for interviews and focus groups. International Journal for Quality in Health Care, 19(6), 349-357.
[11]. Maass, W., & Shcherbatyi, I. (2017). Data-driven, statistical learning method for inductive confirmation of structural models. In Proceedings of the 50th Annual Hawaii International Conference on System Sciences.
[12]. Johnson, E. K. (2022). Miro: Student perceptions of a visual discussion board. In Proceedings of the 40th ACM International Conference on Design of Communication (SIGDOC 2022).
Cite this article
Hou,X.;Chen,Y. (2024). An Analysis of Parents Using Videos to Document Children’s Lives Based on Affinity Diagram Method. Advances in Social Behavior Research,11,1-10.
Data availability
The datasets used and/or analyzed during the current study will be available from the authors upon reasonable request.
Disclaimer/Publisher's Note
The statements, opinions and data contained in all publications are solely those of the individual author(s) and contributor(s) and not of EWA Publishing and/or the editor(s). EWA Publishing and/or the editor(s) disclaim responsibility for any injury to people or property resulting from any ideas, methods, instructions or products referred to in the content.
About volume
Journal:Advances in Social Behavior Research
© 2024 by the author(s). Licensee EWA Publishing, Oxford, UK. This article is an open access article distributed under the terms and
conditions of the Creative Commons Attribution (CC BY) license. Authors who
publish this series agree to the following terms:
1. Authors retain copyright and grant the series right of first publication with the work simultaneously licensed under a Creative Commons
Attribution License that allows others to share the work with an acknowledgment of the work's authorship and initial publication in this
series.
2. Authors are able to enter into separate, additional contractual arrangements for the non-exclusive distribution of the series's published
version of the work (e.g., post it to an institutional repository or publish it in a book), with an acknowledgment of its initial
publication in this series.
3. Authors are permitted and encouraged to post their work online (e.g., in institutional repositories or on their website) prior to and
during the submission process, as it can lead to productive exchanges, as well as earlier and greater citation of published work (See
Open access policy for details).
References
[1]. Jin Yuan, Y., Zhao, Y.-L., Luan, H., Wang, M., & Chua, T.-S. (2014). Memory recall based video search: Finding videos you have seen before based on your memory. ACM Transactions on Multimedia Computing, Communications and Applications, 10(2).
[2]. Takahashi, M. (2016). Distributed interface for group affinity-diagram brainstorming. Concurrent Engineering: Research and Applications, 24(4), 344–358.
[3]. Hartson, R., & Pyla, P. S. (2012). The UX book: Process and guidelines for ensuring a quality user experience. Morgan Kaufmann.
[4]. Lucero, A. (2015). Using affinity diagrams to evaluate interactive prototypes. In 15th Human-Computer Interaction (INTERACT) (pp. 231-248). Bamberg, Germany.
[5]. Kawakita, J. (1991). The original KJ method. Kawakita Research Institute.
[6]. Chan, T., Chew, L., & Ong, L. (2022). A practical usability study framework using the SUS and the affinity diagram: A case study on the online roadshow website. Pertanika Journal of Science and Technology, 30, 1439-1455.
[7]. Lokman, A. M., et al. (2018). Modeling factors and importance of happiness using KJ method. In Advances in Intelligent Systems and Computing (pp. 870-877).
[8]. Koskinen, I., Zimmerman, J., Binder, T., Redström, J., & Wensveen, S. (2011). Design research through practice: From the lab, field, and showroom. Morgan Kaufmann.
[9]. Widjaja, W., Yoshii, K., Haga, K., & Takahashi, M. (2013). Discusys: Multiple user real-time digital sticky-note affinity-diagram brainstorming system. Procedia Computer Science, 22, 113-122.
[10]. Tong, A., Sainsbury, P., & Craig, J. (2007). Consolidated criteria for reporting qualitative research (COREQ): A 32-item checklist for interviews and focus groups. International Journal for Quality in Health Care, 19(6), 349-357.
[11]. Maass, W., & Shcherbatyi, I. (2017). Data-driven, statistical learning method for inductive confirmation of structural models. In Proceedings of the 50th Annual Hawaii International Conference on System Sciences.
[12]. Johnson, E. K. (2022). Miro: Student perceptions of a visual discussion board. In Proceedings of the 40th ACM International Conference on Design of Communication (SIGDOC 2022).