


1. Introduction
Theoretically, the financial market has the function of transmitting information. The market releases a large amount of information every day.[1] Through a series of indicators such as the price of securities, market participants can reasonably avoid market risks. But a series of facts have proved that such judgment is not comprehensive. The specific reasons are as follows.
First, the surplus of information in today's market makes it more and more difficult for information audiences to judge what is useful information [2]. If you want to make a judgment, you need highly professional knowledge, software and hardware technology, which is difficult for ordinary market participants to do. In addition, the progress of information commercialization has also hindered the traditional information advantages of financial markets [3]. Second, whether the information audience is really willing to screen valuable information as necessary [4]. If the market hype atmosphere is strong, the information audience will not be willing to conduct in-depth analysis of information-related financial products and even the information itself. Unlike highly professional information analysis institutions such as banks, there are mixed participants in the financial market, including highly professional institutions and people, and even non-professional investors who are not even clear about what finance is[5]. The latter does not have the ability to analyse information, while the former lacks the necessary incentive mechanism for investment projects and finance. Conduct in-depth analysis of commodities. Third, at least as far as the current market-centric system is concerned, the lack of corresponding supervision of derivatives financial products and hedge fund financial institutions has caused a wave [6], and these commodities and institutions are inextricably linked to traditional commercial banks, which directly affects economic operations. The Wall Street storm of 2008 clearly proves this. The movement of stock markets between the US and its allied nations prior to the 2008 financial crisis can be attributed to foreign investments from the US, particularly those from abroad.[7]
The unforeseen variations in financial markets present a significant hurdle for investors regarding the success of their diversification tactics [8]. Besides correctly adjusting target portfolios, there's a significant worry about the precision and steadiness of the parameters in creating varied portfolios to offset the adverse variations across different asset categories. Ang and Chen (1960) highlight that fluctuating risk factors could cause portfolio managers to exaggerate the advantages of diversification, possibly resulting in unforeseen substantial losses due to their diversification strategies [9]. Evidently, volatility stands out as a crucial risk factor, significantly influencing not just hedging and portfolio optimization strategies but also the valuation of options.[10]
Next, I will introduce the background of capital markets and the calculated data related to the surveyed index, compare them and evaluate the optimal portfolio.
2. Background of Capital Markets
Fundamentally, capital equates to wealth, typically manifested as money or tangible assets. In the capital market, two primary categories of individuals exist: those in pursuit of capital and those who contribute capital. Individuals in pursuit of capital typically include industrial and commercial entities, as well as governments, while those who contribute capital aim to earn profits through lending or acquiring assets. Economically, capital denotes the fundamental elements of production, encompassing capital, facilities, machinery, materials, and various other resources. Within the realms of finance and accounting, the term 'capital' typically denotes financial assets, particularly those for conducting business and establishing enterprises. Broadly speaking, capital can also be used as a general term for various socio-economic resources for human beings to create material and spiritual wealth. Capital markets are only one of the market patterns. The market is composed of sellers and buyers, sometimes in tangible spaces, such as farmers' markets or large shopping malls, and sometimes in an electronic environment. The financial market is the market for trading financial products. As an illustration, the currency market sets a reciprocal rate for the currencies of different nations, with market players fulfilling their requirements or investing through the exchange of diverse currencies. Likewise, both the commodity futures market and the capital market are structured to cater to the distinct financial requirements of the parties engaged in purchasing and selling.
3. Data and Methodology
3.1 Data Description
Our sample includes the index of the United States, Malaysia and Switzerland from 2002 to 2022. Collect relevant historical information to know.
3.1.1. United States
United States: 2004-2007: The rise of the housing bubble
As the high-tech bubble burst, investors began to pay attention to the real estate market. In 2004, the rise of the real estate market led to the recovery of the stock market, and the indicator rose from the lowest point of 1176.8133 to 1779.2144. The rise of the housing market has led to a rise in shares of banks, real estate and construction companies. In 2007, the U.S. housing market was affected by the subprime mortgage crisis, and the stock market fell again.
2008: The onset of the financial crisis
In 2008, the subprime mortgage crisis spread rapidly and triggered the financial crisis. The stock market fell sharply due to problems in several banks and financial institutions, and the stock market indicator fell from the maximum of 1176.8133 to 796.787. On Black Monday on September 15, 2008, the Dow Jones Industrial Average fell 504.48 points, its biggest one-day drop on record. With the global financial system on the verge of collapse, the government introduced a number of measures to save financial markets.
2009-2019: The longest bull market in history
Driven by government measures and economic recovery, the stock market rebounded in 2009 and began to enter a bull market. From March 9, 2009 to December 31, 2019, the Jungpoor's 500 index accumulated a cumulative increase of 393%. It was also the longest bull market in history. During this time, despite several small declines, the stock market has been constantly making new highs.
3.1.2. Malaysia
Malaysia: Nassau Guardian, June 22, 2010, from the Associated Press Kuala Lumpur,
According to the annual industry report of the Malaysian Ministry of Trade, affected by the global recession, 2009
Malaysia's manufacturing sector attracted foreign investment plunged 52 percent to $6.9 billion in early 2008
The indicator reached a maximum of 2018.4783 and then plummeted to 1164.3643 in 2009.
The government approved $10.2 billion in manufacturing investment last year, down 48 percent from a year earlier, but still above the annual target of $8.6 billion, the report said. In 2010, the government intends to approve investment in manufacturing of US$12.5 billion, an increase of 22.7% year-on-year, but the approved investment from January to April was only US$2.2 billion.
Total approved investment in services fell 23 percent to $12.1 billion in 2009, with foreign investment falling 40 percent to $1 billion, the report said. The Ministry of Trade said that the government will adopt a series of new liberalization measures, including the implementation of free trade agreements and market access agreements under services with Southeast Asia, and the services sector is expected to attract more foreign investment. The transport, utilities, financial services and telecommunications sectors will be the main beneficiaries of investment. As a result, since 2010, the Malaysian stock market has continued to recover and has stabilized.
3.1.3. Switzerland
Switzerland: Switzerland also suffered a financial crisis during 2008, with a record deficit of CHF 15.8 billion in fiscal 2020. The root cause of this deficit is the coronavirus pandemic, which has led to a reduction in federal government revenue due to the economic downturn on the one hand, and a sharp increase in government spending to fight the epidemic on the other.
The chart shows that the three indicators generally showed a downward trend in 2008 and 2009, because there was a financial crisis at that time, and most regions were hit hard.
3.2 Characteristics of Each Index Data
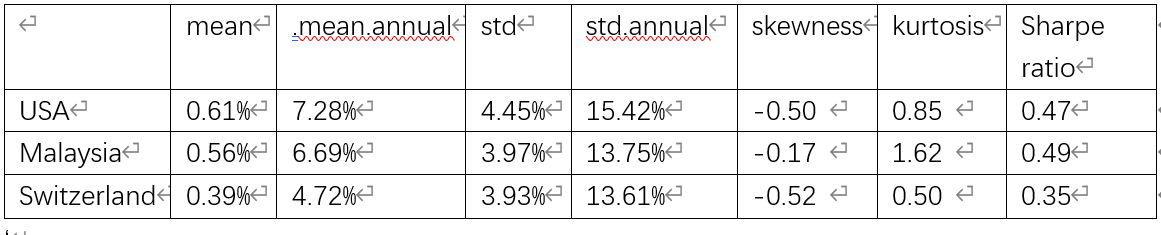
From the known data, monthly return, mean, std, skewness, kurtosis, and sharpe ratio were calculated for the United States, Malaysia and Switzerland. These indicators provide a clearer picture of the value of stocks and how a portfolio should be selected.
First, based on the data calculated by the index of U.S. stocks, the average return is the highest of the three countries, which means that the return on investing in it is higher than that of the other two. However, high returns also come with high risks, as evidenced by its STD, where the slope of CAL measures the trade-off between risk and reward. A higher slope means that investors receive higher expected returns in exchange for taking on more risk. The value of this calculation is the Sharpe ratio, through which the risk reward can also be reflected, according to the curve drawn using monthly return and the trend of retracement, it can be seen that return is the middle high and the two sides are low, similar to normal, from the retracement curve can be seen that the United States began to fall in 2003, with the bursting of the high-tech bubble, investors began to pay attention to the real estate market. In 2004, the real estate market began to rise, which led to the recovery of the stock market. The rise of the housing market has led to a rise in shares of banks, real estate and construction companies. In 2007, the U.S. housing market was affected by the subprime mortgage crisis, and the stock market fell again. In 2008, the subprime mortgage crisis spread rapidly and triggered the financial crisis. The stock market fell sharply due to problems at several banks and financial institutions.
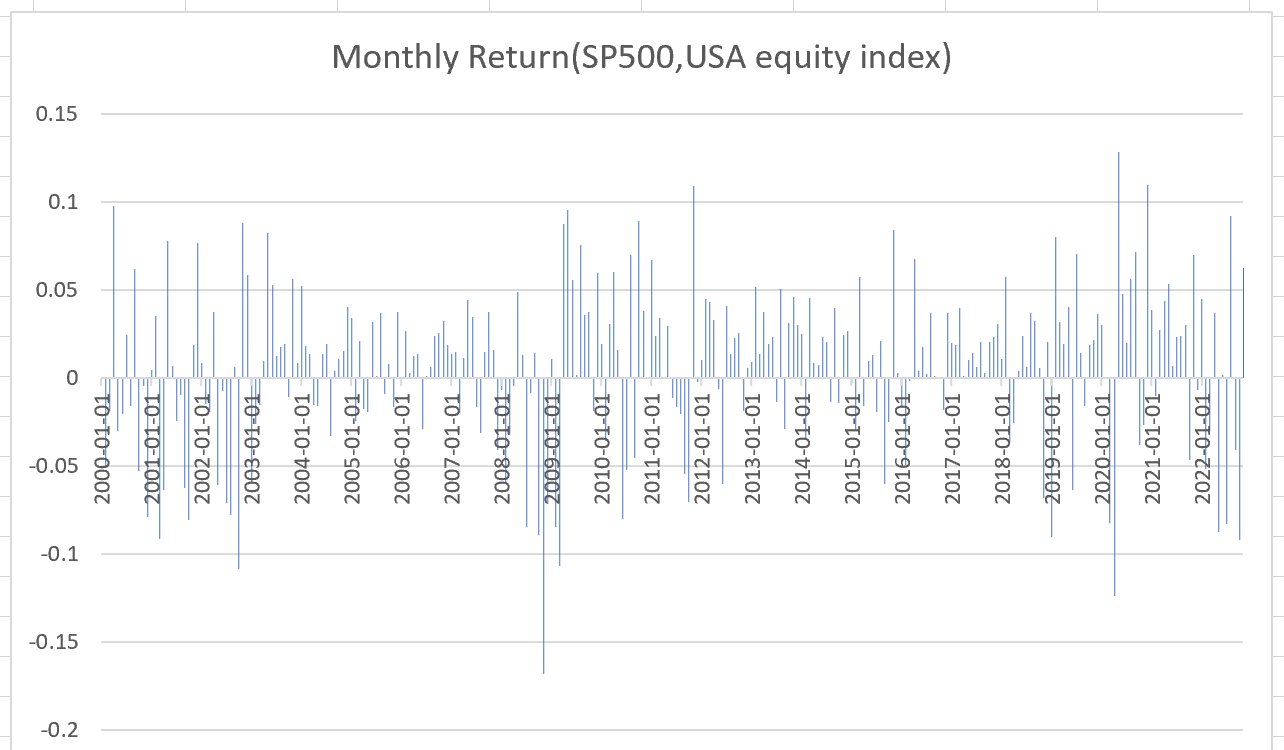
Figure 1: The monthly returns of USA stock market
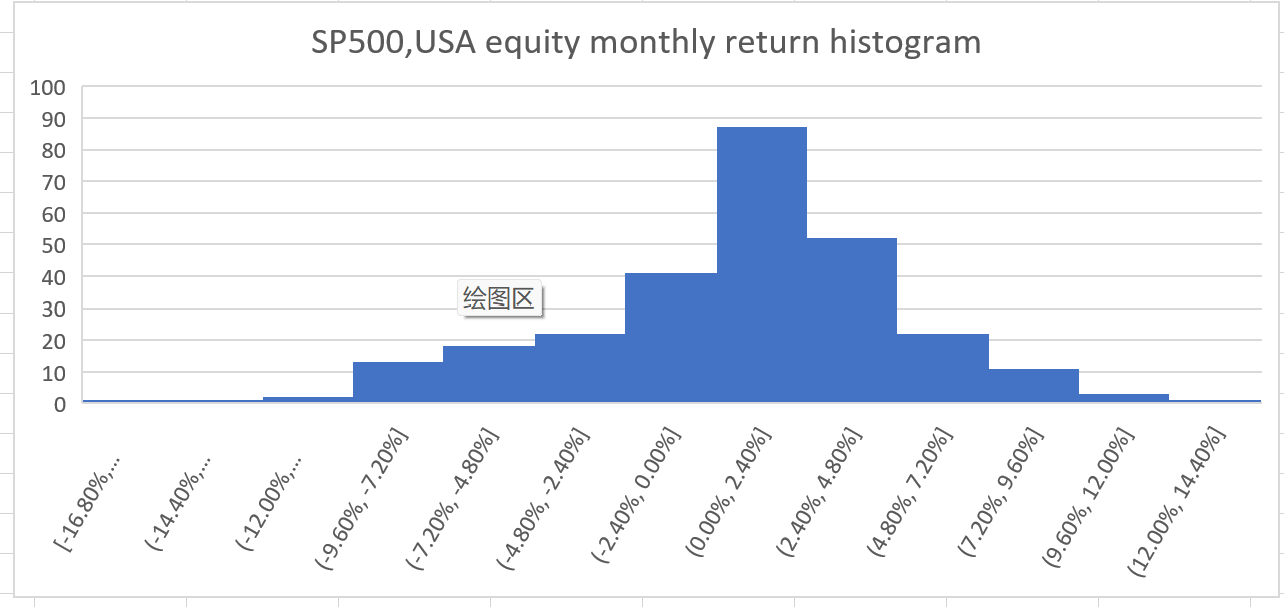
Figure 2: The histogram of monthly USA stock market returns
Driven by government measures and economic recovery, the stock market rebounded in 2009 and began to enter a bull market. From March 9, 2009 to December 31, 2019, the Jungpoor's 500 index accumulated a cumulative increase of 393%. It was also the longest bull market in history. During this time, despite several small declines, the stock market has been constantly making new highs.
Secondly, according to the data calculated by the Malaysian stock index, the average return is the middle of the three countries. Between, calculated as a risk in the return of the like, according to the curve drawn using monthly return as well as back. The trend of withdrawal can be seen that return is high in the middle and low on both sides, which is also similar to normal, but two more than the United States. The distribution of edges is relatively uneven, and it can be seen from the retracement curve that the retracement was the most obvious in 2010, which was affected by the global economic downturn. As a result, Malaysia's manufacturing industry attracted foreign investment plunged by 52% to US$6.9 billion in 2009, which is expected to attract in 2010.The total amount of foreign investment is expected to recover.
Figure 3: The monthly returns of Malaysian stock market
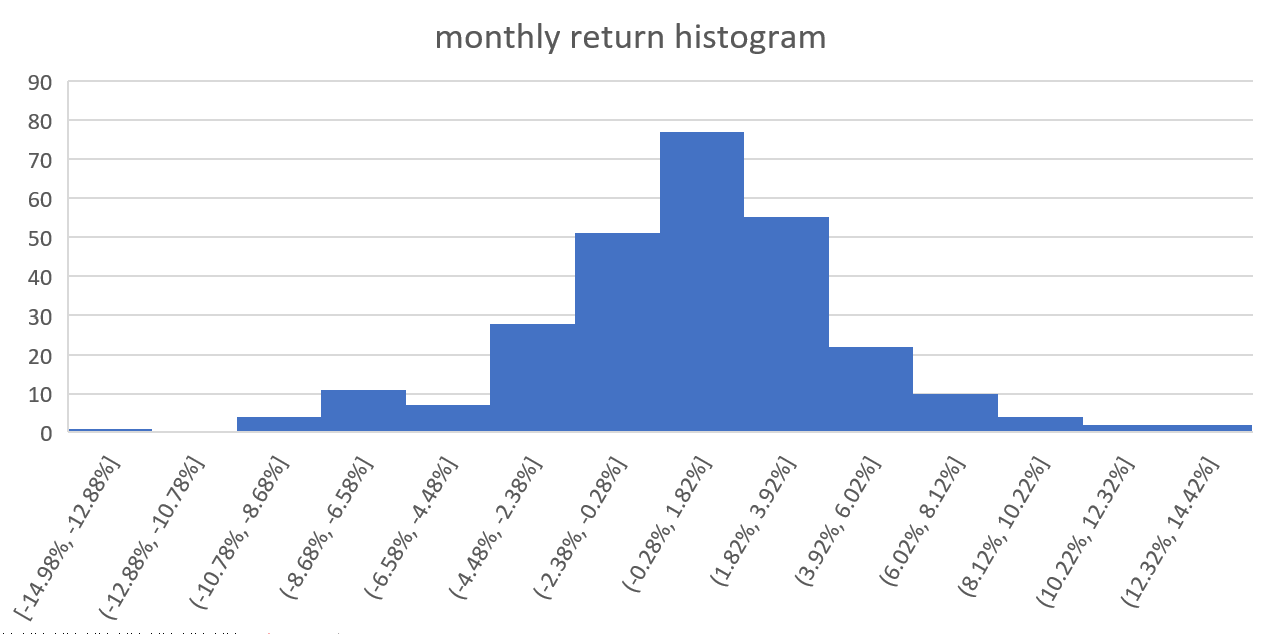
Figure 4: The histogram of monthly Malaysian stock market returns
Finally, Switzerland's average return, which is the lowest among the three countries, belongs to the low-risk, low-return category, according to it.Using the curve drawn by Monthly Return and the trend of retracement, it can be seen that Return is the middle.The high and low sides are also similar to normal, and the two sides are also unevenly distributed, as can be seen from the retracement curve. Also during 2003, the retracement in 2010 was the most pronounced, and it was clear that Switzerland was also affected by the economic crisis, 2020.The deficit for the fiscal year was a record 15.8 billion Swiss francs. The root cause of this deficit is the coronavirus pandemic. On the one hand, the economic downturn has led to a decrease in federal government revenue, and on the other hand, government spending on fighting the epidemic has increased sharply. The drawdown in 2023 is also on an upward trend.
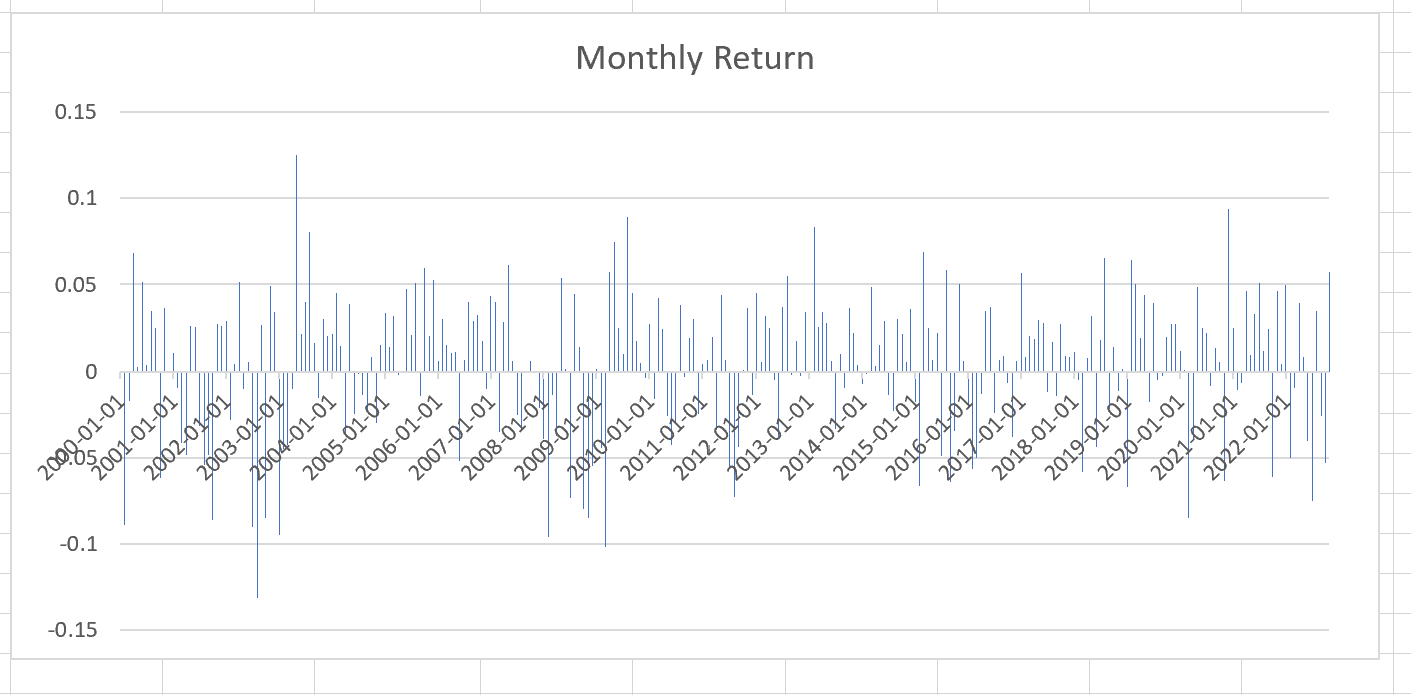
Figure 5: The monthly returns of Switzerland stock market
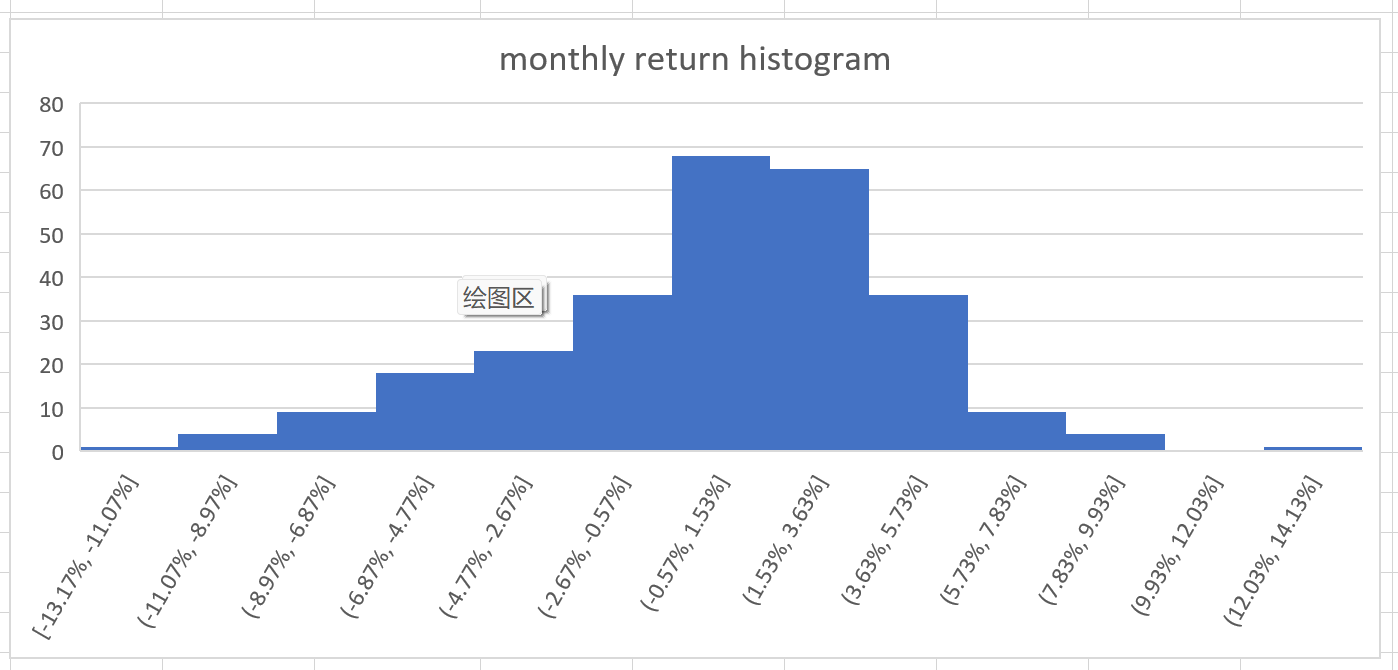
Figure 6: The histogram of monthly Switzerland stock market returns
Table 1: Summary statistics of three countries’ stock market returns
3.3 Evaluate the Portfolios of Three Countries
Skewness measures the asymmetry of the probability distribution of random variables, which is a measure of the degree of asymmetry relative to the mean value. By comparing the skewness of the four combinations, it can be concluded that the absolute value of the skewness of the combination of Malaysia+Switzerland is the smallest, and the degree of deviation is the smallest. The combination of the three countries together has the largest absolute value of skewness, and the degree of deviation is the most severe.
Kurtosis, a statistical measure, examines the data distribution's steepness or smoothness. By assessing the kurtosis coefficient, it's possible to ascertain if the data deviates from a normal distribution in terms of steepness or smoothness. By comparing the kurtosis of the four combinations, it can be concluded that the USA+Malaysia combination has the largest kurtosis and the steepest exponential distribution.
The Sharpe ratio represents how many excesses returns an investor can get for every extra point of risk he takes; If it is positive, it means that the rate of return of the underlying is higher than the volatility risk; If it is negative, it means that the risk of the underlying operation is higher than the rate of return. It represents the ratio of investment return to risk, and the higher this ratio, the better the portfolio. By comparing the Sharpe ratios of the four combinations, it can be concluded that the USA+Malaysia combination has the largest Sharpe ratio, so this combination is the best among the four combinations.
Table 2: Data integration of each asset portfolio tested
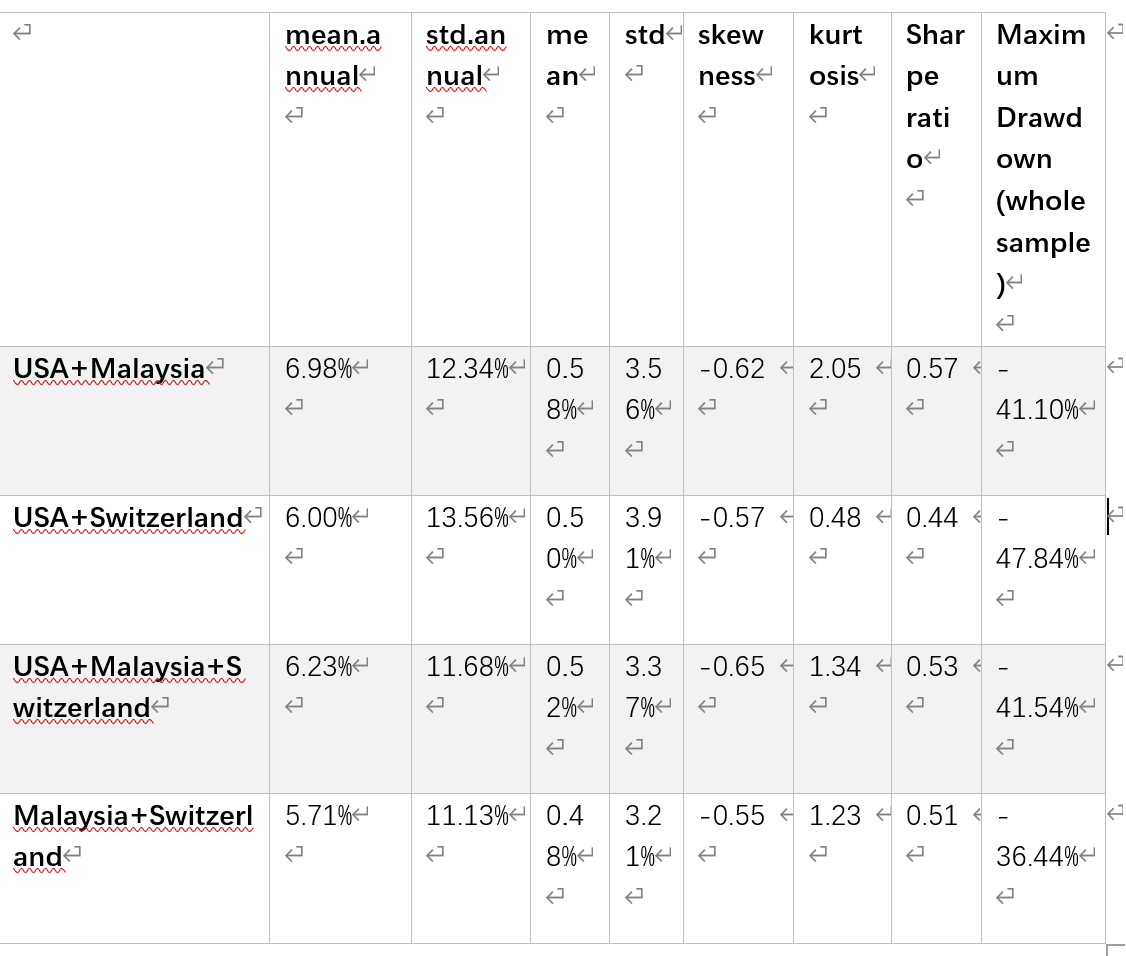
Compare the four combinations, it is not difficult to see that the USA+Switzerland combination has the largest drawdown, that is, the greater the fall, and the Malaysia+Switzerland combination has the smallest Drawdown and the smallest fluctuation of the fall.
4. Conclusion
After the analysis of the above steps, it is not difficult to find that when the investment portfolio is different, that is, when the proportion of each country is different, the value of each data is also different. The degree of risk and the size of the return will also change with the change of the combination, and are closely related. Therefore, I chose several typical proportions to form multiple asset portfolios for comparative observation. By comparing the bias of the four combinations, it can be concluded that the absolute value of the bias of Malaysia+Switzerland is the smallest and the degree of offset; the combination of the three countries is absolute. The value is the largest, and the degree of deviation is the most serious. Peak is a statistical quantity that studies the steep or smooth distribution of data. By measuring the peak coefficient, we can determine whether the data is steeper or smoother than the normal distribution. By comparing the four combinations of each
The peak degree can be obtained that the combination of USA+Malaysia has the highest peak and the steepest exponential distribution. The Sharp ratio represents that every time the investor bears an extra risk, he can get a few points of excess compensation; when positive, the target's return rate surpasses the risk of volatility; conversely, a negative value indicates the target's operating risk exceeds the return rate. This symbolizes the proportion between investment returns and the propensity for risk-taking. An increased ratio signifies a superior investment portfolio. By comparing the Sharp ratios of the four combinations, it can be concluded that USA+Malaysia has the largest Sharp ratio, so this combination is the best of the four combinations. Then look at the Maximum Drawdown (whole sample), which describes the decline of the index, the greater the range.
The greater the risk, compared with the four combinations, it is not difficult to see that USA+Switzerland's drawdown is the largest, i.e., the greater the drop, and the combination of Malaysia+Switzerland has the smallest Drawdown and the smallest fluctuation of the fall.
References
[1]. Review of Finance, Volume 27, Issue 1, February 2023, Pages 1-32, https://doi.org/10.1093/rof/rfac052.
[2]. Francesco Clavorà Braulin(2023). The effects of personal information on competition: Consumer privacy and partial price discrimination. International Journal of Managerial Finance,87, 102923.
[3]. Yongfang Ai, Guanglin Sun, Tao Kong (2023). Digital finance and stock price crash risk. International Review of Economics & Finance,88, 607-619.
[4]. Jauling Tseng (2023). Effect of information disclosure on firms’ direct financing in emerging securities markets. International Review of Economics & Finance.
[5]. Tong Li, Hui Chen, Wei Liu, Yongtian Yu (2023). Understanding the role of social media sentiment in identifying irrational herding behavior in the stock market. International Review of Economics & Finance,87, 163-179.
[6]. Loretta J. Mester (2017). The nexus of macroprudential supervision, monetary policy, and financial stability. International Journal of Managerial Finance,30, 177-180.
[7]. Chai Liang Huang (2020). International stock market co-movements following US financial globalization. International Review of Economics & Finance,69, 788-814.
[8]. Marcel Fratzscher, Jean Imbs (2009). Risk sharing, finance, and institutions in international portfolios. International Journal of Managerial Finance,94(3), 428-447.
[9]. Ang, Andrew, Joseph Chen and Yuhang Xing. "Downside Risk," Review of Financial Studies, 2006, v19(4,Winter), 1191-1239.
[10]. Michael L. McIntyre (2009). Market moves and the information content of option prices. International Review of Economics & Finance,18(2),327-340.
Cite this article
Ding,R. (2024). An Empirical Analysis of Global Stock Markets Evidence from USA, Malaysia and Switzerland. Journal of Applied Economics and Policy Studies,3,20-28.
Data availability
The datasets used and/or analyzed during the current study will be available from the authors upon reasonable request.
Disclaimer/Publisher's Note
The statements, opinions and data contained in all publications are solely those of the individual author(s) and contributor(s) and not of EWA Publishing and/or the editor(s). EWA Publishing and/or the editor(s) disclaim responsibility for any injury to people or property resulting from any ideas, methods, instructions or products referred to in the content.
About volume
Journal:Journal of Applied Economics and Policy Studies
© 2024 by the author(s). Licensee EWA Publishing, Oxford, UK. This article is an open access article distributed under the terms and
conditions of the Creative Commons Attribution (CC BY) license. Authors who
publish this series agree to the following terms:
1. Authors retain copyright and grant the series right of first publication with the work simultaneously licensed under a Creative Commons
Attribution License that allows others to share the work with an acknowledgment of the work's authorship and initial publication in this
series.
2. Authors are able to enter into separate, additional contractual arrangements for the non-exclusive distribution of the series's published
version of the work (e.g., post it to an institutional repository or publish it in a book), with an acknowledgment of its initial
publication in this series.
3. Authors are permitted and encouraged to post their work online (e.g., in institutional repositories or on their website) prior to and
during the submission process, as it can lead to productive exchanges, as well as earlier and greater citation of published work (See
Open access policy for details).
References
[1]. Review of Finance, Volume 27, Issue 1, February 2023, Pages 1-32, https://doi.org/10.1093/rof/rfac052.
[2]. Francesco Clavorà Braulin(2023). The effects of personal information on competition: Consumer privacy and partial price discrimination. International Journal of Managerial Finance,87, 102923.
[3]. Yongfang Ai, Guanglin Sun, Tao Kong (2023). Digital finance and stock price crash risk. International Review of Economics & Finance,88, 607-619.
[4]. Jauling Tseng (2023). Effect of information disclosure on firms’ direct financing in emerging securities markets. International Review of Economics & Finance.
[5]. Tong Li, Hui Chen, Wei Liu, Yongtian Yu (2023). Understanding the role of social media sentiment in identifying irrational herding behavior in the stock market. International Review of Economics & Finance,87, 163-179.
[6]. Loretta J. Mester (2017). The nexus of macroprudential supervision, monetary policy, and financial stability. International Journal of Managerial Finance,30, 177-180.
[7]. Chai Liang Huang (2020). International stock market co-movements following US financial globalization. International Review of Economics & Finance,69, 788-814.
[8]. Marcel Fratzscher, Jean Imbs (2009). Risk sharing, finance, and institutions in international portfolios. International Journal of Managerial Finance,94(3), 428-447.
[9]. Ang, Andrew, Joseph Chen and Yuhang Xing. "Downside Risk," Review of Financial Studies, 2006, v19(4,Winter), 1191-1239.
[10]. Michael L. McIntyre (2009). Market moves and the information content of option prices. International Review of Economics & Finance,18(2),327-340.