


1. Introduction
Since the reform and opening-up from 1978 and joining the WTO in 2001, China has achieved rapid growth of foreign trade volume and has been fully leveraged the driving effects of export trade on social and economic development. In 1978, China's total import and export volume was only 20.64 billion US dollars. According to the data revealed by The General Administration of Customs of China (GACC), in 2021, China’s total foreign trade volume reached 42.07 trillion Yuan (6.31 trillion US dollars), ranked the first place in the global market. Meanwhile China's imports and exports with countries along the Belt and Road totaled 13.83 trillion yuan, which accounts for 32.87% of total foreign trade of China (Central People's Government of China, 2023).
The Belt and Road Initiative (BRI) is a long-term global strategy put forward by the Chinese government, aiming at promoting a transnational network of economic development and integration tunnels that connecting China domestic and abroad. It is claimed that this initiative covers vast regions in Asia, and part of Europe and Africa, which makes up around 64% of world population and 30% of world GDP (Huang, 2016 ; Herrero and Xu, 2017). Since its announcement in September 2013, this initiative has been prioritizing infrastructural investment in different covered areas (Nugent, 2021). Taking advantages of the newly built infrastructure like China-Europe Railway Express, and other favorable policies like China (Sichuan) Pilot Free Trade Zone, it is undoubted that the BRI has had huge influence on China’s export volume.
There are several reasons to choose Sichuan province as the research object. Sichuan, though being an inland province of China without any sea transportation, its location is still of strategic importance as it is at the central position of China, Europe and South Asia. Thus, this geographic location represents a pivotal role in determining the effectiveness of the BRI. Despite that, the development level of Sichuan is less competitive compared with other developed provinces in China, which makes it a typical southwest region that the Chinese government wants to develop through the BRI policy. Specifically, Sichuan has the following strategic superiority as the focal context to study the effect of the BRI. Firstly, it plays a significant role in China’s western development. As suggested, one goal of BRI is to promote China’s implementation of western region development strategy to a deeper degree (Wang et al. 2019). Second, Sichuan is located in the upper and middle reaches of the Yangtze River, which can be integrated with the development of the Yangtze River economic belt through eastward development. Third, Sichuan's opening to the west Asia can be linked with the Silk Road Economic Belt. At the same time, Sichuan is also a strategic base for opening to South Asia, which is consistent with the maritime Silk Road. Huo (2018) suggested that in fact, a country's major strategic deployment can be superimposed to achieve regional radiation and overall driving effect, and the role of Sichuan's strategic significance is very obvious.
From the information revealed by the Chengdu customs, in 2022, the total foreign trade volume of Sichuan province reached 1,007.67 billion yuan, surpassing one trillion yuan for the first time, ranking eighth in China (Chen, 2023). As shown by figure 1, the export volume of Sichuan illustrated the trend of a continuous gentle increase until 2014, then a decrease from 2014 to 2016, the following is a sharp increase after 2016. This is consistent with the export trend of China overall and this macroeconomic phenomenon are caused due to a variety of factors. The authors’ view is that there are three main reasons that can explain from the global, domestic and provincial level for the sudden decline of Sichuan’s export volume from 2014 to 2016. Firstly, China is an export-oriented country which means its economic development is closely related to global economic environment. In 2014, with the tightening of US monetary policy and economic situation, the world economy gradually entered an economic retrograde period. Secondly, during this period, China's own industrial structure problems became prominent, real estate bubble, local debt and other problems emerged, which made the financial risks show an upward trend, and the real economy was greatly affected. Thirdly the momentum of investment-driven economic growth in Sichuan has gradually dried up, and the growth of consumer demand has slowed down (Deng et al.,2017). The BRI was announced in 2013, just before this downturn period, so it can be inferred that the Chinese government has foreseen the negative impacts of the international environment and domestic industrial structure on economic development. It can be speculated that one of the reasons the Chinese government proposed this initiative is to meet this challenge.
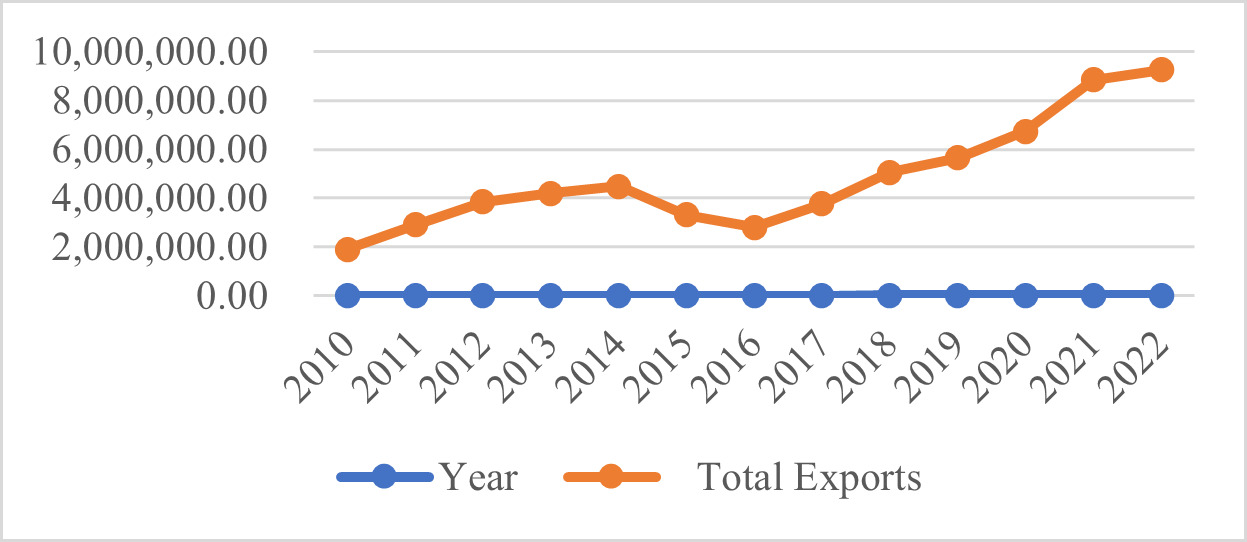
Figure 1. Total exports of Sichuan Province, 2010-2022 (USD 10000). (Source: Sichuan Statistical Yearbook and Commerce Department of Sichuan Province)
In short, this research contributes to the existing literature in following ways. Firstly, there are some researches about the influencing factors of China’s exports on the country level, but the influencing factors on a certain province or region level is not enough. Even with the existed study, they mainly focus on some more developed regions like Beijing, Shanghai or Guangzhou, and no research on the export of Sichuan Province yet. Then our study further focuses the influencing factors of exports in the context of the BRI policy, this is the first time in the literature to investigate the influencing factor of a certain region under this specific international initiative. And the success identification of the influencing factors and trade potential can precisely help the local government of Sichuan to take advantages of this BRI policy and to promote its exports in a more effective way.
The remaining parts of this article is arranged as follows. Section II reviews the recent related literature and selects the potential influencing factors to be tested. Section III exhibits the construction of the regression model and reports the empirical results and corresponding analysis. Section IV estimates the trade potential of each BRI countries with Sichuan. Lastly, section V contains the conclusions and suggestions proposed by this study.
2. Literature Review and Influencing Factors Selection
2.1. Belt and Road Initiative
At first, this paper is related to a group of studies focusing on the Belt and Road Initiative. The BRI is an acronym of two main portions, the Silk Road Economic Belt which connects China through Central and Western Asia with Europe, along with the 21st Century Maritime Silk Road that links China with Southeast Asian, Europe and Africa (Rolland, 2017; Zhou et al., 2022). According to Lo (2015), this initiative is expected to boost economic growth through investment in infrastructure and new trade routes, and to create new economic interdependent relationships between China and member countries. So as Li and Wu (2018) suggest, so as to reach this common purpose, various countries and regions along the route have made joint effect to enhance infrastructure construction. Although the original motive of the BRI, as demonstrated by Melecky, Roberts and Sharma (2019) and De Soyres, Mulabdic and Ruta (2020), is to develop transportation, logistics and other infrastructures that would further connect China with the BRI region, the range of this massive initiative contains far beyond only infrastructural investments. In fact, it is foreseeable that the prompt achievement of these hardware facilities offers a reliable guarantee for the smooth improvement of foreign trade. With the promotion effect from advanced customs clearance, cross-border payment and logistics, and international warehousing, the BRI has become a significant promoter for the development of China’s exports.
2.2. Influencing Factors of Exports
Most of the existing researches on the influencing factors of exports employ empirical analysis as the tool and the difference of each research lays in the research perspective and selected explanatory variables. The different research perspectives can be classified into three kinds. The first category is to investigate the influencing factors from the country level, that is to use the export volume of the whole country to explore the factors. Yao (1998) uses the methods of principal component analysis, factor analysis, multiple correlation and regression analysis to decide which economic factors affect the foreign trade in China. Ai (2021) analyzes the various limiting factors affecting the development of China's foreign trade, and on this basis puts forward feasible suggestions for the development of China's foreign trade. The second kind of research perspective is from the level of certain province or region in a country. Zheng and Ju (2007) use GDP, foreign direct investment (FDI), export market structure, product structure/industry structure, technology innovation and labor factor as the explanatory variables to explore their impacts on Shandong Province's exports. Dong and Xiao (2005) conduct empirical analysis on the exports of Guangdong, Beijing and Zhejiang to verify the impacts of GDP of trading partners, RMB exchange rate and retail price index on the regional exports. Wang (2007) empirically analyzes the factors that affect Xinjiang Province's exports, and finds that Xinjiang's GDP, FDI and economic growth rate of trading countries all play a positive role in promoting exports, while the effect of exchange rate is complex. The third level is where the influencing factors of exports are investigated at a specific industry’s perspective. Chen (2011) establishes a regression equation with the export value of high-tech products as the explained variable, and uses the ridge regression method to analyze the contribution of each influencing factor to the export value of high-tech products. Ji and Ren (2020) use the expanded trade gravity model and explore the influencing factors of China's exports of sporting goods to countries along the Belt and Road. Fang and Ma (2018) focus on the exports of Chinese cultural products to BRI countries and investigate the influencing factors.
Through the above literature review, we can find that there is no comprehensive empirical analysis of the influencing factors of regional export trade under the BRI in the existing literature. And this study also makes the first attempt to set up the research object in a relatively undeveloped western province of Sichuan and thus reveal the deeper impacts of BRI.
2.3. Influencing Factors of Exports
By summarizing the existing influencing factors in the existing literature, table 1 is constructed to show the potential factors from some previous related literature.
Table 1. Influencing Factors in Previous Literature
Year |
Author |
Title |
Influence Factors |
1998 |
Lijiao Yao |
Empirical analysis of influencing factors of China's foreign trade |
GDP, Investment, Savings, Utilization of foreign capital, Foreign exchange reserves, Currency issuance, Exchange rate, Global growth rate, Price index, Tariff rate, Trade management degree |
2005 |
Dong& Xiao |
The quantitative analysis of effecting factors of exports of three eastern areas —— On Guangdong, Beijing, Zhejiang |
GDP of trading countries, RMB exchange rate, Retail price index |
2007 |
Zheng & Ju |
Theoretical and empirical analysis of the influencing factors of foreign trade export in Shandong Province |
GDP of exporter, FDI, Export market structure, Product structure/Industry structure, Technological innovation, Labor factor |
2007 |
Jingfan Wang |
An empirical analysis of the factors influencing the export of Xinjiang |
GDP of exporter, Import volume, FDI, Exchange rate, GDP growth rate of trading countries |
2011 |
Hao Chen |
An empirical analysis of the factors affecting the export of high-tech products-based on the data of 14 provinces |
Development of high technology industrialization, Investment funds in science and technology, Number of scientific personnel, Invention patents |
2017 |
Li & Qiu |
Research on China's export potential to APEC members and its influencing factors: An empirical test based on trade gravity model |
GDP, Distance, Trade Pact, Sharing Border, Common language, FDI, |
2017 |
Jianchun Shao |
The influencing factors of china’s service exports to high-income economies: An empirical study using gravity model and random-effect panel data model |
GDP, Distance, Goods export trade variables, Exchange Rate, FDI, Technical complexity of service export |
Table 1. Continued
Year |
Author |
Title |
Influence Factors |
|
2018 |
Fang & Ma |
Potential and influencing factors of cultural trade between China and countries along the Belt and Road: an empirical study based on stochastic frontier gravity model |
GDP of trading countries, Population of trading countries, Distance, Culture distance |
|
2019 |
Wu & Xiang |
The empirical analysis on the influence of “Belt and Road” strategy on the development of small and medium-sized processing trade enterprises in Chengdu |
FDI, Investment in manufacturing, Import and export volume of foreign trade, Average annual Wages of employees, Exchange rate of RMB, Level of science and technology, Proportion of processing trade industries |
|
2020 |
Dai & Yang |
Foreign trade promotion effect of China’s “Belt and Road” Initiative |
GDP, Population, Tariff barriers, Openness of trading countries, High-tech endowment of trading countries |
|
2020 |
Ji & Ren |
Influencing factors and trade potentials of sports goods export between China and the countries along "Belt and Road": A test based on the extended trade gravity model |
GDP, Distance, Political stability index of trading countries, Openness of trading countries, WTO membership, High-income countries as identified by the World Bank |
|
2021 |
Shangle Ai |
Analysis of the new pattern of China’s foreign trade development under the background of the Belt and Road |
Level of economic development (GDP), Geographical location, Transportation conditions, Industrial structure, Tariff |
|
2021 |
Kong, Chen, Shen & Wong |
Has the belt and road initiative improved the quality of economic growth in China's cities? |
City size, Level of economic development (GDP), Scale of foreign investment, Human capital, Infrastructure |
|
2022 |
Wang & Qu |
The impact of the "Belt and Road" construction on the exports between China and countries along the routes |
Market size (GDP), Economic stability (CPI), Population, Trade barriers (tariff) of trading countries |
|
2023 |
Yu & Ge |
Trade facilitation and domestic value - Added rates of Exports: Empirical analysis based on countries along the Belt and Road |
Import tariffs, Non-tariff trade barriers, GDP, FDI, Exchange rate, Human capital, Total factor productivity, WTO membership |
|
It can be inferred from table 1 that there exist some common recognized influencing factors regarding exports, like the GDP of both sides of trading countries, which is used for 13 out of total 15 articles in table 1. Some other widely considered influencing factors are exchange rate (6 out of total 15 articles), FDI (6 out of total 15 articles), distance or geographical location (5 out of total 15 articles), tariff (5 out of total 15 articles), and population (3 out of total 15 articles).
Another situation here is that some different influencing factors can be summarized to represent the same type of information so we cluster these factors as one. These factors include technology level (identified as development of high technology, high-tech endowment, technological innovation, level of science and technology or invention patents for 5 out of total 15 articles), human capital level (identify as human capital or labor factor for 3 out of total 15 articles), industry structure (identify as proportion of processing trade industries or industrial structure for 3 out of total 15 articles) and infrastructure (identify as transportation conditions or infrastructure for 2 out of total 15 articles).
As a result, this study chooses the top 11 most widely-used influencing factors to test whether they are still significantly influential for exports under the implementation of BRI in Sichuan province. And the 11 factors chosen are the economic development level of Sichuan Province and trading countries, distance between Sichuan and trading countries, population of trading countries, foreign merchant participation of Sichuan, exchange rate of RMB, human capital level in Sichuan, scientific and technology level in Sichuan, industry structure of Sichuan, infrastructure level of Sichuan and tariff level of trading countries. Among these factors, the economic development level of trading countries, tariff level of trading countries and population of trading countries takes the side from trading countries and all other factors are the indexes to describe the situation of Sichuan Province.
3. Empirical Analysis
3.1. Trade Gravity Regression Model Building
The trade gravity regression model originates from Newton's law of gravitation. Tinbergen (1962) as well as Poyhonen (1963) introduced the law of gravitation into the field of international trade. They point out that the scale of bilateral trade flows between two countries is directly proportional to their respective economic scale and inversely proportional to the distance between two trading countries. Later Anderson (1979) further explores the feasibility of interpretation of cross-section data by gravity model from the dimension of time variables and non-time variables. Until now many scholars have expanded the trade gravity model and introduced other factors that affect bilateral trade flow.
Based on the 11 influencing factors selected by this study, we add 8 more potential influencing factors to be tested to the original trade gravity model. To sum up, the key explained variables of the model is the export volume of Sichuan to BRI countries, the explanatory variables is the 11 influence factors chosen in Section II. As we want to study the exports under the BRI, referred to the research of Yu and Ge (2023), this study identifies the BRI countries as the fifty-nine countries covered by the silk road economic belt and the 21st century maritime silk road (The name list of the 59 BRI countries is shown in appendix). Given the availability of data, the export volume of Sichuan with six BRI countries is not separately listed by the Chengdu Custom due to the trading volume being insignificant or no trading partnership. So this study will focus on the total export value of the remaining fifty-three BRI countries. In order to avoid the influence of extreme values of variables and overcome the heteroscedasticity problem, all continuous variables are taken as natural logarithms. Namely exports, GDP of both Sichuan and BRI countries, distance, population, FDI of Sichuan, patent applications, number of graduates from higher education and length of transport routes are all taken as natural logarithms. While the exchange rate, industry structure and tariff remain unchanged. And the logarithmic representation of the model is shown in model 1.
ln EXit = α0 + α1 ln GDPsc + α2 ln GDPi + α3 ln DIS + α4 ln POP + α5 ln FDI + α6 ER + α7 ln HC + α8 STC+ α9 ln TECH + α10 ln IFS +α11 TAR+μij (1)
In model 1, EXPit denotes the export volume of Sichuan to i country in t year, the data is acquired from the Chengdu Custom. We obtained the export volume of Sichuan to different countries from the Chengdu custom, among the total dataset we kept the export volume to fifty-three BRI countries defined in this research. GDPsc is the GDP of Sichuan, GDPi is the GDP of i trading countries, DIS stands for the distance between Sichuan and the trading countries. POP is the population of trading countries, FDI is the foreign direct investment in Sichuan, ER is the exchange rate of RMB, HC represents the human capital level, STC is the industry structure, TECH stands for the technology level, IFS is the infrastructure level of Sichuan and TAR represents the tariff level of trading countries. α0 is the constant term, and αk is the regression coefficient of each variable (k= 1,2,3...... 11), μij is a random variable. The specific measurement and data source of each explanatory variables is shown in table 2.
Table 2. The Measurement and Data Source of Explanatory Variables
Influencing factors |
Symbol |
Measurement |
Data source |
Economic development level of Sichuan |
GDPsc |
GDP |
Sichuan statistical yearbook |
Economic development level of trading country |
GDPi |
GDP (constant 2015 US$) |
WDI database |
Distance |
DIS |
Distance between two countries’ capital city |
CEPII Database |
Population of trading country |
POP |
Total Population |
WDI database |
Foreign Merchant Participation |
FDI |
Foreign direct investment |
Sichuan statistical yearbook |
Exchange Rate |
ER |
Official exchange rate (LCU per US$, period average) |
WDI database |
Human Capital Level |
HC |
Number of Graduates from higher education |
Sichuan statistical yearbook |
Industrial Structure |
STC |
The proportion of tertiary industry to GDP (%) |
Sichuan statistical yearbook |
Scientific and Technological Development Level |
TECH |
Patent applications |
Sichuan statistical yearbook |
Infrastructure Level |
IFS |
Length of Transport Routes |
Sichuan statistical yearbook |
Tariff Barrier of trading country |
TAR |
Tariff rate, applied, weighted mean, all products (%) |
WDI database |
Because changes in influencing factors have a lag effect on exports, in the actual regression, we investigate the impacts of variables with a lag of one year. And the time period is from 2011 to 2022. The basic statistical characteristics of each variable are shown in Table 3.
3.2. Empirical results and analysis
In this paper, Stata17.0 software is used to conduct the empirical analysis on the constructed extended trade gravity regression model. Generally speaking, there are three different model settings to test the panel data, and will generate different regression estimation results. In order to take into account the estimation efficiency and robustness of the model, all three types, which contain the pooled OLS model, the random effect model and the fixed effect model are executed to test the data. The corresponding results of each regression are shown in table 4, in which model 1, 3 and 5 are the baseline regression results, and model 2, 4 and 6 are the extended regression results.
Table 3. Descriptive Statistics
Variable |
Obs |
Mean |
Std. Dev. |
Min |
Max |
ln EX |
636 |
19.419 |
2.282 |
9.01 |
24.98 |
ln GDPsc |
636 |
10.384 |
.341 |
9.752 |
10.894 |
ln GDPi |
633 |
25.007 |
1.603 |
21.15 |
28.647 |
ln DIS |
636 |
8.553 |
.43 |
7.067 |
9.868 |
ln POP |
636 |
16.32 |
1.739 |
12.798 |
21.065 |
ln FDI |
636 |
13.42 |
.505 |
12.41 |
13.844 |
ER |
636 |
6.532 |
.262 |
6.143 |
6.908 |
ln HC |
636 |
12.778 |
.156 |
12.537 |
13.021 |
STC |
636 |
45.783 |
6.018 |
35.1 |
52.5 |
ln TECH |
636 |
11.013 |
.466 |
10.256 |
11.898 |
ln IFS |
636 |
13.991 |
.358 |
13.467 |
14.439 |
TAR |
467 |
4.065 |
3.318 |
.02 |
20.75 |
Table 4. The Regression Results of POLS,RE,FE Model
POLS |
RE |
FE |
||||
|
Model1 |
Model2 |
Model3 |
Model4 |
Model5 |
Model6 |
lnGDPsc |
0.345** |
6.614 |
0.341*** |
5.280* |
0.457*** |
5.171* |
(2.54) |
(1.48) |
(3.52) |
(1.74) |
(2.92) |
(1.72) |
|
lnGDPi |
1.204*** |
1.170*** |
1.191*** |
1.242*** |
0.827** |
1.447*** |
(41.61) |
(20.95) |
(15.66) |
(10.11) |
(2.13) |
(3.10) |
|
lnDIS |
-0.984*** |
-1.269*** |
-0.987*** |
-1.129*** |
0 |
0 |
(-9.15) |
(-9.16) |
(-3.43) |
(-3.67) |
(.) |
(.) |
|
lnPOP |
-0.00130 |
-0.0426 |
-1.958*** |
|||
(-0.02) |
(-0.37) |
(-2.79) |
||||
lnFDI |
0.536 |
0.283 |
0.254 |
|||
(0.81) |
(0.63) |
(0.57) |
||||
ER |
1.820 |
1.373 |
1.324 |
|||
(1.41) |
(1.57) |
(1.52) |
||||
lnHC |
-2.780 |
-2.456 |
-2.203 |
|||
(-1.20) |
(-1.56) |
(-1.41) |
||||
STC |
-0.238 |
-0.173 |
-0.168 |
|||
(-0.98) |
(-1.06) |
(-1.03) |
||||
lnTECH |
0.523 |
0.493 |
0.460 |
|||
(0.75) |
(1.04) |
(0.98) |
||||
lnIFS |
-1.704 |
-1.646** |
-1.557* |
|||
(-1.45) |
(-2.06) |
(-1.96) |
||||
TAR |
-0.0415** |
-0.0286 |
-0.0272 |
|||
(-2.49) |
(-1.34) |
(-1.12) |
||||
_cons |
-5.849*** |
-22.09 |
-5.452* |
-11.87 |
-5.997 |
1.951 |
(-3.27) |
(-0.42) |
(-1.78) |
(-0.33) |
(-0.71) |
(0.05) |
|
N |
633 |
467 |
633 |
467 |
633 |
467 |
t statistics in parentheses
* p < 0.1, ** p < 0.05, *** p < 0.01
Since the influencing factor of distance between two trading countries do not change over time, the parameters of this variables cannot be estimated using the fixed effect model. Nevertheless, distance is the baseline factor and is crucial in the original trade gravity model. So the Breusch and Pagan Lagrangian multiplier test for random effects is conducted to choose between the pooled OLS and random effect model and the result is illustrated in table 5. From the test result, the P value equals to 0 which means the random effect model is better than the POLS model. Consequently, this research chooses the random effect model to analysis the influencing factors of Sichuan’s exports volume under the BRI.
Table 5. Breusch and Pagan Lagrangian Multiplier Test for Random Effects
Estimated results:
| Var SD = sqrt(Var)
---------+-----------------------------
EX | 5.223336 2.285462
e | .6421235 .8013261
u | .7534951 .8680409
Test: Var(u) = 0
chibar2(01) = 950.98
Prob > chibar2 = 0.0000
When focusing on the regression results of RE models (model 3 and model 4), the baseline regression (model 3) is good and all three factors are significant at the 1% level. But when adding together other eight potential influencing factors, most of these factors become insignificant. Our speculation is that the number of explanatory variables is too many and most of the economic variables have collinearity. If all independent variables are included at the same time in the regression, multicollinearity problems may emerge. In order to eliminate multicollinearity problem and obtain the most accurate model, we construct the stepwise regression analysis, starting with the three basic factors and then adding the potential influencing factors one by one to investigate the significance of all these factors. And the results are demonstrated in table 6.
Table 6. The Regression Results of Random Effect Model
RE (1) |
RE (2) |
RE (3) |
RE (4) |
RE (5) |
RE (6) |
RE (7) |
RE (8) |
RE (9) |
||||||||||||||||||
lnGDPsc |
0.341*** |
0.332*** |
-0.0177 |
-0.0815 |
2.188*** |
9.447*** |
9.269*** |
4.980* |
5.280* |
|||||||||||||||||
(3.52) |
(3.38) |
(-0.15) |
(-0.68) |
(5.22) |
(4.12) |
(3.99) |
(1.85) |
(1.74) |
||||||||||||||||||
lnGDPi |
1.191*** |
1.238*** |
1.245*** |
1.256*** |
1.255*** |
1.260*** |
1.260*** |
1.262*** |
1.242*** |
|||||||||||||||||
(15.66) |
(10.31) |
(10.39) |
(10.52) |
(10.56) |
(10.61) |
(10.61) |
(10.65) |
(10.11) |
||||||||||||||||||
lnDIS |
-0.987*** |
-1.030*** |
-1.032*** |
-1.037*** |
-1.034*** |
-1.037*** |
-1.037*** |
-1.038*** |
-1.129*** |
|||||||||||||||||
(-3.43) |
(-3.38) |
(-3.38) |
(-3.41) |
(-3.41) |
(-3.41) |
(-3.42) |
(-3.42) |
(-3.67) |
||||||||||||||||||
lnPOP |
-0.0595 |
-0.0635 |
-0.0700 |
-0.0666 |
-0.0695 |
-0.0696 |
-0.0701 |
-0.0426 |
||||||||||||||||||
(-0.53) |
(-0.56) |
(-0.62) |
(-0.60) |
(-0.62) |
(-0.62) |
(-0.63) |
(-0.37) |
|||||||||||||||||||
lnFDI |
-0.383*** |
-0.662*** |
-0.730*** |
0.498 |
0.500 |
0.200 |
0.283 |
|||||||||||||||||||
(-4.84) |
(-6.57) |
(-7.38) |
(1.27) |
(1.27) |
(0.50) |
(0.63) |
||||||||||||||||||||
ER |
-0.711*** |
-0.683*** |
1.790** |
1.785** |
1.291 |
1.373 |
||||||||||||||||||||
(-4.38) |
(-4.31) |
(2.29) |
(2.28) |
(1.63) |
(1.57) |
|||||||||||||||||||||
lnHC |
-5.217*** |
-4.771*** |
-4.985*** |
-2.333* |
-2.456 |
|||||||||||||||||||||
(-5.63) |
(-5.14) |
(-4.78) |
(-1.74) |
(-1.56) |
||||||||||||||||||||||
STC |
-0.405*** |
-0.399*** |
-0.164 |
-0.173 |
||||||||||||||||||||||
(-3.22) |
(-3.15) |
(-1.12) |
(-1.06) |
|||||||||||||||||||||||
lnTECH |
0.126 |
0.719** |
0.493 |
|||||||||||||||||||||||
(0.45) |
(2.13) |
(1.04) |
||||||||||||||||||||||||
Table 6. Continued
RE (1) |
RE (2) |
RE (3) |
RE (4) |
RE (5) |
RE (6) |
RE (7) |
RE (8) |
RE (9) |
|
lnIFS |
-1.897*** |
-1.646** |
|||||||
(-3.11) |
(-2.06) |
||||||||
TAR |
-0.0286 |
||||||||
(-1.34) |
|||||||||
_cons |
-5.452* |
-5.210* |
3.474 |
12.40*** |
56.16*** |
-39.04 |
-36.15 |
-9.004 |
-11.87 |
(-1.78) |
(-1.65) |
(0.96) |
(3.00) |
(6.40) |
(-1.27) |
(-1.15) |
(-0.28) |
(-0.33) |
|
N |
633 |
633 |
633 |
633 |
633 |
633 |
633 |
633 |
467 |
t statistics in parentheses
* p < 0.1, ** p < 0.05, *** p < 0.01
To start with, it is notable that the influencing factor of the population of trading countries are not significant in all regression. The original assumption is that the population of trading countries represents the purchasing power of this country. However, the coefficient of population is negative which indicates that with the increase of the population of trading countries, the export volume with that country will decrease. This is opposite to the original assumption and the possible explanation could be that some of the BRI countries are developing countries and the population of these country is large but the economic conditions of these countries are relatively backward. This situation causes the correlation between the export volume and population is disturbed with two opposite trend and become insignificant and negative in our model.
After eliminating the influencing factor of population and comparing the coefficient of RE (1)- RE (9), the optimal RE (5) is chosen as the final optimal interpretation model. The influencing factors of GDPsc, GDPi, DIS, FDI, ER and HC and the constant term are all significant at the 1% level. And the detailed analysis of the influencing factors is as follows:
1 The coefficient of the GDP of Sichuan is 2.188 with a significant level of 1%, which indicates that this is an important positive factor affecting the exports. With every 1% increase in Sichuan's economic scale and correspondingly improve Sichuan's production capacity, Sichuan's exports to countries along the Belt and Road will increase by 2.188% when other factors stay the same. Since the coefficient of Sichuan’s GDP is greater than BRI countries’ GDP, Sichuan’s exports to countries along the Belt and Road are supply-induced, that is, the supply of Sichuan is a more important factor affecting exports.
2 The coefficient of the economic scale of BRI countries is 1.255 with high significance. The greater the scale of trading countries’ economic scale, the greater the potential import and export capacity, and thus the greater the bilateral trade flow. When other factors remain unchanged, every 1% increase in BRI countries’ economic scale, Sichuan's exports to these countries will increase by 1.255%.
3 The distance coefficient between China and the countries along the Belt and Road is -1.034, and the significance is high, which manifests the distance is an important factor inhibiting Sichuan's exports to BRI countries. If other conditions remain unchanged, for every 1% increase in the distance between Sichuan and the BRI countries, with the increase of trade costs such as transportation cost, total exports volume will shrink by 1.034%.
4 The coefficient of FDI is -0.73, which demonstrates that the foreign merchant participation in Sichuan has not promoted the development of foreign trade export even inhibited it. This result is inconsistent with some existing literature, Yao (1998) claimed that foreign direct investment themselves were an important force to carry out foreign trades. Strong capital, advanced technology and cheap labor in China combined could produce highly competitive products in the international market to increase the exports. Wang (2011) analyzed the FDI and exports value of China from 1996 to 2009 using co-integration test and proposed that there is a positive correlation between total foreign trade and FDI. The increase of FDI can not only bring about the increase of total imports, but also promote the growth of total exports. However, this was correct in China decades ago, and at present Chinese exports is transferring from quantity to quality. Another reason is that Sichuan’s foreign direct investment is mainly concentrated in the real estate industry and manufacturing industry in recent years, while the exports of Sichuan province is mainly focused on the mechanical and electrical products. Therefore, the FDI absorption does not fully promote the exports. In addition to what mentioned above, there is also situation where part of the FDI of Sichuan has been applied to meeting domestic demand, thus promoting imports more than exports.
5 The coefficient of exchange rate is -0.683. It shows that if other conditions remain unchanged, every 1% appreciation of RMB will reduce the export volume of Sichuan's products to the export target countries by 0.683%. Exchange rate is the most crucial comprehensive price index for a country to carry out cross-border trading (Shi, 2008). The appreciation of RMB will lead to the decline of profits of export enterprises in Sichuan, thus weakening their competitiveness in the global market.
6 The coefficient of human capital is -5.217, which indicates it is the most important influencing factor in the model and is at a high significant level. This result is opposite to our original assumption. In our original assumption, we use the number of graduates from higher education to denote the level of human capital. And the result shows that with every increase in the number of graduates from higher education, the exports will drop by 5.217. One reason for this situation is that Sichuan’s exports are mostly manufactured goods, which are labor-intensive products and the quantity rather than the quality of labor force has a greater impact on the export volume. The improvement of human capital level will lead to the rise of wages, which is not conducive to the exports of labor-intensive products in Sichuan. Besides as our data is only lagged by one year and in a relatively shorter period, yet the improvement of human capital will need longer time to appear in the number of export volume. In general, the total labor endowment has been dominated by low-skilled labor currently in Sichuan, so the negative effect of human capital level on exports is reasonable.
7 The impact from the TAR did not pass the significance test and this is because one goal of the BRI is to achieve unimpeded trade between the member countries. Accordingly, China has signed many bilateral trade agreements with the BRI countries under the promotion of this policy and the weighted average TAR cannot reflect these reciprocal tariffs.
8 In the case of the coefficient of the scientific and technology level, industry structure and infrastructure level of Sichuan, in our regression, after adding this factor, the significance of other factors will decrease. Thus, they are eliminated from the optimal model.
4. Estimation of Sichuan's Export Trade Potential to BRI Countries
The regression results of the trade gravity model can also be used to estimate the export trade potential between Sichuan and BRI countries. The principal is to estimate the export trade potential coefficient by comparing the theoretical export volume simulated by the trade gravity model with the actual export volume. According to the expanded trade gravity model tested above, we select RE (5) as the regression model and execute the regression again after eliminating the factor of population. The final equation for calculating the theoretical export volume is derived as:
ln EXit = 55.93 + 2.2 ln GDPsc + 1.202 ln GDPi - 0.985 ln DIS -0.729 ln FDI - 0.682 ER -5.223 ln HC (2)
During the sample observation period, the calculated trade potential results of each country are shown in figure 2, and the trade potential of each country in 2022 is shown in table 7.
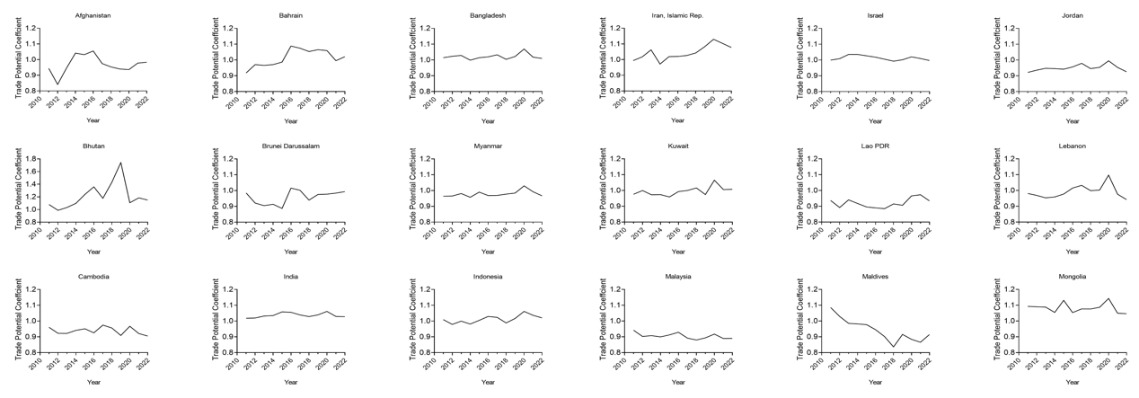
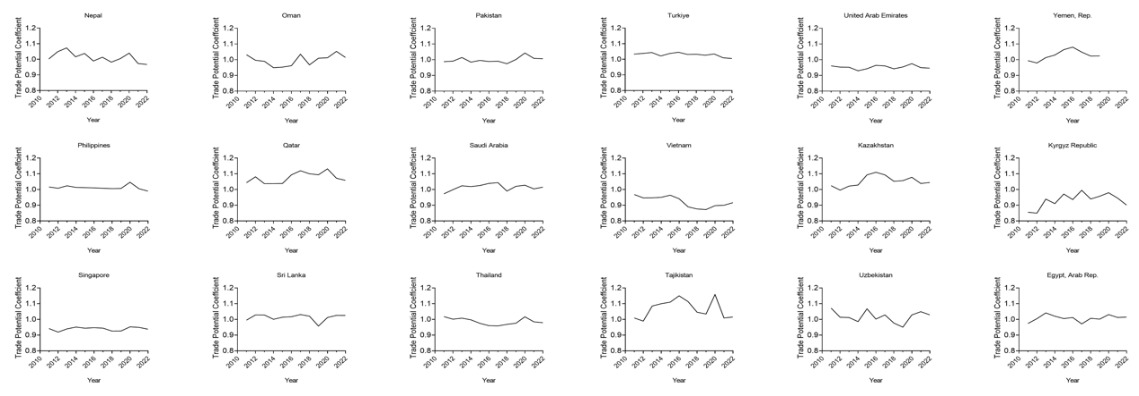
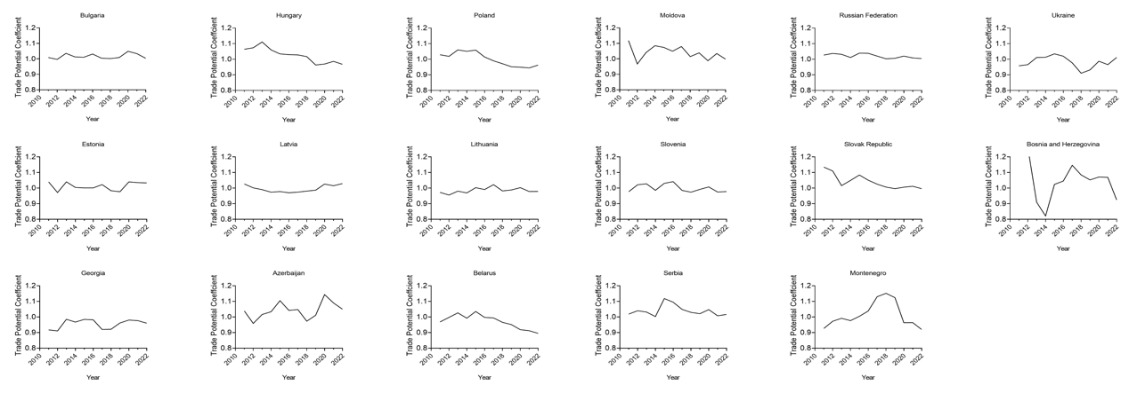
Figure 2. Trade Potential Coefficient of Sichuan to BRI Countries
Table 7. Trade Potential Coefficient of BRI Countries in 2022
Country |
Trade Potential |
Country |
Trade Potential |
Country |
Trade Potential |
|
Malaysia |
0.8901 |
Thailand |
0.9787 |
Tajikistan |
1.0152 |
|
Belarus |
0.8950 |
Lithuania |
0.9790 |
Serbia |
1.0161 |
|
Kyrgyz Republic |
0.9013 |
Afghanistan |
0.9827 |
Indonesia |
1.0203 |
|
Cambodia |
0.9051 |
Philippines |
0.9898 |
Bahrain |
1.0208 |
|
Maldives |
0.9143 |
Brunei Darussalam |
0.9931 |
Sri Lanka |
1.0252 |
|
Vietnam |
0.9165 |
Slovak Republic |
0.9965 |
India |
1.0278 |
|
Bosnia and Herzegovina |
0.9248 |
Israel |
0.9970 |
Uzbekistan |
1.0287 |
|
Jordan |
0.9256 |
Moldova |
0.9982 |
Latvia |
1.0287 |
|
Lao PDR |
0.9344 |
Bulgaria |
1.0034 |
Estonia |
1.0330 |
|
Singapore |
0.9376 |
Russian Federation |
1.0044 |
Kazakhstan |
1.0450 |
|
Lebanon |
0.9426 |
Turkey |
1.0052 |
Mongolia |
1.0461 |
|
United Arab Emirates |
0.9462 |
Pakistan |
1.0063 |
Azerbaijan |
1.0500 |
|
Georgia |
0.9601 |
Kuwait |
1.0074 |
Qatar |
1.0586 |
|
Poland |
0.9625 |
Bangladesh |
1.0097 |
Iran, Islamic Rep. |
1.0773 |
|
Myanmar |
0.9666 |
Ukraine |
1.0112 |
Bhutan |
1.1493 |
|
Nepal |
0.9668 |
Oman |
1.0144 |
|||
Hungary |
0.9677 |
Egypt, Arab Rep. |
1.0145 |
|||
Slovenia |
0.9780 |
Saudi Arabia |
1.0150 |
|||
In this study, we drawn on the suggestion of Liu and Jiang (2002) to divide the trade partners into three categories according to the export trade potential coefficient, with ratio greater than or equal to 1.2 belonging to the "potential reconstruction type", ratio between 0.8 and 1.2 belonging to the "potential expansion type", and ratio less than or equal to 0.8 belonging to the "great potential type".
From table 7, the trade potential coefficient for each BRI countries in 2022 are calculated and all 52 countries are between 0.8 to 1.2. On the one hand, this means that all BRI countries are regarded as the “potential expansion type” to Sichuan. There is no trade potential below 0.8 which indirectly proves that the implementation of the BRI policy is effective as the promotion of trade agreements and bilateral trade exchanges have built good cooperative relations between Sichuan and BRI countries. On the other hand, there is also no trade potential higher than 1.2, which means the potential of Sichuan's export development with BRI partners has not been fully exploited. The coefficient being smaller, the trade potential will be greater. For instance, the greatest trade potential of Sichuan goes to Malaysia. Referring to the method of Fang and Ma (2018), we divide the fifty-three BRI countries into six regions as exhibited in Table 8 and calculate the average trade potential of each region.
Table 8. Regional trade potential along the Belt and Road
Region |
Countries |
Average trade potential |
Central Asia |
Kazakhstan, Kyrgyz Republic, Tajikistan, Uzbekistan |
0.99754 |
Southeast Asia |
Brunei Darussalam, Myanmar, Cambodia, Indonesia, Lao PDR, Malaysia, Philippines, Singapore, Thailand, Vietnam |
0.95322 |
Mongolia and Russia Region |
Mongolia, Russian Federation |
1.02526 |
South Asia |
Afghanistan, Bangladesh, Bhutan, India, Maldives, Nepal, Pakistan, Sri Lanka |
1.01024 |
West Asia and Middle East |
Bahrain, Iran, Islamic Rep., Israel, Jordan, Kuwait, Lebanon, Oman, Qatar, Saudi Arabia, Turkey, United Arab Emirates, Yemen, Rep. , Egypt, Arab Rep., Georgia, Azerbaijan |
1.00249 |
Central and Eastern Europe |
Bulgaria, Hungary, Poland, Estonia, Latvia, Lithuania, Belarus, Moldova, Ukraine, Slovenia, Slovak Republic, Bosnia and Herzegovina, Serbia, Montenegro |
0.97960 |
Above all, it is notable that among the top 10 most potential trading partners, half of them (Malaysia, Cambodia, Vietnam, Lao PDR, Singapore) are ASEAN countries. As demonstrated in Table 7, Southeast Asia is the region with the largest trade potential in the case of Sichuan. This demonstrates the strategical significance of ASEAN countries to Sichuan’s exports considering the specific geographical location of Sichuan province. Because Sichuan locates in the south west of China and is regarded as the open hub to southeast Asia. Overall, the “potential expansion type” countries already have a good basis for trading with Sichuan, but perhaps due to historical, political or geographical reasons and Sichuan being a less developed area in China, the trade potential has not been fully exploited. Therefore, to develop trade relations with this type of countries, Sichuan on the one hand needs to strengthen communication and exchanges, continue to deepen economic cooperation and remove trade obstacles to fully tap the potential. On the other hand, it is also essential for Sichuan enterprises and government to cultivate new elements of trade potential.
5. Conclusions and Suggestions
5.1. Conclusions
Based on the panel data of Sichuan's exports to the fifty-three countries along the Belt and Road from 2011 to 2022, eleven explanatory variables (economic development level of Sichuan Province and trading countries, distance between Sichuan and trading countries, population of trading country, foreign merchant participation of Sichuan, exchange rate of RMB, human capital level in Sichuan, scientific and technology level in Sichuan, industry structure of Sichuan, infrastructure level of Sichuan and tariff level of trading countries) are tested, using the expanded trade gravity model, to explore the significant influencing factors of Sichuan’s exports to the BRI countries. According to the final model, the theoretical export value of Sichuan's exports to BRI countries in 2022 was calculated, and the trade type of each country was determined by the ratio of trade potential coefficient. The results show that:
1 The economic development level of both Sichuan and BRI countries has significant positive correlation with the export volume while the distance, foreign merchant participation in Sichuan, exchange rate of RMB and human Capital level of Sichuan are significantly negative correlated with the exports. The influence from the population of trading countries, scientific and technological development level of Sichuan, industry structure of Sichuan, infrastructure level of Sichuan and tariff barrier of trading countries are not significant. Judging from the regression coefficient, the human capital level, the economic development level of both Sichuan and BRI countries have relatively larger influence on the export volume. The impacts from the distance, foreign merchant participation in Sichuan, exchange rate of RMB are comparatively smaller.
2 In the export trading between Sichuan and the BRI countries, all of the trading countries’ trade potential have not been fully developed notwithstanding the existing optimistic trading foundation. It is necessary for Sichuan to further remove trade barriers and cultivate new elements of trade potential to further expand the export volume.
5.2. Suggestions
Based on above research, this paper believes that in order to deepen the economic exchanges between Sichuan and BRI countries, expand bilateral trade, and explore the international market, further efforts are recommended for the Sichuan government from the following aspects:
1 Keep strengthening the incentives of exports. The economic development level of both Sichuan and the trading countries have significant positive impacts on the exports volume, while the promotion effect of Sichuan's own economic scale is greater. Therefore, Sichuan should maintain a good economic development trend to promote exports. The Sichuan government need to continue to deepen the reform of the domestic economic structure, strengthen technological innovation, optimize industrial structure, maintain long-term and stable economic growth of Sichuan province, and consequently exert its own economic strength to drive exports. Next the Sichuan government should attach importance to building deeper relations with neighboring countries considering its geographic location and give full play to factors such as geographical proximity, cultural affinity and language similarity in promoting bilateral trades. Lastly it is necessary to attach importance to the role of various non-governmental organizations and other social groups, and to promote the smooth flow of trade with cultural exchanges as a link.
2 Addressing the negative factors of exports. Geographical distance will increase the cost of communication and transportation between both parties of trades, and hinder the development of exports. This objective limitation cannot be changed, but it can be offset by improving the transportation convenience of both sides. For Sichuan, the China-Europe railway linking Chengdu and Europe has been operated for ten years from 2013. According to the report by Ye and Song (2023), the Chengdu-Europe international railway ran more than 4700 trains in 2022. The rail track is westward and goes through the BRI countries like Kazakhstan, Russia, Belarus and other countries and the destination is Lodz, Poland. Moreover, in terms of people-to-people connectivity, through the provision of more convenient visa services for business travelers, students, technical personnel, etc., to facilitate cross-border trade, cross-border education and cross-border technical exchanges and cooperation. Through fully taking advantages of these measures, the barrier effect of spatial distance is expected to be greatly weakened.
3 On the basis of the trade potential coefficient, different strategies should be adopted for different export markets. For instance, the ASEAN countries have relatively greater trade potential and require more attention to further expand the trade potential. On July 2023, the first Lanmei-Rong Europe Expressway operated, which connects the China-Laos Railway with the China-Europe freight train in Chengdu. The expressway starts from Rayong, Thailand, routes through Vientiane, Laos, to Chengdu International Railway Port via China-Laos Railway, and then continues the China-Europe train to Europe and arrives at the destination of Budapest, Hungary. This new railway line starts from southeast Asia area, which is the most potential trade region as identified, and ends in the central and eastern Europe, which is the region with the second largest trade potential. It is foreseeable that this railway line may represent great opportunity to boost the trade potential with the ASEAN countries as well as the central and eastern European countries. And it is crucial that the Sichuan government will attach strategical importance to operate this railway and use it as a breakthrough point to further explore its trade potential under this favorable policy environment cultivated by the BRI. For other BRI countries with higher potential coefficient, measures should also be taken to maintain the stability of exports and actively explore new growth areas. By stabilizing existing trade foundation and exploring emerging market potential, Sichuan can establish a diversified product exports market system.
References
[1]. Ai, S. (2021). Analysis of the new pattern of China’s foreign trade development under the background of the Belt and Road. Prices Monthly (Jiage Yuekan), 11, 58–63.
[2]. Anderson, J. (1979). A theoretical foundation for gravity equation. American Economic Review, 69(1), 106-116.
[3]. Central People's Government of China. (2023, January 13). In 2022, China's foreign trade imports and exports increased by 7.7%, and the total value exceeded 40 trillion yuan. https://www.gov.cn/xinwen/2023-01/13/content_5736830.htm
[4]. Chen, H. (2011). An empirical analysis of factors affecting the export of the high-tech products ——Based on the data of 14 provinces. The World of Survey and Research(Diaoyan Shijie), 3, 37–39.
[5]. Chen, B. (2023, January 16). Sichuan's foreign trade reached 1007.67 trillion yuan. Sichuan Daily. https://www.gov.cn/xinwen/2023-01/16/content_5737192.htm
[6]. Dai, X., & Yang, S. (2020). Foreign trade promotion effect of China’s “Belt and Road” Initiative. Economist (Jingji Xuejia), 6, 68–76.
[7]. De Soyres, F., Mulabdic, A., & Ruta, M. (2019). Common transport infrastructure: a quantitative model and estimates from the belt and road initiative. Policy Research Working Paper Series.
[8]. Deng, X., Zhu, H., Lu, Z., & Liu, X. (2017). The analysis of the integration of inland areas into the "Belt and Road" -- A case study of the "Europe-Chengdu +" strategy. Journal of Southwest Minzu University (Xinan Minzu Daxue Xuebao), 38(5), 121-125.
[9]. Dong, X., & Xiao, S. (2005). The quantitative analysis of effecting factors of exports of three eastern areas —— On Guangdong, Beijing, Zhejiang. International Economics and Trade Research (Guoji Jingmao Tansuo), 21(3), 4–7.
[10]. Fang, Y., & Ma, R. (2018). Potential and influencing factors of cultural trade between China and countries along the Belt and Road: An empirical study based on stochastic frontier gravity model. World Economy Studies (Shijie Jingji Yanjiu), 1, 112-121+136.
[11]. Herrero, A., & Xu, J. (2017). China’s Belt and Road Initiative: Can Europe expect trade Gains? China & World Economy, 25(6), 84–99.
[12]. Huang, Y. (2016). Understanding China's Belt & Road Initiative: motivation, framework and assessment. China Economic Review, 40, 314-321.
[13]. Huo, W. (2018). One belt, one road, Sichuan starts again, the future direction of Sichuan. Sichuan Provincial Conditions(Sichuan Shengqing), 7, 25–28.
[14]. Ji, W., & Ren, W. (2020). Influencing factors and trade potentials of sports goods export between China and the countries along "Belt and Road": A test based on the extended trade gravity model. Journal of Shanghai University of Sports (Shanghai Tiyu Xueyuan Xuebao), 44(4), 70–77.
[15]. Kong, Q., Chen, A., Shen, C., & Wong, Z. (2021). Has the belt and road initiative improved the quality of economic growth in china's cities? International Review of Economics & Finance, 76, 870-883.
[16]. Li, J., & Qiu, J. (2017). Research on China's export potential to APEC members and its influencing factors: An empirical test based on trade gravity model. Asia-pacific Economic Review (Yatai Jingji), 6, 5–13.
[17]. Li, S., & Wu, Y. (2018). The development strategy of cross-border E-commerce in Quanzhou area under the "One Belt and One Road" strategy. Proceedings of the 2018 1st International Conference on Internet and E-Business, 13–15.
[18]. Liu, Q., & Jiang, S. (2002). China's bilateral trade arrangement from the perspective of trade gravity model. Zhejiang Social Sciences (Zhejiang Shehui Kexue), 6, 17-20.
[19]. Lo, C. (2015). China’s silk road strategy. The International Economy, 29(4), 54–55.
[20]. Melecky, M., Roberts, M., & Sharma, S. (2019). The wider economic benefits of transport corridors: a policy framework and illustrative application to the China-Pakistan Economic Corridor. Cambridge Journal of Regions, Economy and Society, 12(1), 17–44.
[21]. Nugent, J., & Lu, J. (2021). China's outward foreign direct investment in the belt and road initiative: what are the motives for Chinese firms to invest? China Economic Review, 68
[22]. Poyhonen, P. (1963). A tentative model for the volume of trade between countries. Weltwirtschafliches Archive, 90 (1), 93-100.
[23]. Rolland, N. (2017). China's “Belt and Road Initiative”: underwhelming or game-changer? Washington Quart, 40 (1), 127–142.
[24]. Shao, J. (2017). The influencing factors of china’s service exports to high-income economies: An empirical study using gravity model and random-effect panel data model. Economic Survey (Jingji Jingwei), 34 (1), 69–74.
[25]. Shi, W. (2008). China's bilateral trade arrangement from the perspective of trade gravity model. Market Modernization, 14, 354-355.
[26]. Tinbergen, J. (1962). Shaping the World Economy, Appendix VI: An Analysis of World Trade Flows. New York: The Twentieth Century Fund.
[27]. Wang, J. (2007). An empirical analysis of the factors influencing the export of Xinjiang. HLJ Foreign Economic Relations&Trade(Heilongjiang Duiwai JIngmao), 5, 48–49.
[28]. Wang, J., & Qu, L. (2022). The impact of the "Belt and Road" construction on the exports between China and countries along the routes. Times of Economy & Trade (Shidai Jingmao), 19 (10), 71–76.
[29]. Wang, M., Qiu, Q., & Choi, C. (2019). How will the Belt and Road initiative advance China’s exports? Asia Pacific Business Review, 25 (1), 81–99.
[30]. Wang, R. (2011). Study on the correlation between foreign direct investment and import and export trade in Sichuan Province. Economic Research Guide (Jingji Yanjiu Daokan), 7, 189-190.
[31]. Wu, X., & Xiang, M. (2019). The empirical analysis on the influence of “Belt and Road” strategy on the development of small and medium-sized processing trade enterprises in Chengdu. Journal of Chengdu Technological University (Chengdu Gongye Xueyuan Xuebao), 22 (1), 82-89.
[32]. Yao, L. (1998). Empirical analysis of influencing factors of China's foreign trade. Statistical Research (Tongji Yanjiu), 5, 26–30.
[33]. Ye, Y., & Song, J. (2023, April 26). Run! Towards the dazzling light of the "Belt and Road", towards the bright future of more than 130 cities. Chengdu Commercial Daily, https://baijiahao.baidu.com/s?id=1764227402521359451&wfr=spider&for=pc
[34]. Yu, J., & Ge, C. (2023). Trade facilitation and domestic value - Added rates of Exports: Empirical analysis based on countries along the Belt and Road. Finance and Trade Research (Caimao Yanjiu), 34 (2), 26-40.
[35]. Zheng, Y., & Ju, L. (2007). Theoretical and empirical analysis of the influencing factors of foreign trade export in Shandong Province. Shandong Social Sciences (Shandong Shehui Kexue), 5 (5), 128–132.
[36]. Zhou, K., Kumar, S., Lu, F., Fang, Q., & Yu, L. (2022). Has the Belt and Road Initiative improved the quality of food imported by Chinese enterprises? China & World Economy, 30(2), 60–83.
Cite this article
Ran,Y.;Thananchana,A. (2024). The Influencing Factors of Exports of Sichuan under the Belt and Road Initiative: An Empirical Study Based on the Extended Trade Gravity Model. Journal of Applied Economics and Policy Studies,4,1-13.
Data availability
The datasets used and/or analyzed during the current study will be available from the authors upon reasonable request.
Disclaimer/Publisher's Note
The statements, opinions and data contained in all publications are solely those of the individual author(s) and contributor(s) and not of EWA Publishing and/or the editor(s). EWA Publishing and/or the editor(s) disclaim responsibility for any injury to people or property resulting from any ideas, methods, instructions or products referred to in the content.
About volume
Journal:Journal of Applied Economics and Policy Studies
© 2024 by the author(s). Licensee EWA Publishing, Oxford, UK. This article is an open access article distributed under the terms and
conditions of the Creative Commons Attribution (CC BY) license. Authors who
publish this series agree to the following terms:
1. Authors retain copyright and grant the series right of first publication with the work simultaneously licensed under a Creative Commons
Attribution License that allows others to share the work with an acknowledgment of the work's authorship and initial publication in this
series.
2. Authors are able to enter into separate, additional contractual arrangements for the non-exclusive distribution of the series's published
version of the work (e.g., post it to an institutional repository or publish it in a book), with an acknowledgment of its initial
publication in this series.
3. Authors are permitted and encouraged to post their work online (e.g., in institutional repositories or on their website) prior to and
during the submission process, as it can lead to productive exchanges, as well as earlier and greater citation of published work (See
Open access policy for details).
References
[1]. Ai, S. (2021). Analysis of the new pattern of China’s foreign trade development under the background of the Belt and Road. Prices Monthly (Jiage Yuekan), 11, 58–63.
[2]. Anderson, J. (1979). A theoretical foundation for gravity equation. American Economic Review, 69(1), 106-116.
[3]. Central People's Government of China. (2023, January 13). In 2022, China's foreign trade imports and exports increased by 7.7%, and the total value exceeded 40 trillion yuan. https://www.gov.cn/xinwen/2023-01/13/content_5736830.htm
[4]. Chen, H. (2011). An empirical analysis of factors affecting the export of the high-tech products ——Based on the data of 14 provinces. The World of Survey and Research(Diaoyan Shijie), 3, 37–39.
[5]. Chen, B. (2023, January 16). Sichuan's foreign trade reached 1007.67 trillion yuan. Sichuan Daily. https://www.gov.cn/xinwen/2023-01/16/content_5737192.htm
[6]. Dai, X., & Yang, S. (2020). Foreign trade promotion effect of China’s “Belt and Road” Initiative. Economist (Jingji Xuejia), 6, 68–76.
[7]. De Soyres, F., Mulabdic, A., & Ruta, M. (2019). Common transport infrastructure: a quantitative model and estimates from the belt and road initiative. Policy Research Working Paper Series.
[8]. Deng, X., Zhu, H., Lu, Z., & Liu, X. (2017). The analysis of the integration of inland areas into the "Belt and Road" -- A case study of the "Europe-Chengdu +" strategy. Journal of Southwest Minzu University (Xinan Minzu Daxue Xuebao), 38(5), 121-125.
[9]. Dong, X., & Xiao, S. (2005). The quantitative analysis of effecting factors of exports of three eastern areas —— On Guangdong, Beijing, Zhejiang. International Economics and Trade Research (Guoji Jingmao Tansuo), 21(3), 4–7.
[10]. Fang, Y., & Ma, R. (2018). Potential and influencing factors of cultural trade between China and countries along the Belt and Road: An empirical study based on stochastic frontier gravity model. World Economy Studies (Shijie Jingji Yanjiu), 1, 112-121+136.
[11]. Herrero, A., & Xu, J. (2017). China’s Belt and Road Initiative: Can Europe expect trade Gains? China & World Economy, 25(6), 84–99.
[12]. Huang, Y. (2016). Understanding China's Belt & Road Initiative: motivation, framework and assessment. China Economic Review, 40, 314-321.
[13]. Huo, W. (2018). One belt, one road, Sichuan starts again, the future direction of Sichuan. Sichuan Provincial Conditions(Sichuan Shengqing), 7, 25–28.
[14]. Ji, W., & Ren, W. (2020). Influencing factors and trade potentials of sports goods export between China and the countries along "Belt and Road": A test based on the extended trade gravity model. Journal of Shanghai University of Sports (Shanghai Tiyu Xueyuan Xuebao), 44(4), 70–77.
[15]. Kong, Q., Chen, A., Shen, C., & Wong, Z. (2021). Has the belt and road initiative improved the quality of economic growth in china's cities? International Review of Economics & Finance, 76, 870-883.
[16]. Li, J., & Qiu, J. (2017). Research on China's export potential to APEC members and its influencing factors: An empirical test based on trade gravity model. Asia-pacific Economic Review (Yatai Jingji), 6, 5–13.
[17]. Li, S., & Wu, Y. (2018). The development strategy of cross-border E-commerce in Quanzhou area under the "One Belt and One Road" strategy. Proceedings of the 2018 1st International Conference on Internet and E-Business, 13–15.
[18]. Liu, Q., & Jiang, S. (2002). China's bilateral trade arrangement from the perspective of trade gravity model. Zhejiang Social Sciences (Zhejiang Shehui Kexue), 6, 17-20.
[19]. Lo, C. (2015). China’s silk road strategy. The International Economy, 29(4), 54–55.
[20]. Melecky, M., Roberts, M., & Sharma, S. (2019). The wider economic benefits of transport corridors: a policy framework and illustrative application to the China-Pakistan Economic Corridor. Cambridge Journal of Regions, Economy and Society, 12(1), 17–44.
[21]. Nugent, J., & Lu, J. (2021). China's outward foreign direct investment in the belt and road initiative: what are the motives for Chinese firms to invest? China Economic Review, 68
[22]. Poyhonen, P. (1963). A tentative model for the volume of trade between countries. Weltwirtschafliches Archive, 90 (1), 93-100.
[23]. Rolland, N. (2017). China's “Belt and Road Initiative”: underwhelming or game-changer? Washington Quart, 40 (1), 127–142.
[24]. Shao, J. (2017). The influencing factors of china’s service exports to high-income economies: An empirical study using gravity model and random-effect panel data model. Economic Survey (Jingji Jingwei), 34 (1), 69–74.
[25]. Shi, W. (2008). China's bilateral trade arrangement from the perspective of trade gravity model. Market Modernization, 14, 354-355.
[26]. Tinbergen, J. (1962). Shaping the World Economy, Appendix VI: An Analysis of World Trade Flows. New York: The Twentieth Century Fund.
[27]. Wang, J. (2007). An empirical analysis of the factors influencing the export of Xinjiang. HLJ Foreign Economic Relations&Trade(Heilongjiang Duiwai JIngmao), 5, 48–49.
[28]. Wang, J., & Qu, L. (2022). The impact of the "Belt and Road" construction on the exports between China and countries along the routes. Times of Economy & Trade (Shidai Jingmao), 19 (10), 71–76.
[29]. Wang, M., Qiu, Q., & Choi, C. (2019). How will the Belt and Road initiative advance China’s exports? Asia Pacific Business Review, 25 (1), 81–99.
[30]. Wang, R. (2011). Study on the correlation between foreign direct investment and import and export trade in Sichuan Province. Economic Research Guide (Jingji Yanjiu Daokan), 7, 189-190.
[31]. Wu, X., & Xiang, M. (2019). The empirical analysis on the influence of “Belt and Road” strategy on the development of small and medium-sized processing trade enterprises in Chengdu. Journal of Chengdu Technological University (Chengdu Gongye Xueyuan Xuebao), 22 (1), 82-89.
[32]. Yao, L. (1998). Empirical analysis of influencing factors of China's foreign trade. Statistical Research (Tongji Yanjiu), 5, 26–30.
[33]. Ye, Y., & Song, J. (2023, April 26). Run! Towards the dazzling light of the "Belt and Road", towards the bright future of more than 130 cities. Chengdu Commercial Daily, https://baijiahao.baidu.com/s?id=1764227402521359451&wfr=spider&for=pc
[34]. Yu, J., & Ge, C. (2023). Trade facilitation and domestic value - Added rates of Exports: Empirical analysis based on countries along the Belt and Road. Finance and Trade Research (Caimao Yanjiu), 34 (2), 26-40.
[35]. Zheng, Y., & Ju, L. (2007). Theoretical and empirical analysis of the influencing factors of foreign trade export in Shandong Province. Shandong Social Sciences (Shandong Shehui Kexue), 5 (5), 128–132.
[36]. Zhou, K., Kumar, S., Lu, F., Fang, Q., & Yu, L. (2022). Has the Belt and Road Initiative improved the quality of food imported by Chinese enterprises? China & World Economy, 30(2), 60–83.