


1 Introduction
1.1 Background
1.1.1 Current Development Trends in the Charging Pile Industry
Currently, the charging pile industry is undergoing an unprecedented period of rapid development, closely related to the flourishing global electric vehicle market. The proliferation of electric vehicles has become a global phenomenon, with their numbers showing exponential growth over the past few years. According to the latest report by the International Energy Agency (IEA), it is predicted that by 2030, the world will need at least millions of charging stations to meet this growing demand. This trend not only highlights the rapid development of the electric vehicle industry but also underscores the importance of charging infrastructure, particularly charging piles. With the widespread adoption of electric vehicles, the demand for charging infrastructure is also rapidly increasing, bringing new opportunities and challenges to the charging pile industry.
In the Chinese market, the development trend of the charging pile industry is particularly evident. Charging piles are the foundation and guarantee for the popularization of new energy vehicles. As a new type of infrastructure, they are essential for building a new power system centered on new energy and achieving the goal of "carbon peaking and carbon neutrality". According to the requirements of relevant national departments, the current reasonable ratio of vehicles to charging piles should reach 3:1. However, as of the end of 2022, the ratio of new energy vehicles to public charging piles in China was 6.8:1, and the ratio to private charging piles was close to 3.7:1, indicating a significant development space in the market. Especially with the rapid increase in the number of new energy vehicles in China, the gap in charging pile construction is still widening. By the end of June 2023, China had cumulatively built more than 6.6 million various types of charging piles, a year-on-year increase of 69.8%. This achievement has made China's charging infrastructure one of the largest in the world in terms of quantity, coverage area, and vehicle service.
The geometric growth of the charging pile market in the future can also be evidenced by the rapid growth of the number of new energy vehicles in China. At the 18th China Automobile Industry Forum in 2023, Miao Wei, a member of the National Committee of the Chinese People's Political Consultative Conference, vice chairman of the Economic Committee, and former Minister of Industry and Information Technology, stated that in 2017, China's sales of new energy vehicles were only 0.777 million units, while in 2022, the annual sales of new energy vehicles reached 6.887 million units. The penetration rate of new energy vehicles reached 28.2% in 2022, exceeding the target of 20% set for the "14th Five-Year Plan" three years in advance.
Looking at the global production and sales data of new energy vehicles, in 2022, the global sales of new energy vehicles reached 10.82 million units, a year-on-year increase of 61.6%. Among them, Europe sold over 2.3 million electric vehicles, and the United States sold 0.8 million units. According to data from the International Energy Agency (IEA), by 2025, the EU's stock of new energy vehicles will reach 21.9 million units, and by 2030, it will reach 58 million units. By 2025, the US' stock of new energy vehicles will reach 11 million units, and by 2030, it will reach 38.3 million units.
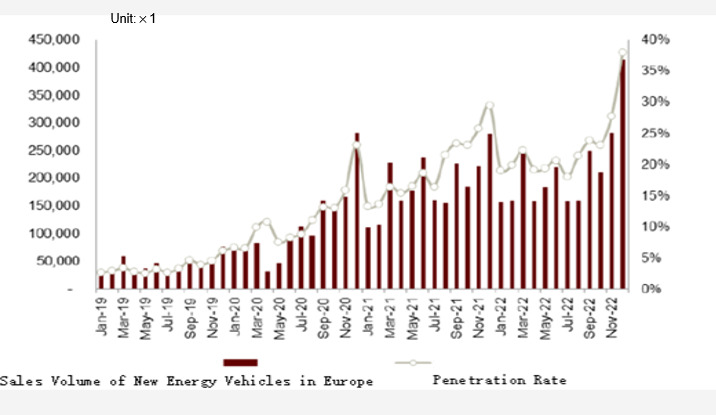
Figure 1. Sales Volume and Penetration Rate of New Energy Vehicles in Europe (Based on International Energy Agency (IEA) Data)
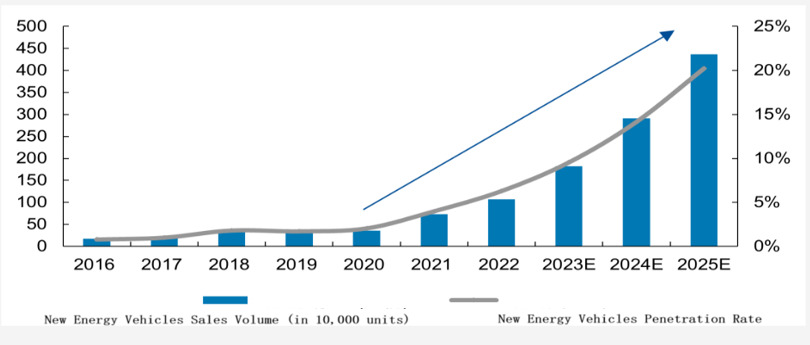
Figure 2. Sales Volume and Penetration Rate of New Energy Vehicles in North America (Data Source: Marklines)
However, the current number of charging piles in Europe and North America lags far behind the growth rate of electric vehicles, resulting in a serious imbalance in proportions. The public charging pile ratio in Europe is 16.4:1, while in the United States, it is 24:1. Compared to Europe, due to the later start of the new energy vehicle market in the United States, charging pile construction naturally lags behind. As of the end of 2021, the United States had a total of 130,700 charging piles, with 116,600 being public charging piles. In contrast, although the number of charging piles in Europe has maintained rapid growth, it still lags far behind the growth rate of electric vehicles. By the end of 2021, the number of charging piles in Europe had increased from 67,000 in 2015 to 356,000 in 2021, with a CAGR of 132%.
1.1.2 The Importance and Development Trends of Digital After-Sales Service in the Charging Pile Industry
With the rapid development of technology and the increasing expectations of consumers, digital after-sales service is gradually gaining importance in the charging pile industry. This is because charging piles, as the energy replenishment devices for electric vehicles, directly affect consumers' actual usage and experience of electric vehicles. Charging piles are similar to gas pumps at gas stations, but due to the majority of charging processes being operated by vehicle owners themselves, improper operations often affect the stability of the products, leading to equipment failures. Therefore, how to respond to and troubleshoot faults in a timely and fast manner has always been a challenge plaguing the industry, as seen with listed companies like Zhejiang Wanma frequently appearing on complaint blacklists. Consequently, an increasing number of charging pile companies are venturing into digital after-sales services with higher response speeds and better after-sales experiences, positioning digital after-sales as a selling point to promote product sales. This trend is reflected in many aspects such as remote fault diagnosis, real-time data analysis, and customer support, which have become the core of enhancing customer satisfaction and loyalty. Digital measures not only greatly enhance customer experience but also effectively improve operation and maintenance efficiency and cost-effectiveness. Particularly with the support and efforts of national policies, charging pile enterprises are more confident and willing to invest in digitalized deepened services, exploring the integration of digital after-sales services into their business models to better adapt to market demands and gain consumer recognition.
1.2 Research Objectives
This dissertation aims to delve into the practical application of digital after-sales services in the electric vehicle industry and its impact on customer purchasing behavior, with the following specific objectives:
(1) Explore the impact of digital after-sales services on customer satisfaction and loyalty: This study will evaluate the effectiveness of digital after-sales services in the electric vehicle industry, particularly how they significantly influence customer satisfaction and loyalty. The research will delve into customer behavioral responses and psychological dynamics when interacting with digital after-sales services, thereby revealing the crucial role of digital services in enhancing customer experience and building brand loyalty.
(2) Quantify the impact of digital services on major customers procurement decisions: Through systematic data collection and statistical analysis, this research aims to quantify the specific impact of digital after-sales services on key customer groups' purchasing intentions in the electric vehicle industry. The study will provide insights into how digital services affect major customer procurement decisions through case studies and empirical analysis, thereby scientifically and rigorously guiding electric vehicle charging infrastructure companies on how to more effectively utilize these services to improve sales performance and expand their market share.
(3) Provide strategic recommendations for the electric vehicle charging infrastructure industry: Based on research findings, this study will propose specific strategies and recommendations to help electric vehicle charging infrastructure companies maintain a competitive advantage in the market. These recommendations will focus on optimizing digital services to meet the growing market and customer demands, particularly digitizing product after-sales services, to support companies in achieving sustainable development in a rapidly changing market environment.
(4) Promote industry understanding and policy development: Through in-depth research on digital after-sales services in the electric vehicle charging infrastructure industry, this study will provide important reference for industry stakeholders and policymakers. It will help them gain a more comprehensive understanding of the current status of the industry, including user psychological states and expectations, innovation directions, and future development trends of products, technologies and services, and support the formulation of more effective industry policies to drive the healthy, orderly, and rapid development of the entire industry.
Overall, this dissertation research aims not only to deepen the academic community's understanding of digital after-sales services in the electric vehicle industry but also to provide practical guidance for industry practitioners to promote the healthy and sustainable development of the entire sector.
2 Literature Review
2.1 Overview of the Technology Acceptance Model (TAM)
The Technology Acceptance Model (TAM), developed by American scholar Davis based on the Theory of Reasoned Action (TRA), originated in the field of information systems/computer technology. It aims to explain and predict the degree to which people accept information technology. The model seeks to identify an effective behavioral pattern for explaining users' acceptance of new information systems and analyzes various factors influencing user acceptance. TAM provides a theoretical foundation for understanding the impact of external factors on users' beliefs, attitudes, and intentions, which in turn affect the use of technology. This model can be widely applied to explain or predict factors influencing the use of information technology. Since its initial proposal in 1986, TAM has become one of the most influential models in the field of information systems. In China, TAM is also one of the most commonly used analytical tools among scholars.
2.1.1 Overview of the Development and Basic Structure of the TAM Model
Davis (1989) proposed the TAM model based on the Theory of Reasoned Action (TRA) with the aim of explaining users' acceptance behavior towards information technology [1]. The model suggests that "Actual System Usage" is directly determined by "Behavioral Intention," while "Behavioral Intention" is influenced by both "Attitude towards Use" and "Perceived Usefulness." Additionally, "Attitude towards Use" is determined by "Perceived Usefulness" and "Perceived Ease of Use." Davis also introduced external variables, such as system characteristics and user training, suggesting that these variables indirectly influence users' intentions and behaviors by affecting "Perceived Usefulness" and "Perceived Ease of Use" [2].
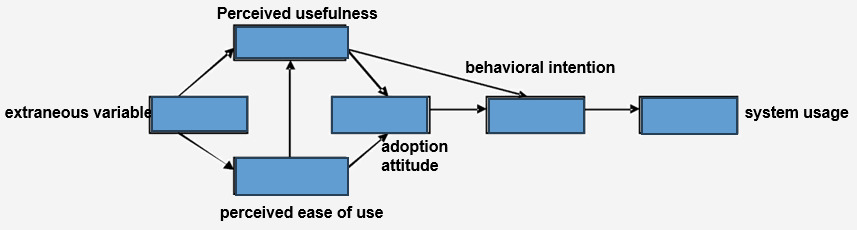
Figure 3. TAM Model
2.1.2 Overview of the Evolution and Improvement of the TAM Model
In 1993, Davis made significant revisions to the original TAM model. In this version, he eliminated the component of "Behavioral Intention" and proposed that "Attitude toward Use" directly determines the actual use of the system. This improvement simplified the model structure and emphasized the importance of "Perceived Usefulness" and "Perceived Ease of Use" in directly influencing "Attitude toward Use" [3]. This revision made the model more intuitive and applicable to real-world contexts, providing a clearer framework for understanding how users accept and use new technologies.
Continuing along the path of simplification and refinement, Davis further streamlined the model in 1996. In this version, he removed the "Attitude toward Use" of the system and directly identified "Perceived Usefulness" and "Perceived Ease of Use" as the key factors influencing the actual use of the system [4]. This change emphasized the direct and decisive role of these two perceptual factors in the process of technology acceptance, thereby providing researchers and practitioners with a more focused and specific research target.
Venkatesh and Davis made significant extensions to the original TAM model in 2000, proposing the TAM2 model, marking a pivotal turning point in TAM research. In the TAM2 model, they introduced the processes of social influence and cognitive instrumentality, which greatly enriched the theoretical depth and applicability of the model [5]. The social influence process includes concepts such as subjective norm and image, while also considering factors like voluntariness and experience as moderating variables. These newly introduced concepts emphasize the influence of colleagues, supervisors, and the social environment on individuals' technology acceptance behavior, thus breaking through the limitations of the original TAM model, which only considered perceived usefulness determined by external variables and perceived ease of use. The cognitive instrumentality process encompasses aspects such as job relevance, output quality, and result demonstrability, in addition to the existing ease of use. The introduction of this process not only deepens the understanding of the cognitive mechanisms behind technology acceptance behavior but also enables the TAM2 model to more comprehensively explain how users evaluate the usefulness of technology based on job requirements and actual performance. Through these conceptual extensions, the TAM2 model has exhibited significant differences in theoretical structure compared to the original TAM model. Venkatesh and Davis, through this improvement, not only enhanced the explanatory power of the TAM model but also provided researchers with a more complex and dynamic analytical framework to examine the diverse influencing factors of technology acceptance.
In the developmental trajectory of the TAM, the year 2003 marked a significant milestone. In that year, Venkatesh and Davis proposed the groundbreaking "Unified Theory of Acceptance and Use of Technology" (UTAUT), opening a new chapter in TAM research. The UTAUT model not only integrated the core arguments of multiple previous technology acceptance models but also introduced four new core constructs: Performance Expectancy (PE), Effort Expectancy (EE), Social Influence (SI), and Facilitating Conditions (FC). These constructs provided a more comprehensive perspective for understanding and predicting individuals' acceptance and use of technology. Moreover, the UTAUT model introduced moderating variables such as gender, age, experience, and voluntariness of use, further enhancing the model's predictive power and applicability across different populations and contexts [6]. The introduction of this theory not only enriched the theoretical framework of TAM academically but also provided important guidance for designing and implementing effective technology acceptance strategies in practice. The emergence of the UTAUT model reflects the trend of TAM research shifting from a single model to a more comprehensive and dynamic theoretical framework, laying a solid foundation for future research on technology acceptance and use.
2.1.3 Overview of the Application of TAM Model in Different Fields
In the field of education, a systematic literature review conducted by Granić and Marangunic (2019) highlighted the widespread application of the TAM model in assessing the acceptance of learning technologies. The research revealed that "Perceived Ease of Use" and "Perceived Usefulness" are critical factors influencing the acceptance of educational technologies [7]. This finding holds paramount significance for the design and implementation of educational technologies, emphasizing the need to consider user perception factors in the development and promotion of educational technologies. Neglecting the role of "Perceived Ease of Use" and "Perceived Usefulness" in technology-enhanced learning often results in suboptimal outcomes, undermining the efforts invested in education.
Within the realm of e-commerce, research by Gefen, Karahanna, and Straub (2004) demonstrated the utility of the TAM model in explaining consumers' acceptance behavior towards online shopping platforms. Similarly, "Perceived Usefulness" and "Perceived Ease of Use" emerged as key determinants of consumer acceptance in this domain [8]. These findings offer guidance for the design and optimization of e-commerce platforms, emphasizing the importance of enhancing user experience and meeting user needs to ensure platform acceptance. Failure to prioritize these aspects may significantly compromise platform acceptance and lead to a wearying shopping experience for users.
In product development, studies by Davis (1993) and Venkatesh and Davis (2000) utilized the TAM model to evaluate the usefulness and ease of use of products. For instance, case studies on smart payment cards demonstrated how the TAM model can be leveraged to assess and optimize the market acceptance of new products. These studies provide valuable insights for product designers, helping them understand and predict the acceptance of new products by target user groups. Following usability and usefulness principles in product development enables newly developed products to gain rapid market acceptance and sustain long-term viability.
Additionally, research by McCoy, Galletta, and King (2007) emphasized the need for caution when applying the TAM model in different cultural contexts. They found that the TAM model may not be universally applicable, particularly in cultures characterized by low uncertainty avoidance, high masculinity, high power distance, and high collectivism. This finding underscores the importance of considering cultural differences in technology acceptance research. In simpler terms, in a highly distorted market environment, people's actual perceptions of things may not fully align with their outward behavior. This means that their actions may not necessarily reflect their true inner preferences. In such a situation, the TAM model may not be applicable.
King and He (2006) conducted a meta-analysis of 88 studies, confirming the effectiveness and robustness of the TAM across various domains. Their comprehensive investigation covered various facets of society, with meticulous surveying and detailed analysis, exploring the influence of user types and usage types on TAM effectiveness. Their research further corroborated the wide applicability of the TAM model [10].
In conclusion, the widespread application of the TAM model not only demonstrates its adaptability and effectiveness across different fields but also provides valuable guidance for practical implementations in related domains. However, research on cross-cultural applications suggests that the TAM model may require adjustments to accommodate specific social and cultural factors in different cultural contexts.
2.2 Overview of the Development and Current Situation of Digital After-sales Service
A study by Li Yantong et al. (2023) in the field of after-sales service for electronic products introduced Unmanned technology and proposed an innovative unmanned assisted after-sales service optimization model [11]. This model not only enhances consumers' sense of novelty regarding product experiences but also increases satisfaction. Such digital after-sales service, by reducing the need for physical transportation and contact, enhances the highly valued service privacy and responsiveness, thereby promoting a high level of acceptance of the service environment's sustainability. This study breaks through the limitations of traditional after-sales service models, showcasing the potential of digital technology in improving service efficiency and environmental friendliness.
Another study by Galvani et al. (2022) focused on the application of Digital Servitization (DS) in the B2B environment, particularly in the after-sales service sector [12]. They emphasized the shift from traditional product and service-oriented strategies to service-centric strategies, reflecting the fundamental change in the operating model of enterprises in the digital age. Through digital servitization, enterprises can more effectively meet customer needs and enhance service quality, thereby gaining an advantage in competitive markets.
Yang Weixin (2022) conducted a case study on XYZ Group to explore the digital transformation of after-sales service in the home appliance manufacturing industry [13]. The research highlights the importance of digital tools in improving service efficiency and reducing operational costs. Through digital transformation, XYZ Group is able to respond to customer needs more quickly, provide higher quality services, and reduce both time and costs associated with the service process. By comparing data before and after the digital transformation at XYZ, the study confirms the necessity and effectiveness of such transformation.
Chen Jing's (2022) report focuses on the practices of brick-and-mortar stores in digital transformation, particularly in the realm of after-sales service [14]. The report points out that through the introduction of digital methods, even smaller brick-and-mortar stores can provide more personalized and efficient services, thereby enhancing the overall shopping experience for customers and effectively increasing customer stickness to the store. This practice also demonstrates that even in traditional retail environments, digital transformation can bring significant benefits.
Furthermore, the development of digital after-sales service also reveals some key challenges and opportunities. Research by J.D.Power Jundi (2020) indicates that although digital applications have gradually integrated into the after-sales service process, dealers still need to improve their capabilities in fully digitizing the process [15]. This finding underscores the areas that need to be strengthened during the digital transformation process, particularly in enhancing dealers' digital capabilities and integrating digital tools.
Cao Shaoping and Li Bin (2015) focused on establishing a digital information platform for after-sales service of medical equipment [16]. They emphasized the role of big data sharing resources in enhancing service management. Compared to cumbersome and inefficient manual service, computers process big data swiftly and with high accuracy, which is crucial for improving the efficiency and quality of after-sales service for medical equipment. Through digital platforms, medical institutions can more effectively manage equipment maintenance and repairs, thereby enhancing service quality and patient satisfaction, while significantly increasing enterprise profits.
In the aviation sector, Alex Derber and Li Xuan (2019) discussed the digitalization of the aviation after-sales service market. They pointed out that although digital applications have begun to appear in aviation after-sales services, the current applications are relatively independent and small-scale [17]. Most of them focus on digitized flight booking, such as passengers querying flight information, selecting seats, and purchasing tickets via the internet. Passengers also receive booking confirmations and electronic boarding passes via email or text messages, avoiding the cumbersome process of traditional paper documents. Some airports have also introduced self-service baggage check-in devices, allowing passengers to quickly complete check-in without waiting in line through simple operations. However, overall, there is still significant room for development in digital after-sales services in the aviation industry, especially in integrating and expanding digital services.
Research by Craig Gottlieb and Li Xuan (2019) indicated that the digitization of the after-sales service market will intensify mergers and acquisitions [18]. This trend reflects how digital transformation affects market structure and corporate strategies, especially in highly competitive market environments.
Zhang Zhiwei's (2002) research introduced the significance of a digital network after-sales service system based on home networks [19]. The study stated that society is rapidly moving towards informatization, and technological advancements enable home networking and the networking of household facilities. The implementation of this system not only enhances the convenience and efficiency of after-sales service but also provides home users with a more personalized and efficient service experience.
In summary, the application of digital after-sales services is increasing in various industries, from unmanned delivery to online booking platforms, various innovative technologies are reshaping the face of after-sales service. However, this field still faces many challenges, including technology integration, improving service quality, and enhancing digital capabilities. Future research and practices should focus on how to effectively utilize digital technology to improve the efficiency and quality of after-sales service while ensuring its sustainability and environmental friendliness. With the continuous advancement of digital technology, digital after-sales services are expected to bring more innovative opportunities to enterprises, enhancing customer satisfaction and brand loyalty.
2.3 Overview of Studies on the Purchasing Intention of Charging Piles
The research on the purchasing intention of charging piles involves multiple key factors, including the selection of charging pile locations, user behavior, charging demand, and grid safety. These factors collectively impact the efficiency and attractiveness of charging piles, thereby directly influencing the purchasing decisions of both enterprises and individual users.
Wu, H. and Niu, D. (2017) employed the Interpretive Structural Modeling (ISM) and Fuzzy Matrices Cross-Impact Multiplication Applied to Classification (FMICMAC) methods to conduct an in-depth analysis of various factors influencing the selection of locations for electric vehicle charging stations [20]. They particularly emphasized the importance of regional attributes and geographical environments, highlighting the influence of construction costs and annual operation and maintenance costs on the selection of charging station locations.
Schmidt, M., Staudt, P., and Weinhardt , C. (2020) focused on the impact of user behavior on charging at public destination charging stations. They found that user arrival and dwell times significantly affect demand coverage, especially in commercial areas and public spaces [21].
Kong, W., Luo, Y., Feng, G., Li, K., & Peng, H. (2019) proposed a novel method for rapid charging station location planning, which comprehensively considers economic issues related to operators, drivers, vehicles, traffic flow, and the power grid, as well as driver satisfaction with charging [22].
Zang, H., Fu, Y., Chen, M., Shen, H., Miao, L., Zhang, S., Wei, Z., & Sun, G. (2018) conducted a study by establishing a dual-layer planning model [23], considering the impact of charging station locations on user travel routes.
Zenginis, I., Vardakas, J. S., Zorba, N., & Verikoukis, C. (2016) analyzed the operation of fast-charging sations using a novel queuing model [25] and proposed a charging strategy to encourage drivers to limit their energy demands.
Bayram, I. S., Tajer, A., Abdallah, M., & Qaraqe, K. (2015) proposed two frameworks aimed at designing and developing charging stations for different customer categories with varying charging preferences, demands, and technologies [26].
These studies indicate that the purchasing intention of charging piles is influenced by various factors, including cost, geographical location, user behavior, charging demand, and grid safety. To enhance the efficiency and attractiveness of charging piles, it is essential to comprehensively consider these factors and scientifically plan and optimize the location and services of charging stations. An in-depth understanding of user behavior and accurate prediction of charging demand are crucial for the successful operation of charging stations. Research on the purchasing intention of charging piles requires interdisciplinary approaches that combine knowledge from geography, economics, behavioral science, and engineering technology to achieve the effective deployment and management of electric vehicle charging infrastructure. These studies provide valuable theoretical and practical guidance for the future development of charging piles, which is significant for driving the sustainable development of the electric vehicle industry.
2.4 Relevant Research Gaps
Although existing literature has provided insightful perspectives in the areas of TAM, digital after-sales services, and charging pile purchasing intention, there are still significant research gaps. In the TAM domain, despite the widespread application of the model, further exploration is needed regarding its adaptability across different cultural backgrounds and its responsiveness to the rapid development of emerging technologies. Additionally, there is relatively limited research on the underlying psychological and social factors influencing users' acceptance of technology. Regarding digital after-sales services, existing studies have mostly focused on short-term effects, with less research on their long-term impacts and sustainability. Furthermore, there is a lack of in-depth analysis of customer experience optimization strategies and industry-specific applications. In the context of charging pile purchasing intention, although technological and market factors have been studied to some extent, research on the role of macroscopic factors such as environmental policies, regulatory frameworks, specific needs and preferences of different user groups, and emerging charging service technologies, especially as more companies explore the integration of digital maintenance as a product competitiveness factor, remains limited. Additionally, research on the influence of relevant factors on market acceptance is still lacking. These research gaps not only indicate the directions for future studies but also provide opportunities for further deepening understanding in these areas.
3 Research Model and Hypotheses
3.1 Research Model
This study will adopt the Technology Acceptance Model (TAM) as the foundational framework, adapting and extending it to suit the context of digitalized after-sales service in the electric vehicle charging pile domain. Proposed by Davis in 1989, the TAM is primarily used to elucidate how users accept and utilize a new technology. At the core of the model lie two main factors: Perceived Usefulness (PU) and Perceived Ease of Use (PEU). In this study, the TAM model will be extended to include factors specific to digitalized after-sales services, which enhance the comprehensiveness of Service Quality, Customer Support, and Customer Satisfaction, thereby enabling a more comprehensive analysis of the procurement willingness of major customers. The theoretical model of this study is illustrated in Figure 4:
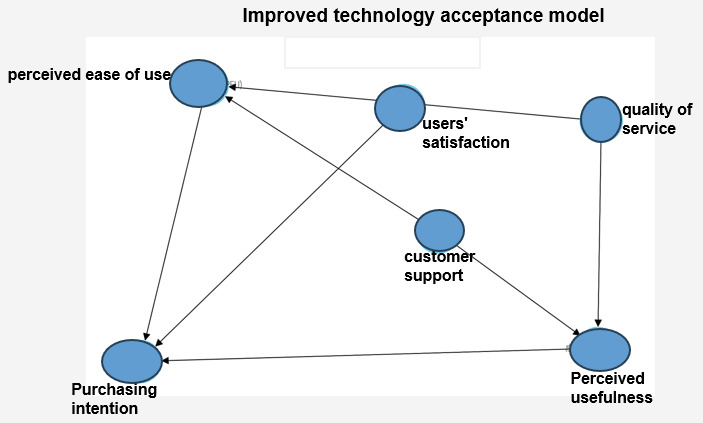
Figure 4. Improved Technology Acceptance Model (TAM)
3.2 Research Hypotheses
Based on the theoretical framework of the TAM, this study has made necessary extensions and adjustments to adapt to the specific context of digitalized after-sales service for charging piles. On this basis, the following hypotheses are proposed to explore and explain how digitalized after-sales service influences the purchasing intention of major customers.
The impact of Perceived Ease of Use on purchasing intention: This research hypothesizes that the Ease of Use of digitalized after-sales service has a positive impact on the purchasing intention of large customers. Specifically, when major customers perceive the digitalized after-sales service as easy to operate and master, they are more inclined to choose to purchase charging pile products from GK Company. This hypothesis is based on the concept of Perceived Ease of Use in the TAM model, emphasizing the influence of user experience simplicity and intuitiveness on purchasing decisions.
The impact of Perceived Usefulness on purchasing intention: Another core hypothesis is that the higher the Perceived Usefulness of digitalized after-sales service by major customers, the stronger their purchasing intention. This means that customers are more likely to make purchases when they believe that the service can significantly improve the performance or operational efficiency of charging piles. This hypothesis highlights the important role of Usefulness in technology acceptance and purchasing behavior.
(1) The impact of Service Quality on Perceived Usefulness and Ease of Use: This study further considers the impact of Service Quality based on digitalized after-sales service on Perceived Usefulness and Ease of Use. It is assumed that high-quality digitalized after-sales service can not only improve the actual performance of the service but also enhance customers' perception of service Ease of Use, thereby promoting the formation of purchasing decisions to a certain extent.
(2) The mediating role of Customer Satisfaction: Finally, this study explores the mediating role of Customer Satisfaction in the relationship between Perceived Usefulness/Ease of Use of digitalized after-sales service and the purchasing intention of major customers. This hypothesis is based on the understanding of Customer Satisfaction as a key mediating variable, bridging the relationship between Service Quality and final purchasing behavior.
The proposal of these hypotheses not only delves into the application of the TAM model in contemporary business environments but also reflects the increasing importance of digital services in enterprise customer relationship management. Through empirical analysis, this study aims to verify these hypotheses, aiming to provide a profound analysis of how to improve digitalized after-sales service to better meet the needs of major customers, thereby providing theoretical support and practical guidance for market strategies and service optimization in the charging pile industry.
4 Research Design
4.1 Research Methodology
4.1.1 Literature Research
The starting point of this thesis research is a comprehensive and in-depth literature research, aiming to build a solid theoretical foundation and form a complete research framework. This process involves a comprehensive examination of the existing literature on the TAM, including its applications in different industries and technological backgrounds, particularly in the practice of digitalized after-sales service in the electric vehicle charging pile industry. Additionally, we delve into the industry's development history, market dynamics, technological innovations, and challenges it faces, in order to deepen our understanding of how to better meet the needs of major customers through improving digitalized after-sales service. Through this method, we expect to reveal the key factors influencing the purchasing intention of large customers, integrating theoretical research with practical business practices to ensure the theoretical depth and practical relevance of the research results, thereby providing valuable discoveries for the service improvement and market strategy formulation in the charging pile industry.
4.1.2 Questionnaire Survey
In this study, we adopted a questionnaire survey as the main method of data collection, aiming to directly obtain detailed information about the purchasing intentions of major customers using digitalized after-sales services for charging piles. This questionnaire was meticulously designed by the authors of this paper and industry experts, aiming to assess and understand how several key variables—Perceived Usefulness, Perceived Ease of Use, Service Quality, and Customer Satisfaction—affect the purchasing decisions of major customers regarding charging pile products. The questionnaire includes both quantitative scoring items for statistical analysis and open-ended questions to collect deeper insights. To ensure the effectiveness of the questionnaire and the reliability of the results, we conducted a pre-test among a small subset of the target population and made necessary adjustments based on the feedback received. This approach not only ensures the scientific and systematic data collection but also ensures that the research results accurately reflect the actual views and needs of the target group, thereby providing strong support for the optimization of services and the formulation of market strategies in the electric vehicle charging pile industry.
4.1.3 Data Analysis
In this study, data analysis of the collected questionnaire data is conducted using a series of quantitative methods to ensure accuracy and scientific rigor. In the initial stage, descriptive statistical analysis is employed, which is crucial for revealing the basic characteristics of the sample and the distribution of key variables, laying the foundation for subsequent in-depth analysis. Subsequently, correlation analysis is used to explore the degree of association between different variables to understand their relationships. The core analysis involves regression analysis, which aims to validate research hypotheses and quantify the impact of various factors on purchasing intentions. Particularly, Customer Satisfaction will be considered as a potential mediating variable to deepen the understanding of its role in influencing the purchasing decision process. All these analyses will be conducted using mature statistical software such as SPSS or R to ensure the accuracy of data processing and the methodological rigor, thereby ensuring that the final research outcomes have strong practical value and provide robust data support for the development direction of technology and after-sales services in the charging pile industry.
4.2 Variable Definition and Measurement
4.2.1 Variable Definition
In the process of studying the relationship between TAM-based digital after-sales service for charging piles and the purchasing intention of major customers, several key variables have been identified. These variables are crucial for understanding and evaluating how digital after-sales service affects customer purchasing decisions. Table 1 summarizes the definitions of these key variables, including Perceived Ease of Use, Perceived Usefulness, Service Quality, and Purchasing Intention. The definitions of these variables are based not only on the classical theoretical framework of the TAM but also integrate a profound understanding of the current digital service environment. Through detailed definitions of these key variables, we aim to lay a solid theoretical foundation for subsequent data collection and analysis, ensuring the accuracy and scientific validity of the study.
Table 1. Key Variable Definition
Variable Name |
Definition |
Perceived Ease of Use (PEU) |
Subjective expectation of the effort required by users when using a specific system or service. |
Perceived Usefulness (PU) |
Subjective expectation of the improvement in work efficiency by users when using a specific system or service. |
Service Quality (SQ) |
Overall evaluation of service performance by users, including reliability, responsiveness, assurance, and empathy of the service. |
Purchasing Intention (PI) |
The likelihood of customers choosing a specific product or service in a certain period in the future. |
4.2.2 Variable Measurement
In the measurement of variables under investigation, we delve into the meticulous design of a series of questionnaire items to gauge key variables, including Perceived Ease of Use, Perceived Usefulness, Service Quality, and Purchasing Intention. The measurement of these variables is crucial for comprehending and evaluating the impact of digital after-sales services on the procurement decisions of major customers. This section elaborately delineates the measurement methods for each variable and demonstrates how this information is acquired through questionnaire surveys.
Within this section, our primary focus initially centers on Perceived Ease of Use (PEU), encompassing users' subjective evaluations of the ease of utilizing digital after-sales services, inclusive of their learning curves, the intuitiveness of user interfaces, and the need for additional technical support. Subsequently, we pivot to Perceived Usefulness (PU), examining how users perceive the role of digital after-sales services in enhancing the efficiency and reliability of charging piles. Furthermore, the measurement of Service Quality (SQ) will assess users' overall satisfaction with the services provided by GK Company, along with their perceptions of service responsiveness, professionalism, and system stability. Finally, the measurement of Purchasing Intention (PI) will aid in understanding users' likelihood of future purchases or recommendations of GK Company's products, as well as the importance of digital after-sales services in their procurement decisions.
Through these inquiries, this study not only enables a quantitative assessment of these variables but also facilitates an in-depth understanding of how they collectively influence users' procurement decision-making processes. These data serve as a robust foundation for subsequent analyses, aiding in elucidating the significance and impact of digital after-sales services in the charging pile industry. (See Table 2 for details). In the scoring design of this table, we adopt a 5-point scale, where scores of 1 to 5 represent varying degrees of intensity, with 1 indicating minimal intensity and 5 denoting maximal intensity.
Table 2. Measurement of Key Variables
Variable Category |
Questionnaire Question |
Perceived Ease of Use (PEU) |
1. How easy do you think digital after-sales service is to use? (On a scale of 1-5, 5 being very easy) 2. Is digital after-sales service easy to learn and operate quickly? (1-5, with 5 being very convenient) 3. Do you feel that you need additional technical support when using digital after-sales services? (On a scale of 1-5, 5 being completely unnecessary) 4. How effective do you think digital after-sales service is in providing guidance and help to users? (On a scale of 1-5, 5 being very good) 5. How often do you encounter technical problems when using digital after-sales services? (On a scale of 1-5, 5 being rare) 6. Is the accessibility of digital after-sales services convenient for you? (1-5, with 5 being very convenient) |
Perceived Usefulness (PU) |
1. To what extent do you think digital after-sales service plays a role in improving the efficiency of charging piles? 2. Does digital after-sales service help improve the reliability of charging piles? 3. Do you think whether digital after-sales service can effectively reduce the maintenance and breakdown time of charging piles? 4. What do you think of the utility of digital after-sales service in monitoring and maintaining the status of charging piles? 5. In your experience, has digital after-sales service helped improve the overall user experience of charging piles? 6. Do you agree that digital after-sales service is conducive to timely updating and optimizing the functions of charging piles? |
Service Quality (SQ) |
1. What is your overall satisfaction with the digital after-sales service provided by GK? 2. How does GK's digital after-sales service perform in terms of response speed and problem solving? 3. What do you think of the professional and technical level of GK's digital after-sales service? 4. How stable and reliable do you think the system is when using digital after-sales service? 5. Does GK meet your expectations for timeliness in dealing with urgent problems or failures? 6. What do you think of GK's performance in continuous improvement of digital after-sales service? |
Purchasing intention (PI) |
1. Will you consider buying or recommending GK charging pile products again in the future? 2. Will the quality of digital after-sales service affect your purchasing decisions for GK's products? 3. When considering the purchase of a new charging pile, is the digital after-sales service provided by GK a key factor in your decision? 4. If GK Company further improves its digital after-sales service, are you more inclined to choose its products? |
4.3 Questionnaire Survey
4.3.1 Design and Implementation of Questionnaire Survey
This study adopts a questionnaire survey as the core method for data collection. The primary purpose of the questionnaire is to gain a comprehensive understanding of the impact of digital after-sales services on the procurement decisions of major customers in the charging pile industry. This survey is meticulously designed, specifically targeting the digital after-sales services provided by GK Company, aimed at capturing the authentic viewpoints of major customers in the charging pile industry. Each question in the questionnaire is closely linked to the research objectives and hypotheses, ensuring the high relevance and goal orientation of the questionnaire content.
The questionnaire structure is divided into multiple sections, covering the collection of basic information to the assessment of key variables. These variables include Perceived Ease of Use, Perceived Usefulness, Service Quality, and Purchasing Intention, which are crucial for understanding and evaluating the impact of digital after-sales services. Each section consists of a series of carefully designed questions, aiming to comprehensively explore various aspects of digital after-sales services. Such a structure not only facilitates participants' understanding and response but also ensures the high quality and reliability of the data.
To maximize the effectiveness of the questionnaire, we paid special attention to the clarity of question wordings, simplicity of responses, and overall logical coherence. Furthermore, considering the diverse backgrounds and comprehension abilities of different audiences, we devoted efforts to the textual design of the questionnaire, striving to make it both easily understandable and capable of effectively collecting detailed information regarding the impact of digital after-sales services. These efforts will ensure that the survey accurately reflects the attitudes of the respondents, maximally enhancing the accuracy of our research and providing a solid data foundation for subsequent analysis and conclusions.
4.3.2 Questionnaire Distribution
This study plans to distribute approximately 200 paper survey questionnaires to the main partners and key customer groups of GK Company during the rest time for scheduled completion. These recipients mainly include relevant personnel or decision-makers from enterprises such as Zhenhua Heavy Industries, State Grid Corporation of China, Shijiazhuang Communications Investment Group, and China Electronics Corporation-Hikai Group. This quantity ensures that the survey covers various important partners while also considering possible low response rates.
We expect to retrieve at least 150 completed questionnaires, a quantity that ensures the representativeness of the survey results and the effectiveness of statistical analysis. To ensure the reliability and effectiveness of the data, we will screen the retrieved questionnaires, excluding incomplete or low-quality ones. Ultimately, we obtain at least 100 valid samples for in-depth analysis.
Through these carefully planned steps, we aim to ensure the breadth of the survey and the high quality of the data. By conducting questionnaire surveys among these key customer groups, this research can gain a deep understanding of the impact of digital after-sales services in different industries and application scenarios, thereby providing valuable experience for GK Company's service improvement and market strategy formulation in the charging station industry as a whole.
5 Empirical Analysis
5.1 Background Introduction
Hangzhou Guokong Electric Power Technology Co., Ltd. (referred to as "GK Company") was established in 2013 and entered the ranks of large-scale enterprises in 2017. The company's original main business was the research and development and production of intelligent power equipment and related products. It has now become a significant participant and leading technological innovator in the field of electric vehicle charging in China. With a registered capital of 33.35 million yuan, the company is a strategic partner of Fortune 500 companies such as State Grid Corporation of China, China Communications Construction Company, Huawei, and China Electronics Technology Group Corporation. Its business is deeply integrated, and it owns a cloud server with instant processing connected to China UnionPay's dedicated line. The company's intelligent power products have been highly praised at home and abroad, and it is a national-level high-tech enterprise.
Since 2015, the company has shifted its main business to the field of charging systems, developing charging pile equipment for aircraft, ships, electric vehicles, Industry 4.0 robots, etc., and providing backend cloud management services. Among them, electric vehicle charging piles are the main source of the company's business income, accounting for more than 60% of the total revenue. Currently, the demand for charging piles has formed a diversified pattern. Public charging piles are mainly government-led and enterprise-operated, meeting the public charging needs of a large number of new energy vehicle owners. Most public charging piles use DC fast charging piles. Private charging piles are mostly owned by vehicle owners themselves, installed in residential areas or properties, providing more convenient home charging services. Private charging piles generally use low-power AC charging piles. GK Company's products cover all types of charging piles. In addition, it also develops innovative charging piles for some special users, such as advertising space charging piles, parking barrier charging piles, stereo garage charging piles, mobile charging piles, etc., to continuously meet the diversified market demand.
In this study, the four companies involved in the survey exert significant influence in their respective fields, and their cooperation with GK Company is outlined as follows:
(1) In 2017, GK Company signed a contract with Zhenhua Heavy Industries for the supply of port charging equipment. Shanghai Zhenhua Heavy Industries Co., Ltd. (formerly known as Shanghai Zhenhua Port Machinery Co., Ltd., abbreviated as ZPMC) is a well-known enterprise in the heavy equipment manufacturing industry. Zhenhua Heavy Industries is a provider of 80% of the world's port machinery and equipment, with an annual output value exceeding 20 billion yuan, serving as a key supporting enterprise for the Belt and Road Initiative. In addition to product sales and installation services, Zhenhua Heavy Industries also manages the operation of numerous ports, including Gwadar Port and Djibouti Port. The normal operation of port machinery is essential for the normal throughput of containers, and Zhenhua Heavy Industries extensively uses unmanned AGV equipment to transport containers in port management. Under this circumstance, the normal operation of charging equipment is one of the guarantee measures for port operation. To facilitate maintenance, GK Company provides digital maintenance services for charging piles to its customers.
(2) In 2018, GK Company signed a charging pile supply contract with China Electronics Corporation-Hikai Group. China Electronics Corporation-Hikai Group Co., Ltd. is a core subsidiary of China Electronics Technology Group Corporation, owning three listed companies, Hikvision (002415), Phoenix Optics (600071), and EZVIZ (688475), as well as multiple technology companies. Headquartered in Hangzhou, it was designated as a provincial-level key laboratory in Zhejiang Province in 2018 and was selected as one of the "Hundred Technology Reform Demonstrative Enterprises" by the State-owned Assets Supervision and Administration Commission of the State Council in 2020. In 2021, it was recognized as a benchmark enterprise for "Scientific and Technological Innovation". China Electronics Corporation-Hikai Group undertakes a series of national key projects. GK Company provides charging piles for various parks and overseas smart poles, and its digital maintenance services provide strong technical support to China Electronics Corporation-Hikai Group.
(3) In 2019, GK Company signed a supply agreement with State Grid Corporation of China (State Grid). As a centrally administered state-owned sole proprietorship, State Grid is a key backbone enterprise directly managed by the central government, critical to the national economy and energy security. With its core business focusing on investment, construction, and operation of power grids, State Grid undertakes the fundamental mission of ensuring safe, economical, clean, and sustainable power supply. Operating across 27 provinces (autonomous regions, municipalities directly under the central government), covering over 88% of the national territory, and serving a population of over 1.1 billion people, State Grid is also established subsidiaries in countries and regions such as the Philippines, Brazil, Portugal, Australia, Italy, Greece, and China (Hong Kong). Consistently ranked among the top of the Fortune Global 500 list from 2016 to 2018, and as the top company in the Fortune China 500 list, it is the world's largest utility enterprise. In China, State Grid is a major player in the operation of charging facilities, with an annual procurement volume exceeding 500 million yuan. With a long-standing presence in the power industry, State Grid has extremely stringent requirements for product quality and standards. GK provides digital maintenance services for thousands of charging piles in public places and residential communities in Hangzhou for State Grid, ensuring rapid response and low fault complaints for its charging services.
(4) In 2023, GK Company established a joint venture with Shijiazhuang Communications Investment Group Co., Ltd., with Chinese capital holding 51% of the shares and GK Company holding 49%. Shijiazhuang Communications Investment Group is a large state-owned sole proprietorship company, with 8 subsidiaries under its jurisdiction, integrating investment and financing, development, construction, overall engineering consulting, and operation management of communication infrastructure. It includes communication investment and development companies, rail transit groups, municipal bus companies, expressway groups, highway and bridge construction groups, transportation design and consulting groups, transportation industry groups, and transportation real estate groups. Its business scope mainly covers investment, construction, operation management of communication infrastructure projects such as highways, expressways, and rail transit, as well as public transportation operations and comprehensive development of land along transportation routes. GK Company provides charging pile supply agreements and utilizes digital maintenance services for highways, public transportation, subways, and other facilities belonging to Shijiazhuang Communication Investment Group, effectively supporting the smooth operation of transportation hubs in the area.
Charging piles serve as energy replenishment devices for electric vehicles. Unlike refueling stations for conventional fuel vehicles, which are typically staffed by specialized personnel, the operation of charging piles is generally carried out by drivers or passengers themselves. However, due to this decentralized operation, incidents of misoperation and non-standard operation are frequent. Moreover, the placement of charging piles, often along roadsides and in other outdoor locations, exposes them to a high probability of damage. Furthermore, the technical complexity of charging piles far exceeds that of traditional fuel dispensers. Merely in terms of message communication, charging piles involve multiple components such as vehicle-to-pile communication and pile-to-backend communication. Additionally, charging piles incorporate numerous sensors within their structures, rendering them susceptible to damage. Consequently, after-sales service is crucial for ensuring their normal operation. GK Company's digitalized after-sales service for charging piles not only involves conventional equipment information management but also includes the following improvements: (1) System Expansion: Internally enhancing charging piles by installing more efficient control modules and communication modules. The backend software system sifts through the information transmitted by charging piles to identify fault codes, which are then compiled and sent to designated maintenance personnel via phone. This facilitates rapid response to repair needs at specified locations, with the technicians equipped with precise spare parts. (2) Shift from Routine Inspections to Targeted Maintenance for Major Customers**: This transition optimizes the allocation of human and material resources. (3) Enhanced Operational Uptime of Charging Equipment.
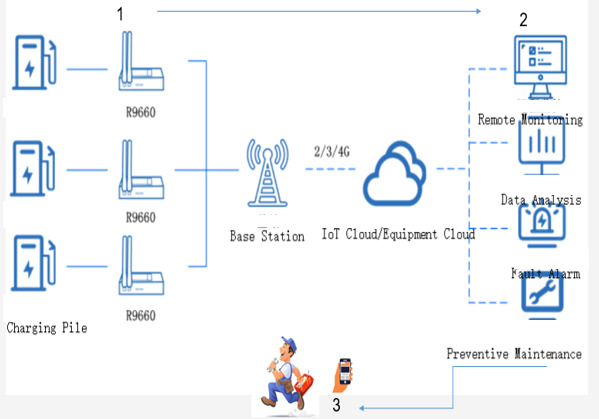
Figure 5. GK Company Charging Piles Digitalized After-sales Service Process Diagram (presented by Hangzhou Guokong Electric Power Technology Co., Ltd.)
Explanation of the Service Process Diagram:1) Charging piles equipped with communication modules continuously transmit real-time status updates to the backend through the internet. 2) The backend categorizes, identifies, and analyzes the received voluminous information, filtering out fault codes. It then analyzes the causes of faults, selects repair schemes, and provides recommendations. 3) The backend dispatches equipment fault information to maintenance engineers, specifying the location, equipment identification number, type of fault encountered, and suggesting repair solutions. Upon receiving instructions, engineers proceed to the site with the necessary repair tools and spare parts. 4)The backend monitors the repair progress remotely. 5) Once the repair is completed, the equipment resumes normal operation.
5.2 Data Analysis
5.2.1 Descriptive Statistical Analysis
5.2.1.1 Descriptive Statistical Analysis of the Sample
The sample collected for this study consists of a total of 100 samples, evenly distributed among the four companies described in Section 5.1 that collaborate with GK Corporation. These companies are Zhenhua Heavy Industries, China Electronics Corporation-Hikai Group, State Grid Corporation of China, and Shijiazhuang Communications Investment Group, with each contributing 25 samples. This equal distribution of samples reflects the balance of the survey results, enhancing the representativeness and reliability of the study and providing a solid foundation for further analysis and conclusions.
The four sample companies not only differ in their industry nature but also exhibit distinctive features in terms of scale and influence. The first three are central state-owned enterprises with a large number of controlled subsidiaries. The fourth is a super-large state-owned enterprise with extensive management domains. For example, Zhenhua Heavy Industries, as a key national equipment manufacturer and 80% of the world's port equipment supplier, focuses on port equipment supply and management, with its scale and industry position ensuring the critical operation of port machinery. China Electronics Corporation-Hikai Group, as a core enterprise in smart power production, has high demands for charging facilities in industrial parks and smart electric poles. State Grid Corporation of China, a giant in the power supply industry, plays a crucial role in the construction of charging facilities in public places and residential areas. Shijiazhuang Communications Investment Group has a wide range of business scope in transportation infrastructure, covering areas such as expressways, public transportation, and subways.
Through such sample selection, this study not only covers a broad perspective from different industries but also delves into the specific needs and feedback of companies of different scales and industry positions in digitalized after-sales services. This diversity of backgrounds provides rich firsthand data and valuable research perspectives, contributing to a comprehensive understanding of the subtle differences and unique requirements of different types of enterprises in digitalized after-sales services. Additionally, the diversified selection strategy of these samples adds more practicality and specificity to the recommendations proposed in this study, ensuring that the research outcomes can better meet the diverse needs and expectations of our partners. (See Figure 6 for details).
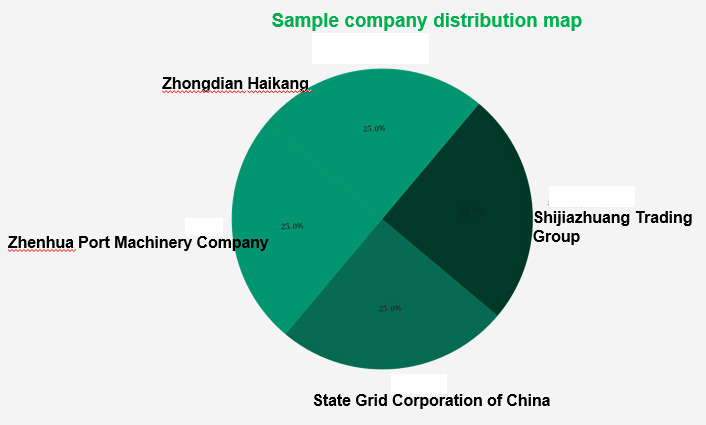
Figure 6. Distribution of Sample Companies
In this survey research, the sample collection process was extremely rigorous. We assigned both interviewers and supervisors to the survey, with one interviewer and one supervisor present simultaneously to ensure the authenticity of the data obtained. Furthermore, we conducted follow-up visits to some respondents afterward to reconfirm that the data provided truly reflected their intentions. A total of 100 survey data points were collected from samples occupying different positions and roles, including 20% from senior management of the surveyed units, 37% from middle management, 15% from technical personnel, and 28% from frontline employees. This diversified distribution of positions reflects the varied perspectives and demands on digitalized after-sales services from different hierarchical levels within the surveyed companies, ensuring the representativeness of the data. Specifically, senior management typically focuses on the impact of services on company strategic development and management efficiency, while middle management may pay more attention to service operational efficiency and management practices. Technical personnel tend to emphasize the technical details and innovation of services, whereas frontline employees directly experience the operational efficiency and practicality of services.
This comprehensive coverage of positions enables this study to integrate feedback from different levels and domains, providing GK Corporation with a holistic perspective on how to optimize digitalized after-sales services. This perspective encompasses not only strategic planning and management adjustments but also technical innovation and operational process optimization. Through such multidimensional analysis, the research outcomes facilitate GK Corporation in formulating more precise and efficient service strategies to better meet the needs of individuals in different positions and roles. (See Figure 7 for details).
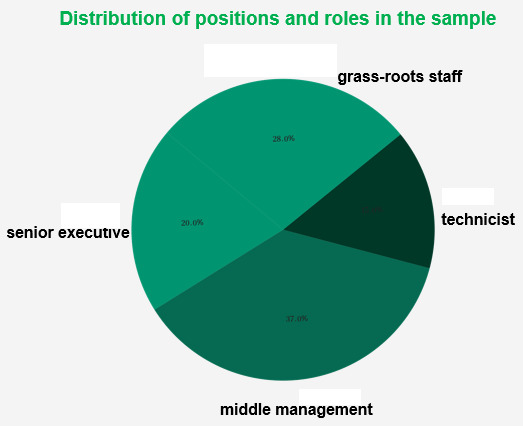
Figure 7. Distribution of Positions/Roles
5.2.1.2 Descriptive Statistical Analysis of Variables
(1) Descriptive Statistics Analysis of Perceived Usefulness
In this study, the descriptive statistical analysis of Perceived Usefulness of digitalized after-sales services reveals a series of important findings. The survey includes six items, including "the effect of improving charging pile efficiency," "the effect of improving charging pile reliability," "reducing charging pile maintenance and downtime," "the utility of monitoring and maintaining the status of charging piles," "improving the overall user experience of charging piles," and "timely updating and optimizing charging pile functions," reflecting participants' comprehensive evaluations of various aspects of the service. These analytical results not only demonstrate the general attitudes of respondents toward the service and their level of acceptance but also reveal the diversity and complexity of user experiences.
Firstly, regarding "the effect of improving charging pile efficiency," after calculation, the average score is 2.92. This score, close to the neutral point, indicates that while participants hold certain expectations for digitalized after-sales services in improving efficiency, their attitudes are relatively cautious. This may stem from their actual experience with the service's effectiveness or their initial acceptance of new technology. Meanwhile, the standard deviation is 1.39, indicating a significant variability among users' perceptions of this issue, possibly due to different situations encountered during actual operation.
In terms of "the effect of improving charging pile reliability," after calculation, the average score is slightly above neutral, at 3.04, indicating that the majority of users perceive digitalized after-sales services to have a positive impact on enhancing equipment reliability. However, it should also be noted that the standard deviation of 1.55 reveals the inconsistency among users' viewpoints, possibly related to individual usage environments and equipment conditions.
For "reducing charging pile maintenance and downtime," the calculated score shows an average rating of 3.11, indicating that most people agree on the utility of digital services in reducing maintenance time. The standard deviation of 1.43 may reflect performance differences in different scenarios.
Regarding "the utility of monitoring and maintaining the status of charging piles," the average score of 3.23 indicates the general affirmation of users towards this functionality. However, it should also be noted that the standard deviation of 1.45 points out potential differences in user experiences.
In terms of "improving the overall user experience of charging piles," the average score of 3.22 indicates that users generally believe the service has improved the quality of their experience, although the standard deviation of 1.47 suggests room for improvement in consistency of experience.
Finally, regarding "timely updating and optimizing charging pile functions," the average score of 2.85 is close to the median, reflecting users' reserved attitudes towards this aspect. This may be related to the frequency of service updates and the actual effectiveness of function optimization. The standard deviation of 1.45 further indicates differing opinions among users regarding this functionality.
Overall, these analytical results provide valuable information for GK Corporation to improve its digitalized after-sales services. While the majority of aspects show users' generally positive attitudes, there is still room for improvement in certain key areas, such as timely updating of functions. These findings demonstrate the academic and systematic nature of the research, providing solid data-based foundations for the company's future service improvements and strategic adjustments. (See Table 3 for details).
Table 3. Descriptive Statistics Analysis of Perceived Usefulness
Item |
Mean |
Standard Deviation |
Minimum Value |
Maximum Value |
the effect of improving charging pile efficiency |
2.92 |
1.39 |
1 |
5 |
the effect of improving charging pile reliability |
3.04 |
1.55 |
1 |
5 |
reducing charging pile maintenance and downtime |
3.11 |
1.43 |
1 |
5 |
the utility of monitoring and maintaining the status of charging piles |
3.23 |
1.45 |
1 |
5 |
improving the overall user experience of charging piles |
3.22 |
1.47 |
1 |
5 |
timely updating and optimizing charging pile functions |
2.85 |
1.45 |
1 |
5 |
(2) Descriptive Statistical Analysis of Perceived Ease of Use
In Table 4, a comprehensive investigation and exploration were conducted concerning six dimensions of Perceived Ease of Use (PEU). These dimensions include "ease of usage," "quick learning and operation," "necessity for additional technical support," "effectiveness of providing user guidance and assistance," "frequency of encountering technical problems," and "accessibility of services." This inquiry aimed to unveil users' holistic perspectives on the Ease of Use of digital after-sales services. By analyzing and computing data from 100 sample cases, crucial insights regarding service Ease of Use were acquired. These insights hold significant importance for subsequent endeavors aimed at optimizing user experience and enhancing service efficiency.
Firstly, regarding the "Ease of Usage," we observed an average rating of 2.72, indicating a neutral stance from users towards the service's Ease of Use, but also implying room for improvement. The standard deviation of 1.47 highlights significant variance in user opinions, likely influenced by individual technical backgrounds and familiarity with digital tools. Further analysis of the "quick learning and operation" dimension revealed an average rating of 3.07, indicating relative satisfaction among users with learning and operating the service. However, the standard deviation of 1.51 also underscores the heterogeneity of user experience, possibly reflecting differences in users' abilities and willingness to learn new technologies.
Concerning the "necessity for additional technical support," the average rating of 2.94 suggests users may require some degree of technical assistance during usage. This finding is crucial for service providers as it emphasizes the necessity of providing effective technical support to users. Additionally, for the "effectiveness of providing user guidance and assistance," the average rating of 3.05 indicates relative satisfaction among users with this aspect of service quality, yet there is still room for further optimization.
Regarding the "frequency of encountering technical problems," the average rating of 2.94 suggests that users do not encounter technical issues frequently during usage, reflecting the stability and reliability of the service to some extent. Simultaneously, concerning the "accessibility of services," the average rating of 2.75 reflects a moderate performance in accessibility, a crucial aspect for enhancing user satisfaction and expanding service coverage.
Overall, these analytical findings provide strong decision-making support for GK Company in the realm of digital after-sales services. While users maintain a neutral to positive stance towards service Ease of Use overall, the diversity and variance in user experience, particularly concerning aspects such as technical support needs and service accessibility, underscore the necessity for improvements.
Table 4. Descriptive Statistical Analysis of Perceived Ease of Use
Item |
Mean |
Standard Deviation |
Minimum Value |
Maximum Value |
ease of usage |
2.72 |
1.47 |
1 |
5 |
quick learning and operation |
3.07 |
1.51 |
1 |
5 |
necessity for additional technical support |
2.94 |
1.52 |
1 |
5 |
effectiveness of providing user guidance and assistance |
3.05 |
1.36 |
1 |
5 |
frequency of encountering technical problems |
2.94 |
1.32 |
1 |
5 |
accessibility of services |
2.75 |
1.45 |
1 |
5 |
(3) Descriptive Statistical Analysis of Service Quality
Table 5 provides a detailed descriptive statistical analysis of the quality of digital after-sales services offered by GK Company, exploring various key dimensions of service based on a series of data points. These dimensions encompass "overall satisfaction," "response speed and problem-solving ability," "professional and technical level," "system stability and reliability," "timeliness in dealing with urgent problems," and "performance in continuous improvement." The analysis aims to comprehensively understand users' perceptions of various aspects of the service and the distribution of these perceptions among user groups.
The computed results indicate that for the "overall satisfaction" metric, the average rating is 2.86, reflecting a neutral stance from users towards GK Company's digital after-sales services overall. A standard deviation of 1.38 reveals fluctuations in user satisfaction within a certain range, implying differences in service experience among different users. Regarding "response speed and problem-solving ability," a similar average rating suggests users have certain expectations regarding service efficiency and problem-solving capabilities, but varying degrees of satisfaction and dissatisfaction exist. A standard deviation of 1.50 indicates significant divergence in user experiences, possibly related to individual users' specific needs or experiences.
Concerning "professional and technical level," the average rating of 2.77 is close to neutral, suggesting users may have reservations about the service's professionalism or expect to see more technological innovation and professional progress. Additionally, the rating for "system stability and reliability" is slightly above neutral, at 2.91, indicating users generally perceive the system to perform well in terms of stability and reliability, although there is still room for improvement.
In terms of "timeliness in dealing with urgent problems," the average rating of 2.99 suggests GK Company receives relatively high praise for its responsiveness in urgent situations, but a standard deviation of 1.45 also indicates diversity in user opinions. Finally, "performance in continuous improvement" received a higher average rating of 3.36, indicating widespread acknowledgment of GK Company's efforts in continuously improving its services, reflecting the company's sensitivity to customer needs and willingness to improve.
In summary, these analytical findings not only showcase users' overall perceptions of GK Company's digital after-sales services but also reveal the company's potential for improvement in specific service dimensions. These insights provide valuable recommendations and guidance for GK Company to enhance Service Quality and customer satisfaction. Through a deeper analysis of these key dimensions, GK Company can better understand customer needs and expectations, thereby formulating more precise and effective service strategies.
Table 5. Descriptive Statistical Analysis of Service Quality
Item |
Mean |
Standard Deviation |
Minimum Value |
Maximum Value |
overall satisfaction |
2.86 |
1.38 |
1 |
5 |
response speed and problem-solving ability |
2.86 |
1.50 |
1 |
5 |
professional and technical level |
2.77 |
1.38 |
1 |
5 |
system stability and reliability |
2.91 |
1.36 |
1 |
5 |
timeliness in dealing with urgent problems |
2.99 |
1.45 |
1 |
5 |
performance in continuous improvement |
3.36 |
1.21 |
1 |
5 |
(4) Descriptive Statistical Analysis of Customer Support
Table 6 delves into various key dimensions of GK Company's Customer Support services, evaluating users' perceptions of Service Quality through descriptive statistical analysis. These dimensions include "efficiency in providing assistance and answering questions," "timeliness and effectiveness of technical support and consulting services," "expertise and skills of the customer support team," "friendliness and effectiveness of the team," "responsiveness in handling feedback and suggestions," and "quality of providing customized solutions and recommendations." This comprehensive analysis aims to reveal users' overall satisfaction and specific perceptions of GK Company's customer support services.
Through our statistical analysis, we first found that in terms of "efficiency in providing assistance and answering questions," users gave an average rating of 3.21, slightly above neutral. This suggests users generally perceive GK Company as relatively efficient in this aspect, although a standard deviation of 1.35 also indicates some variance in user experience. Next, regarding the "timeliness and effectiveness of technical support and consulting services," the average rating of 3.06 reflects widespread satisfaction among users with this service dimension. However, a standard deviation of 1.32 indicates some degree of divergence.
When assessing the "expertise and skills of the customer support team," the computed average rating was 2.89, close to neutral. This may suggest users have reservations about the team's professionalism, with a standard deviation of 1.41 indicating diversity in user perspectives. Furthermore, concerning the "friendliness and effectiveness of the team," the average rating of 3.13 indicates users affirm the team's communication abilities, though there is still room for improvement.
Regarding the "responsiveness in handling feedback and suggestions," the average rating of 2.94 suggests users hold a neutral stance, with a standard deviation of 1.41 further indicating inconsistency in user experiences. Lastly, regarding the "quality of providing customized solutions and recommendations," the average rating of 3.00 indicates overall positive satisfaction with customized services, although a standard deviation of 1.37 also highlights diversity in user satisfaction.
Overall, these analytical findings pinpoint potential areas of improvement in GK Company's Customer Support services, particularly in enhancing efficiency, improving team professionalism, and optimizing communication. They also provide crucial reference and guidance for further enhancing customer satisfaction and service quality. By gaining a deeper understanding of user needs and expectations, GK Company can formulate more precise strategies, thereby providing substantial assistance to the company's product sales.
Table 6. Descriptive Statistical Analysis of Customer Support
Item |
Mean |
Standard Deviation |
Minimum Value |
Maximum Value |
efficiency in providing assistance and answering questions |
3.21 |
1.35 |
1 |
5 |
timeliness and effectiveness of technical support and consulting services |
3.06 |
1.32 |
1 |
5 |
expertise and skills of the customer support team |
2.89 |
1.41 |
1 |
5 |
friendliness and effectiveness of the team |
3.13 |
1.39 |
1 |
5 |
responsiveness in handling feedback and suggestions |
2.94 |
1.41 |
1 |
5 |
quality of providing customized solutions and recommendations |
3.00 |
1.37 |
1 |
5 |
(5) Descriptive Statistical Analysis of Customer Satisfaction
Table 7 provides a comprehensive descriptive statistical analysis of Customer Satisfaction with GK Company's charging pile products and services. Through a series of carefully designed questions, it deeply explores users' overall evaluation of service quality and satisfaction with specific aspects of the service. These aspects include "overall satisfaction with the products and services," "degree of meeting customer expectations," "products performance and reliability," "timeliness of after-sales service," "cost performance of the products," and "frequency of product continuous improvement and update."
The statistical results indicate that, firstly, concerning the "overall satisfaction with the charging pile products and services," users gave an average rating of 2.76, reflecting a tendency towards neutrality in their overall evaluation of GK Company's charging pile products and services. However, a standard deviation of 1.52 also reveals significant variance in satisfaction among users, possibly related to individual usage habits, expectations, and specific usage environments.
In the evaluation of the "degree of meeting customer expectations," the average rating of 3.19 suggests that most users believe GK Company's products and services generally meet their expectations. Nevertheless, a standard deviation of 1.43 indicates some degree of inconsistency among users regarding expectation fulfillment. Similarly, the evaluation of "products performance and reliability" shows a similar trend, with an average rating of 3.19 indicating widespread positivity among users towards the product's performance and reliability, but a standard deviation of 1.47 reflects diversity in user opinions.
Regarding the evaluation of "timeliness of after-sales service," the average rating of 3.30 emphasizes user satisfaction with the timeliness of GK Company's after-sales service. However, a standard deviation of 1.41 also indicates inconsistency in user experiences, suggesting that in certain cases, the responsiveness and problem-solving ability of the service may need further improvement. Similarly, concerning the "cost performance of the products," the average rating of 2.80 and standard deviation of 1.44 indicate a neutral stance from users regarding the balance between price and product performance, with low consistency in evaluations.
Lastly, in the evaluation of "satisfaction with the frequency of continuous improvement and update," the average rating of 3.05 indicates user recognition of GK Company's efforts in continuously improving and updating products. However, a standard deviation of 1.35 also reveals inconsistency in user opinions in this aspect, possibly related to individual users' specific expectations for improvement and updates.
In summary, these analytical findings highlight potential areas for improvement in GK Company's efforts to enhance customer satisfaction, optimize product performance, improve service timeliness, and increase cost performance. These discoveries provide valuable guidance for GK Company in devising customer-oriented strategies and service enhancement plans. Through a comprehensive assessment of user satisfaction, GK Company can more accurately identify user needs and expectations, thereby formulating more effective service improvement strategies.
Table 7. Descriptive Statistical Analysis of Customer Satisfaction
Item |
Mean |
Standard Deviation |
Minimum Value |
Maximum Value |
overall satisfaction with the products and services |
2.76 |
1.52 |
1 |
5 |
degree of meeting customer expectations |
3.19 |
1.43 |
1 |
5 |
products performance and reliability |
3.19 |
1.47 |
1 |
5 |
timeliness of after-sales service |
3.30 |
1.41 |
1 |
5 |
cost performance of the products |
2.80 |
1.44 |
1 |
5 |
frequency of product continuous improvement and update |
3.05 |
1.35 |
1 |
5 |
(6) Descriptive Statistical Analysis of Purchasing Intentions
Table 8 provides a descriptive statistical analysis of Purchasing Intentions for GK Company's charging pile products. We delves into "likelihood of future purchases or recommendations of GK Company's products," "the impact of digital after-sales services on purchasing decisions," "the importance of this service as a key factor in purchase decisions," and "the influence of service improvements on product selection."
The computed results reveal that, firstly, regarding the "likelihood of repurchases or recommendations," users gave an average rating of 3.03, above neutral. This rating suggests that the majority of users maintain an open attitude towards future purchases or recommendations of GK Company's products, although a standard deviation of 1.42 indicates some divergence in user opinions on this matter. This may reflect differences in user experiences regarding product quality, service satisfaction, or individual needs.
In terms of the "impact of digital after-sales services on purchasing decisions," the average rating of 3.05 emphasizes the importance of high-quality after-sales services in influencing customers' purchasing decisions. However, a standard deviation of 1.36 indicates varying perspectives among users regarding the extent of the impact of service quality on purchasing decisions, likely related to differences in user evaluations of service efficiency, effectiveness, and personalized needs.
Regarding the question of whether "digital after-sales services serve as a key decision factor," the average rating of 3.10 indicates that users generally consider this service as an important consideration in their purchase decisions. A standard deviation of 1.33 reflects differing user perceptions of the importance of this service as a decision factor, possibly associated with variations in user evaluations of the overall effectiveness of the service.
Lastly, concerning the "influence of service improvements on product selection," the average rating of 3.15 suggests that if GK Company further improves its digital after-sales services, the majority of users would be more inclined to choose its products. A standard deviation of 1.41 indicates that although most users support this viewpoint, some remain skeptical about the impact of service improvements.
Overall, these analytical findings pinpoint potential opportunities for GK Company to enhance user loyalty and encourage repeat purchases. While users exhibit a positive attitude towards future purchases or recommendations, there is still room for improvement in specific aspects of digital after-sales services, such as service quality and improvement efforts. By gaining a deeper understanding of user needs and expectations, GK Company can accurately target market opportunities and devise strategies to meet diverse customer demands, thereby fostering sustainable business growth and development.
Table 8. Descriptive Statistical Analysis of Purchasing Intentions
Item |
Mean |
Standard Deviation |
Minimum Value |
Maximum Value |
likelihood of future repurchases or recommendations |
3.03 |
1.42 |
1 |
5 |
impact of digital after-sales services on purchasing decisions |
3.05 |
1.36 |
1 |
5 |
importance of this service as a key factor in purchase decisions |
3.10 |
1.33 |
1 |
5 |
influence of service improvements on product selection |
3.15 |
1.41 |
1 |
5 |
5.2.2 Correlation Analysis
Correlation analysis involves analyzing two or more variables with a correlation to measure the degree of their relationship. There needs to be a certain connection or probability between the elements being analyzed for correlation analysis to take place.
In Table 9, a correlation analysis delves into the association between key service characteristics of GK Company's charging pile products (including Perceived Usefulness, Perceived Ease of Use, Service Quality, Customer Support) and Customer Satisfaction and Purchasing Intentions. This analysis not only reveals the mutual influence between variables but also provides important insights for understanding consumer behavior. We used the Pearson correlation coefficient to quantitatively analyze the data, assessing the strength and direction of the relationships between these variables. The formula for calculating the Pearson correlation coefficient (r) is \( \text{r} = \frac{\text{cov}(X, Y)}{\sqrt{\text{var}(X)} \times \sqrt{\text{var}(Y)}} \), where \( \text{cov}(X, Y) \) represents the covariance of X and Y, and \( \text{var}(X) \) and \( \text{var}(Y) \) represent the standard deviations of X and Y, respectively. The correlation coefficient ranges from -1 to 1, where r > 0 indicates a positive correlation, r < 0 indicates a negative correlation, and r = 0 indicates no correlation.
Firstly, we observe a significant positive correlation (correlation coefficient of 0.600) between Perceived Usefulness and Purchasing Intention. This indicates a certain degree of positive relationship between users' perception of the usefulness of digital after-sales services and their willingness to repurchase or recommend GK Company's products. This finding underscores the potential value of optimizing service usefulness in enhancing customer loyalty and driving sales.
Furthermore, the relationship between Perceived Ease of Use and Purchasing Intention is relatively weak (correlation coefficient of 0.450), demonstrating a certain positive correlation between Perceived Ease of Use and Purchasing Intention. That is, when customers perceive digital after-sales services as easy to operate and understand, they are more inclined to make a purchase. This discovery holds important guiding significance for devising user-centric product and service strategies.
The correlation coefficient between Service Quality and Perceived Usefulness is 0.400, and 0.350 with Perceived Ease of Use, indicating the significant role Service Quality plays in enhancing Perceived Usefulness and Ease of Use.
Additionally, the slight positive correlation (correlation coefficient of 0.092) between Customer Support and Purchasing Intention highlights the importance of providing high-quality Customer Support in maintaining customer relationships and promoting sales. This underscores the criticality of designing effective customer support strategies.
Lastly, the correlation coefficient of 0.55 between Customer Satisfaction and Purchasing Intention suggests that Customer Satisfaction plays a crucial mediating role in connecting service quality with purchasing behavior.
These correlation analysis results provide GK Company with clearer market feedback, indicating potential opportunities and challenges in enhancing Customer Satisfaction and stimulating Purchasing Intentions. By comprehensively assessing the relationships between these key variables, GK Company can gain a more precise understanding of customer needs and expectations, thus formulating more effective service improvement strategies.
Table 9. Correlation Analysis Table
Perceived Usefulness |
Perceived Ease of Use |
Service Quality |
Customer Support |
Customer Satisfaction |
Purchasing Intention |
|
Perceived Usefulness |
1.000 |
0.004 |
0.400 |
-0.031 |
0.114 |
0.600 |
Perceived Ease of Use |
0.004 |
1.000 |
0.350 |
0.043 |
-0.113 |
0.450 |
Service Quality |
0.400 |
0.350 |
1.000 |
-0.008 |
-0.062 |
-0.092 |
Customer Support |
-0.031 |
0.043 |
-0.008 |
1.000 |
0.019 |
0.092 |
Customer Satisfaction |
0.114 |
-0.113 |
-0.062 |
0.019 |
1.000 |
0.55 |
Purchasing Intention |
0.600 |
0.450 |
-0.092 |
0.092 |
0.55 |
1.000 |
5.2.3 Multiple Regression Analysis
Multiple Regression Analysis is a statistical analysis method where one variable is considered as the dependent variable, while one or more other variables are considered as independent variables within the set of related variables. It involves establishing a mathematical model representing the quantitative relationship between multiple variables, either linearly or nonlinearly, and analyzing the sample data. Additionally, there's discussion of multiple independent variables and multiple dependent variables in the context of linear dependence, known as Multiple Multiple Regression Analysis models (or simply Multiple-to-Multiple Regression).
In Figure 5 and Figure 6, when exploring the factors influencing Purchasing Intention, Multiple Regression Analysis reveals the significant roles of several key variables. The core variables of interest in this study include Perceived Usefulness, Perceived Ease of Use, Service Quality, Customer Support, and Customer Satisfaction.
Firstly, Perceived Usefulness plays a significant role in influencing Purchasing Intention. Regression Analysis shows that the coefficient of Perceived Usefulness is 0.5282, indicating that for every one unit increase in Perceived Usefulness, Purchasing Intention increases by an average of 0.5282 units. The p-value for this result is less than 0.001, emphasizing the importance of Perceived Usefulness in shaping Purchasing Intention. This finding aligns with the TAM, where Perceived Usefulness is considered as a crucial factor influencing user acceptance and adoption of new technologies. In the context of purchase decisions, this suggests that when customers perceive products or services to be beneficial to some extent, their willingness to purchase significantly increases.
Next, Perceived Ease of Use also demonstrates a significant impact on Purchasing Intention. Specifically, the coefficient of perceived ease of use is 0.3698, indicating that for every one-unit increase, Purchasing Intention increases by an average of 0.3698 units. The p-value for this result is 0.001, confirming the significant role of Perceived Ease of Use in purchase decisions. This underscores the importance of simplicity and intuitiveness of user experience in promoting Purchasing Intention. In a fiercely competitive market environment, products or services that are easy to use and understand may be more appealing to customers, thus enhancing their purchase intent.
However, the impact of Service Quality on Purchasing Intention is not significant in this analysis. Its coefficient is -0.0407, with a p-value of 0.761, indicating that in this dataset, the relationship between Service Quality and Purchasing Intention is not evident. This may suggest that Service Quality is not a primary driver in determining Purchasing Intention, or its impact may be overshadowed by other variables. This finding suggests that when considering improving Purchasing Intention, it may be necessary to focus more on the usefulness and ease of use of the product itself, rather than just Service Quality.
On the other hand, Customer Support has a significant positive impact on Purchasing Intention. Its coefficient is 0.1870, with a p-value of 0.037, indicating that as Customer Support increases, Purchasing Intention also improves. This result emphasizes the value of quality customer service in maintaining and enhancing customer relationships. Good Customer Support not only enhances customer satisfaction but also indirectly promotes sales growth.
Lastly, Customer Satisfaction also plays an important role in influencing Purchasing Intention. Its coefficient is 0.3859, with a p-value of 0.001, indicating a close relationship between increased Customer Satisfaction and increased Purchasing Intention. This finding emphasizes the critical role of meeting customer needs and expectations in business success. Improved Customer Satisfaction is often associated with higher brand loyalty and repeat purchase behavior, which are crucial for long-term success for businesses.
Overall, these analysis results provide objective evidence of factors influencing Purchasing Intention. They highlight the need to comprehensively consider variables such as Perceived Usefulness, Perceived Ease of Use, Customer Support, and Customer Satisfaction when formulating marketing strategies and improving products or services. Although the impact of Service Quality is not significant in this study, it remains an important component of providing a quality customer experience. Therefore, businesses should consider these factors comprehensively to enhance overall Customer Satisfaction and Purchasing Intention when pursuing market success.
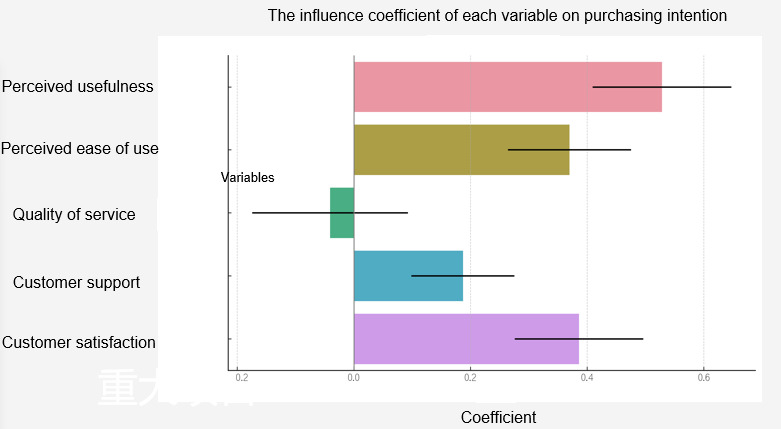
Figure 8. Coefficients of Variables on Purchasing Intentions
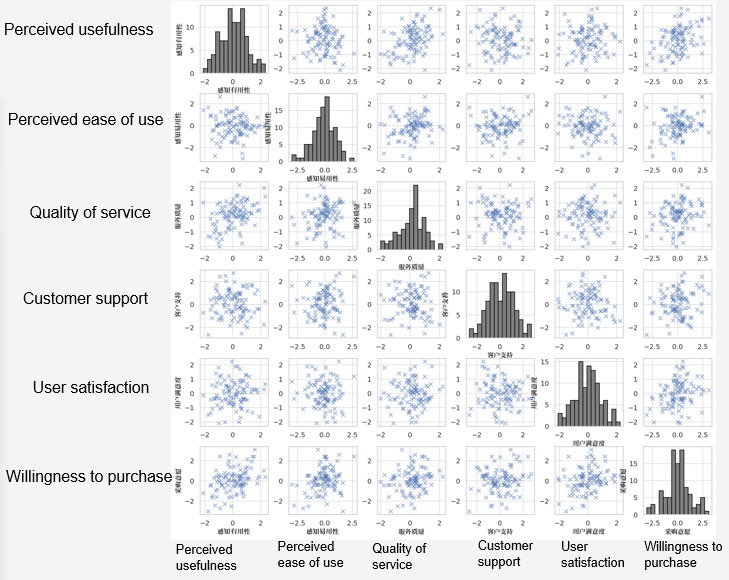
Figure 9. Scatterplot Matrix of Variables
5.2.4 Mediation Effect Testing
Mediation effect testing is utilized to investigate whether the impact of one variable (X) on another variable (Y) is mediated through one or more intermediary variables (M). If such a relationship exists, where X influences Y through M, then M is considered a mediator variable, and its effect is termed as the mediation effect. The purpose of mediation effect testing is to determine the presence of a mediation effect and its magnitude relative to the total effect.
In exploring the impact of digital after-sales service on the Purchasing Intentions of major customers, we employed an analytical framework based on the TAM. This framework emphasizes the importance of "Perceived Usefulness" and "Perceived Ease of Use" on user behavior. This study aims to further investigate these two factors, as well as "Service Quality," "Customer Support," and "Customer Satisfaction" as potential mediator variables in influencing the procurement intentions of major customers.
(1) Model 1 (Investigating the Impact of Independent Variables on Mediator Variable): Model 1 focuses on exploring the impact of "Perceived Usefulness" and "Perceived Ease of Use" on "Customer Satisfaction".
This model is grounded in two key dimensions of customer experience: the actual usefulness of a product or service (i.e., Perceived Usefulness) and the ease of its use (i.e., Perceived Ease of Use). In the construction of the model, these two dimensions are considered as independent variables, while Customer Satisfaction is the dependent variable. To ensure consistency and comparability of the data, normalization was performed, and the Pearson Correlation Coefficient was utilized as the standard for measuring the correlation.
The analysis results indicate that the correlation coefficient between "Perceived Usefulness" and Customer Satisfaction is 0.114, suggesting a positive correlation between the two, albeit weak. This implies that while the practicality of the product has some positive influence on Customer Satisfaction, it is not the primary determinant of Customer Satisfaction. On the other hand, the correlation coefficient between "Perceived Ease of Use" and Customer Satisfaction is -0.113, indicating a slight negative correlation. This may reflect higher expectations from users regarding Ease of Use, or suggest that Ease of Use is not the key determinant of Customer Satisfaction. (See Figure 5-5 for details)
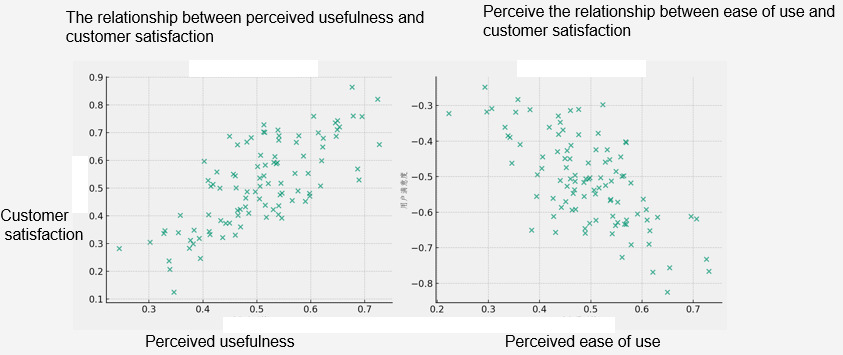
Figure 10. Relationship Between Perceived Usefulness, Perceived Ease of Use, and Customer Satisfaction
Based on the comprehensive analysis, it can be concluded that although "Perceived Usefulness" and "Perceived Ease of Use" are correlated with Customer Satisfaction to some extent, this influence is not statistically significant. This further suggests that Customer Satisfaction may be influenced more by other factors, such as Service Quality and Customer Support. Therefore, future research should consider including these additional factors to more comprehensively understand and enhance Customer Satisfaction.
(2) Model 2 (Investigating the Direct Effects of Independent Variables on Dependent Variable): Model 2 investigates the direct effects of "Perceived Usefulness" and "Perceived Ease of Use" on "Purchasing Intention".
This model, based on detailed observations of user behavior, aims to reveal how users' perceptions of the Usefulness and Ease of Use of a product or service translate into actual purchase behavior. Model 2 focuses on two core independent variables—Perceived Usefulness and Perceived Ease of Use—and one dependent variable, Purchasing Intention.
During the correlation analysis, we observed a significant positive correlation coefficient of 0.600 between "Perceived Usefulness" and "Purchasing Intention". This result emphasizes how users' perception of the practical utility of a service or product significantly influences their purchasing decisions. In other words, when users perceive a service or product to bring significant benefits in actual use, they are more likely to demonstrate a strong purchase intention. This finding is crucial for understanding user behavior and optimizing product design strategies, suggesting that companies should focus on enhancing the practical value of their products to stimulate and strengthen customer purchasing intentions.
At the same time, we also noted a correlation coefficient of 0.450 between "Perceived Ease of Use" and "Purchasing Intention", indicating a positive correlation as well. Although this relationship is not as strong as Perceived Usefulness, it still suggests that the Ease of Use of a product or service has some impact on user purchasing decisions. This means that users consider the usability of a product when deciding whether to make a purchase, although this consideration may not be as important as the product's practicality. Therefore, in product design and marketing strategy development, efforts should be made to improve the usability of products to provide a more user-friendly experience. (See Figure 11 for details)
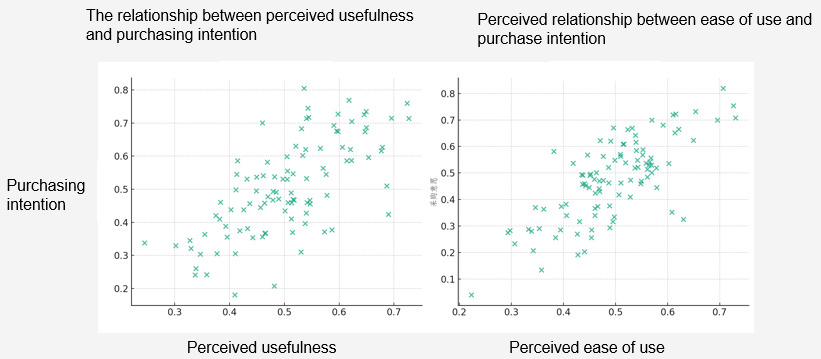
Figure 11. Relationship Between Perceived Usefulness, Perceived Ease of Use, and Purchasing Intention
In the analysis of Model 2, we have identified that "Perceived Usefulness" plays a significant and positive role in users' Purchasing Intention, while "Perceived Ease of Use," although less influential, is still an important factor in determining user Purchasing Intention. These findings not only provide practical insights for marketing and product design but also point the way for future research, namely delving deeper into and optimizing the Usefulness and Ease of Use of products to better meet user needs and enhance market competitiveness.
(3) Model 3 (Comprehensive Model including Mediating Variables): Consideration of both the independent variables ("Perceived Usefulness" and "Perceived Ease of Use") and the mediating variable ("Customer Satisfaction") in their collective impact on "Purchasing Intention."
This holistic model not only considers direct effects but also examines how Customer Satisfaction mediates the relationship between Perceived Usefulness, Perceived Ease of Use, and Purchasing Intention.
In the analysis process, it is noteworthy that the correlation coefficient between "Perceived Usefulness" and "Purchasing Intention" is 0.600, indicating a significant positive correlation. This suggests that when users perceive a service or product to have high practical value, their Purchasing Intention correspondingly increases. However, when considering "Customer Satisfaction," we find that it not only has a significant positive correlation with "Purchasing Intention" (correlation coefficient of 0.55) but may also enhance the impact of "Perceived Usefulness" on "Purchasing Intention." This finding implies that an increase in satisfaction can reinforce users' perception of product usefulness in their decision-making process, thereby potentially leading to actual purchase behavior.
Equally important is that although the direct association between "Perceived Ease of Use" and "Customer Satisfaction" is not statistically significant (correlation coefficient of -0.113), its positive correlation with "Purchasing Intention" (correlation coefficient of 0.450) suggests that Ease of Use still plays a role in user purchase decisions. This may indicate that even if the Ease of Use of a product does not directly increase overall Customer Satisfaction, it still influences user purchase decisions through other mechanisms. (See Figure 12 for details)
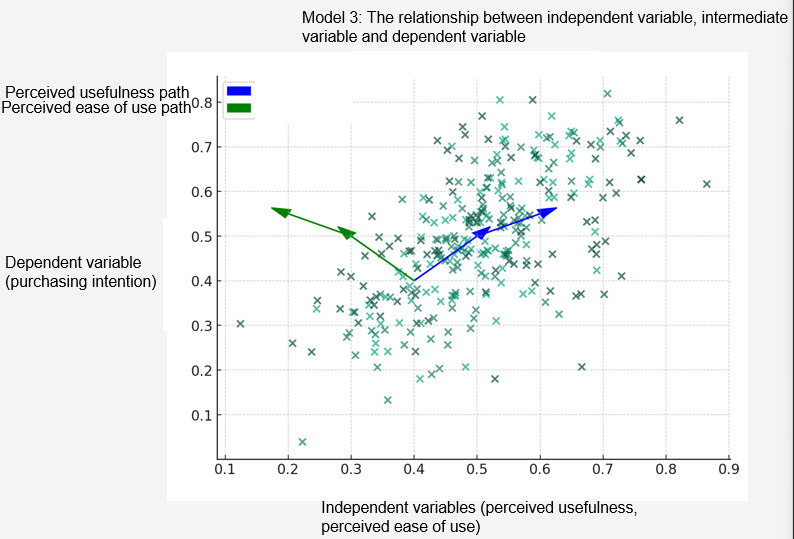
Figure 12. Relationships between Independent Variables, Mediating Variable, and Dependent Variable
In summary, the analysis of Model 3 revealed the complex interplay between "Perceived Usefulness," "Perceived Ease of Use," and "Customer Satisfaction" in the user purchasing decision process. These findings underscore the need for businesses to consider these factors comprehensively when formulating marketing strategies and product designs. Enhancing Customer Satisfaction not only directly influences Purchasing Intention but may also enhance users' perception of product usefulness, thereby promoting purchasing behavior. This holistic perspective provides businesses with a strategy to increase their market competitiveness by enhancing Customer Satisfaction through improving product Usefulness and Ease of Use.
5.3 Result Interpretation
In this study, we employed a comprehensive data analysis approach to investigate the impact of digital after-sales services on customer behavior. Through descriptive statistical analysis, correlation analysis, multiple regression analysis, and mediation effect testing, we obtained a series of objective data. These data hold significant theoretical and practical implications for understanding and optimizing digital after-sales services.
Firstly, descriptive statistical analysis provided a basic overview of the sample data. The sample encompassed four large enterprise groups collaborating with GK Company, with each contributing 25 samples, ensuring the representativeness and balance of the data. The sample included employees from various positions, from senior management to frontline staff, providing a comprehensive perspective from decision-makers to implementers, ensuring the high value of the sample data and the scientific validity of the research.
Next, correlation analysis revealed a significant positive correlation between Perceived Usefulness, Perceived Ease of Use, and Purchasing Intention. Particularly, Perceived Usefulness (correlation coefficient of 0.600) exhibited a strong correlation with Purchasing Intention, while Perceived Ease of Use (correlation coefficient of 0.450), though with a lesser impact, remained significant. These findings underscored the critical role of these factors in shaping Purchasing Intentions. Furthermore, the weaker relationship between Service Quality, Customer Support, Customer Satisfaction, and Purchasing Intention might indicate other potential influencing factors or suggest that the influence of these variables might be more indirect.
Multiple regression analysis further explored the impact of these variables on Purchasing Intention. The analysis revealed that Perceived Usefulness had a significant positive effect on Purchasing Intention, while Perceived Ease of Use, although with a weaker influence, still played an important role in purchase decisions. The nonsignificant effect of Service Quality suggested that enhancing Purchasing Intention might require more focus on the Usefulness and Ease of Use of the product itself in this specific context.
Lastly, mediation effect testing indicated that Customer Satisfaction might mediate the relationship between Perceived Usefulness/Ease of Use and Purchasing Intention. Although the direct effects of Perceived Usefulness and Perceived Ease of Use on Customer Satisfaction were not significant, their significant positive effects on Purchasing Intention suggested that Customer Satisfaction might enhance the positive influence of Perceived Usefulness on Purchasing Intention.
In conclusion, this study provides a profound understanding of how digital after-sales services influence customer behavior. Our findings emphasize the need to comprehensively consider factors such as Perceived Usefulness, Perceived Ease of Use, Customer Support, and Customer Satisfaction when formulating marketing strategies and improving products or services. While the impact of Service Quality was not significant in this study, it remains an essential component of providing high-quality customer experiences and should not be overlooked. Therefore, businesses should consider these factors comprehensively to enhance overall Customer Satisfaction and Purchasing Intention. These research findings provide valuable guidance for GK Company on how to improve customer loyalty and market performance through optimizing digital after-sales services.
6 Conclusion and Future Outlook
6.1 Main Findings
In this study, we rigorously explored the role of digital after-sales services in today's business environment, particularly how they influence the Satisfaction and Purchasing Intentions of enterprise customers collaborating with GK Company. Through the comprehensive application of descriptive statistical analysis, correlation analysis, multiple regression analysis, and mediation effect testing, this study has revealed a series of key findings. These findings not only enrich the theoretical knowledge in the field of digital services but also provide practical guidance for businesses.
(1) Significant Positive Correlation between Perceived Usefulness and Purchasing Intention: This study reveals a significant positive correlation between Perceived Usefulness and Purchasing Intention. When customers perceive a service or product to be highly useful in practical usage, they tend to exhibit stronger purchase inclinations. This finding underscores the importance of emphasizing the utility of products, particularly in the domain of digital services, where customers' evaluations of product utility directly influence their purchase decisions.
(2) Impact of Perceived Ease of Use on Purchasing Intention: Although the impact of Perceived Ease of Use on Purchasing Intention is weaker compared to Perceived Usefulness, it remains an important influencing factor. This suggests that users not only consider the utility of services or products but also value their ease of use when evaluating them. Users tend to prefer services or products that not only meet their practical needs but are also easy to operate and understand, particularly crucial in the design and implementation of digital services.
(3) Influence of Service Quality and Customer Support on Purchasing Intention: The direct impact of Service Quality and Customer Support on Purchasing Intention is not significant, indicating that these factors may influence customer purchase decisions through other means. For example, while Service Quality and Customer Support themselves may not directly drive Purchasing Intention, they may indirectly influence purchase decisions by enhancing Customer Satisfaction. This finding suggests that optimizing Service Quality and strengthening Customer Support are not only critical for enhancing Customer Satisfaction but may also indirectly facilitate sales.
(4) Mediating Role of Customer Satisfaction: Customer Satisfaction plays a mediating role between Perceived Usefulness/Ease of Use and Purchasing Intention. This implies that enhancing Customer Satisfaction with a service or product may strengthen the positive impact of Perceived Usefulness on Purchasing Intention. Therefore, to improve sales performance and market competitiveness, businesses should focus on enhancing Customer Satisfaction, including providing high-quality services and support, as well as ensuring the Ease of Use and Usefulness of products.
6.2 Recommendations
The in-depth data analysis has revealed the impact of digital after-sales services on customer behavior, particularly their Satisfaction and Purchasing Intention. These findings not only enrich the theoretical knowledge in the digital service domain but also provide valuable operational guidance for businesses. Based on these findings, we propose the following recommendations to assist GK Company and similar organizations in optimizing their services and products to better meet customer needs and drive business growth.
(1) Enhance the Usefullness of Products and Services: GK Company should focus on enhancing the usefullness of its products and services to meet specific customer needs. This includes investing in technological innovations to ensure that products have robust functionality, address specific problems, and remain competitive in the market. Improving the usefullness of products and services can significantly increase customer Purchasing Intention, thereby driving sales growth.
(2) Improve User Experience, Especially Ease of Use: Although the direct impact of Perceived Ease of Use on Purchasing Intention may be relatively weak, it still holds a crucial position in the overall user experience. GK Company should enhance Ease of Use by simplifying operation processes, providing clear user guides, and enhancing the intuitiveness of products. Optimizing user experience can increase product attractiveness, thereby promoting customer loyalty and long-term relationships.
(3) Prioritize Service Quality and Customer Support: While Service Quality and Customer Support may not directly influence Purchasing Intention, they play a critical role in maintaining Customer Satisfaction and building long-term relationships. Therefore, GK Company should focus on providing high-quality services, including timely response to customer needs, offering professional and personalized support, and actively addressing customer feedback and complaints.
(4) Enhance Customer Satisfaction: Customer Satisfaction is a key mediating variable linking product attributes and Purchasing Intention. GK Company should prioritize improving Customer Satisfaction as part of its core strategy by continuously improving product and service quality and optimizing the customer experience. Improving Customer Satisfaction not only contributes to short-term sales but also enhances customer loyalty and market share in the long run.
In conclusion, these recommendations aim to assist GK Company in better adapting to the demands of the digital era by providing high-quality, user-friendly, and customer-satisfying products and services to achieve its business objectives. The implementation of these strategies will require internal coordination within the company and ongoing attention to market changes to respond to customer needs and maintain market competitiveness effectively.
6.3 Limitations and Future Research Directions
In this study, we conducted in-depth research on the impact of digital after-sales services on Customer Satisfaction and Purchasing Intention. While the study provides valuable insights into the role of digital services in the modern business environment, we acknowledge certain limitations that not only provide necessary context for the interpretation of this research but also point towards future research directions.
(1) Sample Limitations: This study primarily relied on data from four companies collaborating with GK Company, which may limit the generalizability of the research findings. Future research should consider expanding the sample scope to include a broader range of enterprises, encompassing more diverse types and sizes of businesses to enhance the universality and transferability of the research results. By incorporating enterprises from different industries, scales, and markets, future research can more comprehensively assess the impact of digital after-sales services.
(2) Expansion of Variable Scope: While this study focused on key variables such as Perceived Usefulness, Perceived Ease of Use, Service Quality, Customer Support, and Customer Satisfaction, future research can explore other potential variables that may influence customer behavior. For example, factors like brand image, market competitiveness, customer loyalty, and technological innovation could significantly impact customer decision-making processes. By exploring these variables, future research can provide more comprehensive insights to help businesses better understand and respond to market complexities.
(3) Methodological Diversification: While this study primarily employed quantitative methods, future research could consider using qualitative research or mixed methods to gain a more comprehensive perspective. Qualitative methods such as in-depth interviews, case studies, or focus group discussions can provide deeper insights into the underlying motivations and perceptions of users behind the data.
(4) Long-term Impact Studies: This study focused on short-term user behavior, but future research should consider longitudinal tracking to assess the impact of time and long-term trends. Longitudinal studies can help understand the evolution of customer behavior and the long-term effects of digital after-sales services on business performance.
Overall, this study provides objective and significant insights into the field of digital after-sales services and offers strategic recommendations for GK Company and other businesses to improve service quality in practice. Through future research, we can not only deepen our understanding of this field but also provide the industry with more comprehensive and in-depth guidance to address evolving market demands and technological challenges.
References
[1]. Davis, F. D. (1986). A technology acceptance model for empirically testing new end user information systems: Theory and results (Doctoral dissertation). MIT Sloan School of Management, Cambridge, MA.
[2]. Davis, F. D. (1989). Perceived usefulness, perceived ease of use, and user acceptance of information technology. MIS Quarterly, 13(3), 318-340.
[3]. Davis, F. D. (1993). User acceptance of information technology: System characteristics, user perceptions, and behavioral impacts. International Journal of Man-Machine Studies, 38(3), 475-487.
[4]. Davis, F. D., & Venkatesh, V. (1996). A critical assessment of potential measurement biases in the technology acceptance model: Three experiments. International Journal of Human-Computer Studies, 45(1), 19-45.
[5]. Venkatesh, V., & Davis, F. D. (2000). A theoretical extension of the technology acceptance model: Four longitudinal field studies. Management Science, 45(2), 186-204.
[6]. Venkatesh, V., Morris, M. G., Davis, G. B., & Davis, F. D. (2003). User acceptance of information technology: Toward a unified view. MIS Quarterly, 27(3), 425-478.
[7]. Granić, A., & Marangunić, N. (2019). Technology acceptance model in educational context: A systematic literature review. British Journal of Educational Technology, 50, 2572-2593. https://doi.org/10.1111/BJET.12864
[8]. Gefen, D., Karahanna, E., & Straub, D. W. (2003). Trust and TAM in online shopping: An integrated model. MIS Quarterly, 27(1), 51-90.
[9]. McCoy, S., Galletta, D., & King, W. R. (2007). Applying TAM across cultures: The need for caution. European Journal of Information Systems, 16, 81-90. https://doi.org/10.1057/palgrave.ejis.3000659
[10]. King, W. R., & He, J. (2006). A meta-analysis of the technology acceptance model. Information & Management, 43, 740-755. https://doi.org/10.1016/j.im.2006.05.003
[11]. Li, Y., Chung, S.-H., Wen, X., & Zhou, S. (2023). Towards the sustainable economy through digital technology: A drone-aided after-sales service scheduling model. Applied Soft Computing Journal, 138.
[12]. Galvani, S., Carloni, E., Bocconcelli, R., & Pagano, A. (2022). From after-sales to advanced services: A network analysis on the impacts of digital servitization evolution. Sustainability, 14(14).
[13]. Yang, W. (2022). Research on the digital transformation of XYZ Group's after-sales service platform [Doctoral dissertation]. South China University of Technology.
[14]. Chen, J. (2022, March 28). Deconstructing the "opening way" of those "Ice-breaking Spring" physical stores. Zhoushan Daily, (003).
[15]. Power, J. D. (2020). Automobile manufacturers need to focus on creating a complete and continuous digital after-sales service experience. Automotive & Parts, (22), 59.
[16]. Cao, S., & Li, B. (2015). Digital information platform of medical equipment after-sales service. China Journal of Medical Devices, 39(01), 74-76.
[17]. Derber, A., & Li, X. (2019). The digitization of after-sales service market needs continuous exploration. Aeronautical Maintenance & Engineering, (11), 28-29.
[18]. Gottlieb, C., & Li, X. (2019). The digitization of after-sales service market will intensify mergers and acquisitions. Aeronautical Maintenance & Engineering, (02), 19.
[19]. Zhang, Z. (2002). Digital network after-sales service system. High-tech Communication, (04), 1-3+26.
[20]. Han, W., Niu, D., & Senjyu, T. (2017). Study on influence factors of electric vehicles charging station location based on ISM and FMICMAC. Sustainability, 9(4).
[21]. Schmidt, M., Staudt, P., & Weinhardt, C. (2020). Evaluating the importance and impact of user behavior on public destination charging of electric vehicles. Applied Energy, 258(C).
[22]. Kong, W., Luo, Y., Feng, G., Li, K., & Peng, H. (2019). Optimal location planning method of fast charging station for electric vehicles considering operators, drivers, vehicles, traffic flow, and power grid. Energy, 186.
[23]. Zang, H., Fu, Y., Chen, M., Shen, H., Miao, L., Zhang, S., Wei, Z., & Sun, G. (2018). Bi-level planning model of charging stations considering the coupling relationship between charging stations and travel route. Applied Sciences, 8(7).
[24]. Zenginis, I., Vardakas, J. S., Zorba, N., & Verikoukis, C. V. (2016). Analysis and quality of service evaluation of a fast charging station for electric vehicles. Energy, 112.
[25]. Bayram, I. S., Tajer, A., Abdallah, M., & Qaraqe, K. (2015). Capacity planning frameworks for electric vehicle charging stations with multiclass customers. IEEE Transactions on Smart Grid, 6(4).
[26]. Cheng, D. (2023). Survey on intelligent knowledge popularization of the elderly based on TAM-TPB model. Smart City, 9(12), 99-101. https://doi.org/10.19301/j.carolcarroll.nki.ZNCS.2023.12.030
[27]. Zheng, X., & Chen, Y. (2023). Research on influencing factors of college students' computational thinking based on TAM model. Information Technology for Education, (12), 32-35.
[28]. Yan, H., Gao, J., Li, C., et al. (2019). Study on county residents' willingness to use the internet medical platform of the medical community based on TAM model. Chinese Rural Health Service Administration, 43(12), 843-849. https://doi.org/10.19955/j.cnki.1005-5916.2023.12.002
[29]. Li, J., He, Y., & Zhou, Q. (2023). Study on the influence of negative personal information of internet celebrities on consumers' repurchase intention and countermeasures based on TAM model. Journal of Jiangsu University of Science and Technology (Social Sciences Edition), 23(04), 95-102. https://doi.org/10.16148/j.cnki.cn32-1743/c.2023.04.010
[30]. Han, T., Lu, Z., Peng, P., et al. (2023). Study on prefabricated food use will influence factors based on TAM model. Circulation of the National Economy, (23), 13-16. https://doi.org/10.16834/j.carolcarroll.nki.issn1009-5292.2023.23.007
[31]. Su, M., & Chen, M. (2023). Study on the impact of large-scale sports events on residents' intention to participate in physical exercise based on TAM model. In Chinese Society of Sports Science, 13th National Sports Science Conference Special Report (Sports Statistics Branch). Chengdu Sports Institute. https://doi.org/10.26914/c.nkihy.2023.061716
[32]. Cheng, Y., & Wu, Y. (2023). Research on influencing factors of user stickiness in fitness broadcast room based on ELM model. In Chinese Society of Sports Science, 13th National Sports Science Conference -- Wall Poster (Sports Industry Branch). Shanghai Sports Institute. https://doi.org/10.26914/c.nkihy.2023.068067
[33]. Yang, J., Du, T., & Zang, W. (2019). Study on influencing factors of patients' willingness to first visit based on extended TAM-TPB integration model. Journal of Medical Informatics, 44(09), 56-61+73.
[34]. Li, H. (2023). A study on behavioral intention in online college English learning based on TAM model. Overseas English, (18), 128-131+152.
[35]. Zhe, M. (2023). Research on user adoption status and influencing factors of new government media based on TAM model. New Media Research, 9(17), 28-32. https://doi.org/10.16604/j.carolcarroll.nki.issn2096-0360.2023.17.008
[36]. Sang, X. (2019). Analysis of influencing factors of digital RMB usage intention based on Logistic and TAM models. Science and Technology and Industry, 23(16), 57-62.
[37]. Liu, Y., Huang, X., & Yan, T. (2023). Research on acceptability of integrated platform of expressway construction management based on TAM. Highway Engineering, 48(04), 167-173. https://doi.org/10.19782/j.cnki.1674-0610.2023.04.025
[38]. Zhai, Y., Luo, B., Wang, Y., et al. (2019). Influencing factors of patients' willingness to share medical data: Combining improvement planning behavior theory (TPB) and technology acceptance model (TAM). Science and Technology Management Research, 43(16), 235-244.
[39]. Zhang, Y., & Ke, H. (2019). Research on virtual simulation technology acceptance and teaching innovation from the perspective of extended TAM and TTF integration. Modern Information Technology, 7(14), 177-183. https://doi.org/10.19850/j.cnki.2096-4706.2023.14.037
[40]. Zhang, N., Ren, W., Liang, S., et al. (2023). Research on influencing factors of users' intention to use digital reading extension service in library: Based on TAM/AISAS model. Library Work and Study, (7), 18-28. https://doi.org/10.16384/j.carolcarroll.nki.lwas.2023.07.011
[41]. Wu, X., Zhang, W., Li, S., et al. (2023). Research on the chain influence mechanism of intelligent investment advisor user adoption intention based on Technology Acceptance Model (TAM). Journal of Zhejiang University (Humanities and Social Sciences Edition), 53(07), 5-19.
[42]. Wan, C. (2023). A study on the influencing factors of consumers' continuous use behavior of cross-border e-commerce platforms based on TAM model [Doctoral dissertation, Hebei University].
[43]. Zhang, B. (2023). Research on the willingness to use digital RMB based on TAM-TOE model [Doctoral dissertation, Beijing University of Posts and Telecommunications].
[44]. Sun, B., & Guo, Y. (2023). Study on the impact of cultural heritage digitization on national heritage responsibility: Model construction based on TTF and TAM. Tourism Science, 5(3), 71-85. https://doi.org/10.16323/j.carolcarroll.nki.lykx.2023.03.009
[45]. Zhang, X., Yang, H., & Xu, H. (2023). Self-help vending machine behavior will influence factors based on TAM model. Circulation of the National Economy, (12), 28-31. https://doi.org/10.16834/j.carolcarroll.nki.issn1009-5292.2023.12.043
[46]. Zhang, T. (2023). Research on influencing factors of information resource utilization efficiency of government websites based on TAM and TTF [Doctoral dissertation, Tianjin Normal University]. https://doi.org/10.27363/dc.nki.Gtsfu.2023.000549
[47]. Li, J., & Yu, D. (2024). An analysis of users' perceived usefulness of scientific data sharing platform: A case study of National Science and Technology Basic Conditions Platform. Intelligence Magazine, 1-7. Retrieved from http://kns.cnki.net/kcms/detail/61.1167.G3.20230602.1038.016.html
[48]. Zhuo, S. (2023). Study on the influencing factors of user attitude of "Yuedaohuan" fitness APP based on TAM model [Doctoral dissertation, Chengdu Sports Institute]. https://doi.org/10.26987/dc.nki.GCDTC.2023.000183
[49]. Li, M.-B., Wang, W., & Chen, N. (2019). An empirical study on influencing factors of teachers' information-based teaching ability in higher vocational colleges based on TPB-TAM integrated model. Journal of Guangdong Agricultural, Industrial and Technical College, 39(02), 44-50+65.
[50]. Liang, Y., & Li, N. (2023). A study on the willingness to use Chinese digital learning resources and its influencing factors: Based on TAM extended model. Journal of Language and Text Applications, (02), 23-35. https://doi.org/10.16499/j.cnki.1003-5397.2023.02.006
[51]. Li, H., Huang, T., & Li, W. (2023). Based on big data platform of ship remote operations system. Journal of Ship and Ocean Engineering, 33(6), 56-61. https://doi.org/10.14056/j.carolcarroll.nki.naoe.2023.06.009
[52]. Wang, J. (2023). Kewang: Integration of innovation, driving the digital future. Print Manager, (06), 40-41.
[53]. Song, S., Xie, H., Wu, Z., et al. (2023). A practical exploration of digitization empowering primary medical institutions to create a new model of remote service. China Science of Healthcare Administration, 13(06), 77-82.
[54]. Liu, H.-Z., Zhang, B., & Li, R. (2023). Online and remote working promote financial digital transformation. Finance and Accounting, (19), 69-70.
Cite this article
Wang,J. (2024). Study on the Relationship between Digital After-sales Service of Charging Pile and Purchasing Intention of Major Customers Based on the TAM Model---A Case Study of GK Corporation. Journal of Applied Economics and Policy Studies,8,19-44.
Data availability
The datasets used and/or analyzed during the current study will be available from the authors upon reasonable request.
Disclaimer/Publisher's Note
The statements, opinions and data contained in all publications are solely those of the individual author(s) and contributor(s) and not of EWA Publishing and/or the editor(s). EWA Publishing and/or the editor(s) disclaim responsibility for any injury to people or property resulting from any ideas, methods, instructions or products referred to in the content.
About volume
Journal:Journal of Applied Economics and Policy Studies
© 2024 by the author(s). Licensee EWA Publishing, Oxford, UK. This article is an open access article distributed under the terms and
conditions of the Creative Commons Attribution (CC BY) license. Authors who
publish this series agree to the following terms:
1. Authors retain copyright and grant the series right of first publication with the work simultaneously licensed under a Creative Commons
Attribution License that allows others to share the work with an acknowledgment of the work's authorship and initial publication in this
series.
2. Authors are able to enter into separate, additional contractual arrangements for the non-exclusive distribution of the series's published
version of the work (e.g., post it to an institutional repository or publish it in a book), with an acknowledgment of its initial
publication in this series.
3. Authors are permitted and encouraged to post their work online (e.g., in institutional repositories or on their website) prior to and
during the submission process, as it can lead to productive exchanges, as well as earlier and greater citation of published work (See
Open access policy for details).
References
[1]. Davis, F. D. (1986). A technology acceptance model for empirically testing new end user information systems: Theory and results (Doctoral dissertation). MIT Sloan School of Management, Cambridge, MA.
[2]. Davis, F. D. (1989). Perceived usefulness, perceived ease of use, and user acceptance of information technology. MIS Quarterly, 13(3), 318-340.
[3]. Davis, F. D. (1993). User acceptance of information technology: System characteristics, user perceptions, and behavioral impacts. International Journal of Man-Machine Studies, 38(3), 475-487.
[4]. Davis, F. D., & Venkatesh, V. (1996). A critical assessment of potential measurement biases in the technology acceptance model: Three experiments. International Journal of Human-Computer Studies, 45(1), 19-45.
[5]. Venkatesh, V., & Davis, F. D. (2000). A theoretical extension of the technology acceptance model: Four longitudinal field studies. Management Science, 45(2), 186-204.
[6]. Venkatesh, V., Morris, M. G., Davis, G. B., & Davis, F. D. (2003). User acceptance of information technology: Toward a unified view. MIS Quarterly, 27(3), 425-478.
[7]. Granić, A., & Marangunić, N. (2019). Technology acceptance model in educational context: A systematic literature review. British Journal of Educational Technology, 50, 2572-2593. https://doi.org/10.1111/BJET.12864
[8]. Gefen, D., Karahanna, E., & Straub, D. W. (2003). Trust and TAM in online shopping: An integrated model. MIS Quarterly, 27(1), 51-90.
[9]. McCoy, S., Galletta, D., & King, W. R. (2007). Applying TAM across cultures: The need for caution. European Journal of Information Systems, 16, 81-90. https://doi.org/10.1057/palgrave.ejis.3000659
[10]. King, W. R., & He, J. (2006). A meta-analysis of the technology acceptance model. Information & Management, 43, 740-755. https://doi.org/10.1016/j.im.2006.05.003
[11]. Li, Y., Chung, S.-H., Wen, X., & Zhou, S. (2023). Towards the sustainable economy through digital technology: A drone-aided after-sales service scheduling model. Applied Soft Computing Journal, 138.
[12]. Galvani, S., Carloni, E., Bocconcelli, R., & Pagano, A. (2022). From after-sales to advanced services: A network analysis on the impacts of digital servitization evolution. Sustainability, 14(14).
[13]. Yang, W. (2022). Research on the digital transformation of XYZ Group's after-sales service platform [Doctoral dissertation]. South China University of Technology.
[14]. Chen, J. (2022, March 28). Deconstructing the "opening way" of those "Ice-breaking Spring" physical stores. Zhoushan Daily, (003).
[15]. Power, J. D. (2020). Automobile manufacturers need to focus on creating a complete and continuous digital after-sales service experience. Automotive & Parts, (22), 59.
[16]. Cao, S., & Li, B. (2015). Digital information platform of medical equipment after-sales service. China Journal of Medical Devices, 39(01), 74-76.
[17]. Derber, A., & Li, X. (2019). The digitization of after-sales service market needs continuous exploration. Aeronautical Maintenance & Engineering, (11), 28-29.
[18]. Gottlieb, C., & Li, X. (2019). The digitization of after-sales service market will intensify mergers and acquisitions. Aeronautical Maintenance & Engineering, (02), 19.
[19]. Zhang, Z. (2002). Digital network after-sales service system. High-tech Communication, (04), 1-3+26.
[20]. Han, W., Niu, D., & Senjyu, T. (2017). Study on influence factors of electric vehicles charging station location based on ISM and FMICMAC. Sustainability, 9(4).
[21]. Schmidt, M., Staudt, P., & Weinhardt, C. (2020). Evaluating the importance and impact of user behavior on public destination charging of electric vehicles. Applied Energy, 258(C).
[22]. Kong, W., Luo, Y., Feng, G., Li, K., & Peng, H. (2019). Optimal location planning method of fast charging station for electric vehicles considering operators, drivers, vehicles, traffic flow, and power grid. Energy, 186.
[23]. Zang, H., Fu, Y., Chen, M., Shen, H., Miao, L., Zhang, S., Wei, Z., & Sun, G. (2018). Bi-level planning model of charging stations considering the coupling relationship between charging stations and travel route. Applied Sciences, 8(7).
[24]. Zenginis, I., Vardakas, J. S., Zorba, N., & Verikoukis, C. V. (2016). Analysis and quality of service evaluation of a fast charging station for electric vehicles. Energy, 112.
[25]. Bayram, I. S., Tajer, A., Abdallah, M., & Qaraqe, K. (2015). Capacity planning frameworks for electric vehicle charging stations with multiclass customers. IEEE Transactions on Smart Grid, 6(4).
[26]. Cheng, D. (2023). Survey on intelligent knowledge popularization of the elderly based on TAM-TPB model. Smart City, 9(12), 99-101. https://doi.org/10.19301/j.carolcarroll.nki.ZNCS.2023.12.030
[27]. Zheng, X., & Chen, Y. (2023). Research on influencing factors of college students' computational thinking based on TAM model. Information Technology for Education, (12), 32-35.
[28]. Yan, H., Gao, J., Li, C., et al. (2019). Study on county residents' willingness to use the internet medical platform of the medical community based on TAM model. Chinese Rural Health Service Administration, 43(12), 843-849. https://doi.org/10.19955/j.cnki.1005-5916.2023.12.002
[29]. Li, J., He, Y., & Zhou, Q. (2023). Study on the influence of negative personal information of internet celebrities on consumers' repurchase intention and countermeasures based on TAM model. Journal of Jiangsu University of Science and Technology (Social Sciences Edition), 23(04), 95-102. https://doi.org/10.16148/j.cnki.cn32-1743/c.2023.04.010
[30]. Han, T., Lu, Z., Peng, P., et al. (2023). Study on prefabricated food use will influence factors based on TAM model. Circulation of the National Economy, (23), 13-16. https://doi.org/10.16834/j.carolcarroll.nki.issn1009-5292.2023.23.007
[31]. Su, M., & Chen, M. (2023). Study on the impact of large-scale sports events on residents' intention to participate in physical exercise based on TAM model. In Chinese Society of Sports Science, 13th National Sports Science Conference Special Report (Sports Statistics Branch). Chengdu Sports Institute. https://doi.org/10.26914/c.nkihy.2023.061716
[32]. Cheng, Y., & Wu, Y. (2023). Research on influencing factors of user stickiness in fitness broadcast room based on ELM model. In Chinese Society of Sports Science, 13th National Sports Science Conference -- Wall Poster (Sports Industry Branch). Shanghai Sports Institute. https://doi.org/10.26914/c.nkihy.2023.068067
[33]. Yang, J., Du, T., & Zang, W. (2019). Study on influencing factors of patients' willingness to first visit based on extended TAM-TPB integration model. Journal of Medical Informatics, 44(09), 56-61+73.
[34]. Li, H. (2023). A study on behavioral intention in online college English learning based on TAM model. Overseas English, (18), 128-131+152.
[35]. Zhe, M. (2023). Research on user adoption status and influencing factors of new government media based on TAM model. New Media Research, 9(17), 28-32. https://doi.org/10.16604/j.carolcarroll.nki.issn2096-0360.2023.17.008
[36]. Sang, X. (2019). Analysis of influencing factors of digital RMB usage intention based on Logistic and TAM models. Science and Technology and Industry, 23(16), 57-62.
[37]. Liu, Y., Huang, X., & Yan, T. (2023). Research on acceptability of integrated platform of expressway construction management based on TAM. Highway Engineering, 48(04), 167-173. https://doi.org/10.19782/j.cnki.1674-0610.2023.04.025
[38]. Zhai, Y., Luo, B., Wang, Y., et al. (2019). Influencing factors of patients' willingness to share medical data: Combining improvement planning behavior theory (TPB) and technology acceptance model (TAM). Science and Technology Management Research, 43(16), 235-244.
[39]. Zhang, Y., & Ke, H. (2019). Research on virtual simulation technology acceptance and teaching innovation from the perspective of extended TAM and TTF integration. Modern Information Technology, 7(14), 177-183. https://doi.org/10.19850/j.cnki.2096-4706.2023.14.037
[40]. Zhang, N., Ren, W., Liang, S., et al. (2023). Research on influencing factors of users' intention to use digital reading extension service in library: Based on TAM/AISAS model. Library Work and Study, (7), 18-28. https://doi.org/10.16384/j.carolcarroll.nki.lwas.2023.07.011
[41]. Wu, X., Zhang, W., Li, S., et al. (2023). Research on the chain influence mechanism of intelligent investment advisor user adoption intention based on Technology Acceptance Model (TAM). Journal of Zhejiang University (Humanities and Social Sciences Edition), 53(07), 5-19.
[42]. Wan, C. (2023). A study on the influencing factors of consumers' continuous use behavior of cross-border e-commerce platforms based on TAM model [Doctoral dissertation, Hebei University].
[43]. Zhang, B. (2023). Research on the willingness to use digital RMB based on TAM-TOE model [Doctoral dissertation, Beijing University of Posts and Telecommunications].
[44]. Sun, B., & Guo, Y. (2023). Study on the impact of cultural heritage digitization on national heritage responsibility: Model construction based on TTF and TAM. Tourism Science, 5(3), 71-85. https://doi.org/10.16323/j.carolcarroll.nki.lykx.2023.03.009
[45]. Zhang, X., Yang, H., & Xu, H. (2023). Self-help vending machine behavior will influence factors based on TAM model. Circulation of the National Economy, (12), 28-31. https://doi.org/10.16834/j.carolcarroll.nki.issn1009-5292.2023.12.043
[46]. Zhang, T. (2023). Research on influencing factors of information resource utilization efficiency of government websites based on TAM and TTF [Doctoral dissertation, Tianjin Normal University]. https://doi.org/10.27363/dc.nki.Gtsfu.2023.000549
[47]. Li, J., & Yu, D. (2024). An analysis of users' perceived usefulness of scientific data sharing platform: A case study of National Science and Technology Basic Conditions Platform. Intelligence Magazine, 1-7. Retrieved from http://kns.cnki.net/kcms/detail/61.1167.G3.20230602.1038.016.html
[48]. Zhuo, S. (2023). Study on the influencing factors of user attitude of "Yuedaohuan" fitness APP based on TAM model [Doctoral dissertation, Chengdu Sports Institute]. https://doi.org/10.26987/dc.nki.GCDTC.2023.000183
[49]. Li, M.-B., Wang, W., & Chen, N. (2019). An empirical study on influencing factors of teachers' information-based teaching ability in higher vocational colleges based on TPB-TAM integrated model. Journal of Guangdong Agricultural, Industrial and Technical College, 39(02), 44-50+65.
[50]. Liang, Y., & Li, N. (2023). A study on the willingness to use Chinese digital learning resources and its influencing factors: Based on TAM extended model. Journal of Language and Text Applications, (02), 23-35. https://doi.org/10.16499/j.cnki.1003-5397.2023.02.006
[51]. Li, H., Huang, T., & Li, W. (2023). Based on big data platform of ship remote operations system. Journal of Ship and Ocean Engineering, 33(6), 56-61. https://doi.org/10.14056/j.carolcarroll.nki.naoe.2023.06.009
[52]. Wang, J. (2023). Kewang: Integration of innovation, driving the digital future. Print Manager, (06), 40-41.
[53]. Song, S., Xie, H., Wu, Z., et al. (2023). A practical exploration of digitization empowering primary medical institutions to create a new model of remote service. China Science of Healthcare Administration, 13(06), 77-82.
[54]. Liu, H.-Z., Zhang, B., & Li, R. (2023). Online and remote working promote financial digital transformation. Finance and Accounting, (19), 69-70.