


1 Introduction
The world has entered the era of the digital economy. An urgent challenge in the current economic development of our nation is how to seize the historic opportunities presented by the new industrial revolution and enhance the integration of the digital economy with the real economy. The core of the digital economy lies in the fact that data has become a new engine of competitive advantage for enterprises. As data emerges as a novel factor of production and integrates into the production function, it is inevitable that it will influence the decision-making processes related to the allocation of other production factors within firms. Consequently, how the digital economy reshapes the demand for labor within enterprises has become a critical question. Against the backdrop of an aging population and ongoing economic transformation, the dynamics of labor market supply and demand, as well as employment issues, are of significant concern. In this context, understanding how integrating the digital economy with the real economy will reshape labor demand within enterprises is a pressing issue for policymakers, businesses, and workers alike.
The existing literature on the impact of the digital economy on labor demand is predominantly based on studies from developed countries, and the findings are not consistent. On one hand, the digital economy may increase the level of automation in production, thereby reducing the overall demand for labor (e.g., Agrawal et al., 2019; Zator, 2019; Webb, 2020; Babina et al., 2021). On the other hand, the digital economy may enhance productivity and create new demand for technical labor, increasing the need for highly skilled workers (e.g., Agrawal et al., 2019; Mihet & Philippon, 2019; Babina et al., 2021). The discrepancies in the findings of existing studies stem from a lack of direct characterization of labor skills—specifically, what types of jobs are being replaced by the digital economy, and what new skills are being demanded? This project aims to address these gaps and provide a robust supplement to the existing research.
Overall, there is currently a scarcity of literature that provides evidence from the perspective of micro-level firms, particularly concerning job skill requirements, on how the digital economy reshapes labor demand in Chinese enterprises. The question of how the digital economy affects the scale and skill structure of labor demand in Chinese firms remains largely unanswered. This paper aims to provide a comprehensive response to this question, which holds significant academic value in understanding the impact of the digital economy on labor demand and the reshaping of labor skill structures. Additionally, it offers practical guidance for effectively addressing the challenges posed by the digital economy to socio-economic development and seizing the opportunities it presents.
2 Results
2.1 Data and Variable Construction
2.1.1 Sample and Data Source
This study utilizes all A-share listed companies in China from 2008 to 2021 as the initial research sample and processes the data according to the following steps: (1) Exclude companies classified as ST, *ST, and PT due to their abnormal financial conditions; (2) Remove observations from the year of a company’s IPO and companies that have been delisted; (3) Exclude observations with negative net assets, which are considered abnormal; (4) Delete companies with missing values for key variables. Additionally, we excluded all listed companies in the information transmission, software, and information technology services industries. The big data industry inherently belongs to the information technology sector, and industries directly related to big data may be affected differently than other sectors. According to the theoretical analysis in this paper, the impact of big data adoption on a company’s market value should not be confined to industries directly related to big data; significant effects also exist in industries not directly related to big data. The integration of big data with the real economy and the digital transformation of companies not directly related to big data are the focal points of this study. Therefore, the sample, after excluding the information transmission, software, and information technology services industries, was used for full statistical description, basic regression analysis, heterogeneity tests, and channel tests.
Ultimately, we obtained 32,371 firm-year observations across 3,724 listed companies. The variables related to big data application in this study are derived from text analysis of companies' annual reports, while other market transactions and financial data are primarily sourced from the China Stock Market & Accounting Research (CSMAR) database and the RESSET database, with CPI data obtained from the National Bureau of Statistics. To mitigate the potential interference of outliers on the model estimation results, all continuous variables in this study were winsorized at the 1% and 99% levels.
2.1.2 Firm-Level Big Data Adoption
This study defines the digital economy as an economic form where data serves as a key factor, and the digital transformation of traditional enterprises is characterized by the use of big data as a critical production input. Although there are various interpretations of the digital economy in existing research, previous studies generally acknowledge the central role of data information in the digital economy.
This project measures the level of digital transformation among Chinese listed companies using textual information from the annual reports of A-share listed companies in China. Specifically, we employ Python scripts to systematically extract keywords related to “big data” from these annual reports. The digital economy-related variables are constructed based on the total frequency of all relevant keywords appearing in the reports. The underlying assumption of this measurement approach is that the annual reports disclosed by listed companies objectively reflect their actual operations, and the frequency of digital economy-related keywords in these reports can effectively indicate the extent of the company’s digital transformation.
The keywords related to “big data” include big data, massive data, information assets, datafication, data centers, and computing power. lnBigdata is defined as the logarithm of the keyword frequency plus one. This transformation helps normalize the distribution of the variable and manage any potential skewness in the data. Figure 1 presents the annual trend of keyword frequencies, illustrating how the usage of these terms has evolved over time within the annual reports of the listed companies.
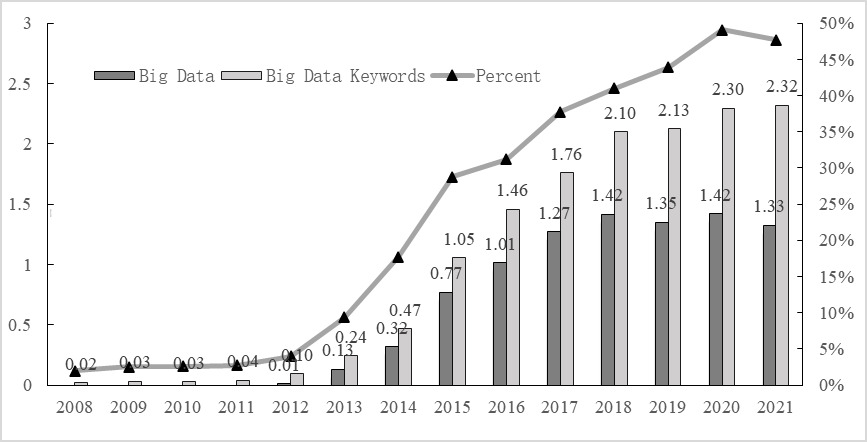
Figure 1. Annual Trend of Big Data Application
2.1.3 Firm-Level Labor Demand
The total labor quantity and skill structure are defined as the number of employees a company hires and the structural characteristics of these employees. Data on the total number of employees (lnEMP), as well as the number of employees in different positions and educational categories, is extracted from the annual reports of listed companies using the RESSET database. Based on this data, the researcher manually organized and standardized the classification information across different companies, allowing for a consistent analysis of employee composition from two dimensions: job type and educational level.
Regarding educational information, this study uses the criterion of “whether an employee holds a college degree” to distinguish between high-education and low-education employees. Specifically, college degrees are further divided into two categories: three-year associate degrees and four-year bachelor’s degrees. Based on this distinction, the logarithmic value of the number of highly educated employees is constructed (Ln_grad_BA and Ln_grad_BA_JBA).
For job position information, the RESSET database’s classification of job types varies across companies. Therefore, this study redefines job categories based on detailed descriptions from the database, grouping positions into six categories: production workers, R&D or technical personnel, administrative staff, financial staff, sales and marketing personnel, and other employees. These categories are further divided into high-skill and low-skill groups based on the nature of the positions. High-skill employees (Ln_HS_Emp) include R&D or technical personnel, financial staff, and sales and marketing personnel, as these positions require a certain level of professional expertise. In contrast, production workers, primarily engaged in repetitive manual labor as blue-collar workers, are categorized as low-skill employees (Ln_LS_Emp) due to the lower professional skill requirements. Similarly, administrative staff are also classified as low-skill. Analogous to the educational classification variables, the logarithmic values of the number of high-skill and low-skill workers are constructed.
2.1.4 Control Variables
To mitigate the issue of omitted variable bias and enhance estimation efficiency, this study controls for a series of variables. (1) Firm size (LnAssets), measured as the natural logarithm of the total assets at the end of the year, adjusted for CPI. (2) Leverage (Lev), calculated as the ratio of total assets to equity at the end of the year. (3) Fixed Asset Ratio (PPE_TA), defined as the ratio of fixed assets to total assets at the end of the year. (4) Firm Age (LnAge), the natural logarithm of one plus the difference between the current year and the year of the firm’s listing. (5) State-Owned Enterprise Dummy Variable (SOE), a binary variable that takes the value of 1 if the firm’s ultimate controller is a state-owned enterprise, administrative institution, or central/local government, and 0 otherwise. (6) Sales Revenue Growth Rate (SalesGrowth), calculated as the difference between the current year’s operating revenue and the previous year’s operating revenue (adjusted for CPI), divided by the previous year’s operating revenue. (7) Return on Assets (ROA), defined as the ratio of net profit to total assets at the end of the year. These control variables are included to account for various factors that could influence the relationship between the digital economy and labor demand, ensuring that the estimated effects are more accurately attributed to the variables of interest. Table 1 presents the summary statistics of all variables that are used in this paper.
Table 1. Summary Statistics
VAR |
Mean |
SD |
p50 |
N |
lnBigdata |
0.361 |
0.705 |
0.000 |
32,371 |
lnEMP |
7.701 |
1.225 |
7.610 |
32,346 |
Ln_grad_BA |
6.053 |
1.323 |
5.938 |
28,675 |
Ln_grad_BA_JBA |
6.622 |
1.269 |
6.488 |
23,237 |
Ln_HS_Emp |
6.449 |
1.199 |
6.339 |
26,423 |
Ln_LS_Emp |
7.115 |
1.389 |
7.093 |
31,656 |
LnAssets |
21.832 |
1.320 |
21.631 |
32,371 |
Lev |
0.430 |
0.206 |
0.425 |
32,371 |
PPE_TA |
0.223 |
0.162 |
0.190 |
32,371 |
lnAge |
2.047 |
0.922 |
2.303 |
32,370 |
SOE |
0.383 |
0.486 |
0.000 |
32,371 |
SalesGrowth |
0.309 |
10.997 |
0.112 |
30,437 |
ROA |
0.038 |
0.078 |
0.038 |
32,371 |
2.2 Empirical Results
2.2.1 Empirical Design
To examine the impact of big data adoption on the labor quantity and skill structure of firms, this paper proposes to construct the following model:
\( Y_{ijpt}=γ_{0}+γ_{1}BigData_{ijpt}+γ_{2}Controls_{ijpt}+δ_{pt}+γ_{jt}+μ_{i}+ξ_{ijpt} \)
In the proposed model, \( Y_{ijpt} \) represents the labor demand measures of firm \( i \) in industry \( j \) , located in province \( p \) , during year \( t \) . The key explanatory variable \( BigData_{ijpt} \) represents the degree of big data application at the firm level, which is measured as the natural logarithm of one plus the frequency of big data-related keywords disclosed in the firm’s annual report(lnBigdata). The control variables \( Controls_{ijpt} \) include firm size, leverage ratio, fixed asset ratio, firm age, state ownership status, sales revenue growth rate, and return on assets, as previously discussed.
The model also includes a full set of fixed effects. \( μ_{i} \) represents firm fixed effects to control for time-invariant characteristics specific to each firm. \( δ_{pt} \) represents province-year fixed effects to control for time-varying characteristics specific to different regions. \( γ_{jt} \) represents industry-year fixed effects to control for time-varying characteristics specific to different industries. \( ξ_{ijpt} \) is the random error term. Standard errors are double-clustered at the firm level to account for potential correlations within these clusters, thereby ensuring robust inference. This approach helps to accurately capture the impact of big data application on the labor demand, while controlling for other relevant factors and addressing potential issues related to heteroskedasticity and autocorrelation.
2.2.2 Big Data Adoption and Total Employment
In the digital economy era, data can substitute for labor, leading to a reduction in the overall labor scale, a phenomenon known as the “substitution effect.” Many tasks within the production process can be regarded as “predictive tasks,” where data-based predictions often have lower marginal costs and higher efficiency compared to labor. As a result, the development of the digital economy has driven the automation of production processes, allowing for the replacement of some tasks that were traditionally performed by labor. This shift reduces the degree of human involvement in production and operations, thereby decreasing the labor demand per unit of output.
Table 2. Big Data Adoption and Total Employment
|
(1) |
(2) |
VARIABLES |
lnEMP |
|
lnBigdata |
0.015* |
0.010 |
(0.009) |
(0.009) |
|
LnAssets |
0.639*** |
0.637*** |
(0.020) |
(0.020) |
|
Lev |
0.166*** |
0.163*** |
(0.062) |
(0.062) |
|
PPE_TA |
0.651*** |
0.680*** |
(0.088) |
(0.086) |
|
lnAge |
0.063*** |
0.060*** |
(0.020) |
(0.021) |
|
SOE |
0.040 |
0.044 |
(0.037) |
(0.037) |
|
SalesGrowth |
0.000 |
0.000* |
(0.000) |
(0.000) |
|
ROA |
-0.015 |
-0.011 |
(0.058) |
(0.058) |
|
Observations |
30,177 |
30,170 |
Year FE |
Yes |
No |
Firm FE |
Yes |
Yes |
Industry*Year FE |
No |
Yes |
Province*Year FE |
No |
Yes |
Adjusted R-squared |
0.918 |
0.919 |
However, big data may have the potential to enhance production efficiency, which can, in turn, increase the overall demand for labor—a phenomenon known as the “productivity effect.” the accumulation and analysis of large-scale data provide enterprises with more detailed, higher signal-to-noise ratio, and more easily disseminated information. This enhanced capability enables companies to better predict various macroeconomic variables, industry supply and demand conditions, and micro-level production factors. Accurate predictions allow firms to make more informed decisions, improving production efficiency. As a result, these improvements can lead to an expansion in production scale and an increased demand for labor in non-automated roles.
Table 2 presents the results. We find that the big data adoption is positively related to total employment in Column (1). However, when we control for the full set of fixed effects in Column (2), the positive relationship is insignificant. In sum, both the substitution and productivity effects exist and these two effects can potentially offset each other.
2.2.3 Big Data Adoption and Skill Composition
The deep integration of the digital economy with the real economy will create more knowledge- and technology-intensive jobs. The digital economy requires professionals with expertise in data processing, analysis, and other data-related skills. Additionally, there is an increasing need for highly skilled workers who can closely integrate big data with core business activities such as production, operations, management, and sales. This integration not only fosters innovation but also drives demand for specialized talent capable of leveraging digital tools to enhance overall business performance and competitiveness. Therefore, we predict that the big data adoption may increase the demand for high-skilled labor but reduce the demand for low-skilled labor.
Table 3. Big Data Adoption and Employee Skill Composition
|
(1) |
(2) |
(3) |
(4) |
(5) |
(6) |
(7) |
(8) |
VARIABLES |
Ln_grad_BA |
Ln_grad_BA_JBA |
Ln_HS_Emp |
Ln_LS_Emp |
||||
lnBigdata |
0.035*** |
0.031*** |
0.051*** |
0.045*** |
0.056*** |
0.053*** |
-0.020* |
-0.021* |
(0.011) |
(0.010) |
(0.011) |
(0.010) |
(0.009) |
(0.009) |
(0.012) |
(0.011) |
|
LnAssets |
0.712*** |
0.713*** |
0.696*** |
0.696*** |
0.634*** |
0.630*** |
0.613*** |
0.602*** |
(0.018) |
(0.018) |
(0.019) |
(0.019) |
(0.020) |
(0.020) |
(0.025) |
(0.025) |
|
Lev |
0.038 |
0.047 |
0.039 |
0.035 |
0.146** |
0.157** |
0.245*** |
0.239*** |
(0.061) |
(0.061) |
(0.066) |
(0.066) |
(0.066) |
(0.065) |
(0.075) |
(0.077) |
|
PPE_TA |
0.271*** |
0.269*** |
0.570*** |
0.597*** |
0.307*** |
0.323*** |
0.852*** |
0.875*** |
(0.082) |
(0.079) |
(0.085) |
(0.084) |
(0.088) |
(0.086) |
(0.113) |
(0.111) |
|
lnAge |
-0.042** |
-0.039* |
-0.031 |
-0.033 |
0.050** |
0.047** |
0.053** |
0.068** |
(0.021) |
(0.021) |
(0.024) |
(0.024) |
(0.021) |
(0.022) |
(0.027) |
(0.027) |
|
SOE |
0.028 |
0.038 |
0.031 |
0.029 |
-0.011 |
-0.006 |
0.048 |
0.046 |
(0.038) |
(0.038) |
(0.032) |
(0.032) |
(0.032) |
(0.032) |
(0.047) |
(0.047) |
|
SalesGrowth |
0.000* |
0.000** |
0.000*** |
0.000*** |
0.003 |
0.003 |
0.000 |
0.000 |
(0.000) |
(0.000) |
(0.000) |
(0.000) |
(0.002) |
(0.002) |
(0.000) |
(0.000) |
|
ROA |
-0.029 |
-0.028 |
0.000 |
-0.005 |
-0.027 |
-0.025 |
-0.030 |
-0.029 |
(0.059) |
(0.058) |
(0.076) |
(0.076) |
(0.064) |
(0.063) |
(0.072) |
(0.071) |
|
Observations |
26,675 |
26,667 |
21,620 |
21,612 |
24,721 |
24,698 |
29,531 |
29,524 |
Year FE |
Yes |
No |
Yes |
No |
Yes |
No |
Yes |
No |
Firm FE |
Yes |
Yes |
Yes |
Yes |
Yes |
Yes |
Yes |
Yes |
Industry*Year FE |
No |
Yes |
No |
Yes |
No |
Yes |
No |
Yes |
Province*Year FE |
No |
Yes |
No |
Yes |
No |
Yes |
No |
Yes |
Adjusted R-squared |
0.910 |
0.911 |
0.911 |
0.913 |
0.914 |
0.915 |
0.883 |
0.884 |
Table 3 presents the results. Consistent with our prediction, the number of employees with bachelor’s degrees is positively associated with big data adoption, as shown in Columns (1) to (4). Similarly, the number of employees in high-skilled occupations is positively associated with big data adoption, as shown in Columns (5) and (6). In contrast, the relationship between the number of employees in low-skilled occupations and big data adoption is significantly negative, as shown in Columns (5) and (6).
We also test the relationship between big data adoption and the number of employees by occupation. The results are reported in Table 4. We find that big data adoption increases the number of financial staff, marketing personnel, and R&D or technical personnel (Panel A), but reduces the number of production workers and administrative staff (Panel B).
3 Conclusion
This paper examines the relationship between big data adoption and firm-level employment. First, this paper utilizes the annual reports disclosed by Chinese A-share listed companies to extract keywords related to “big data” and constructs a firm-level indicator to measure the extent of big data application. Based on this indicator, the study provides a detailed description of the application of big data among Chinese listed companies. This approach allows for an empirical analysis of how extensively firms are integrating big data into their operations, offering insights into the current state of digital transformation. Then, we find that the big data adoption does not have significant effects on total employment, indicating that both the substitution and productivity effects exist and these two effects can potentially offset each other. Additionally, big data adoption significantly increases the demand for high-skilled labor but reduces the demand for low-skilled labor. This paper provides empirical evidence on the economic effects of the integration of big data with traditional enterprises.
Table 4. Big Data Adoption and Employees by Occupation
Panel A. Financial Staff, Marketing Personnel, and R&D or Technical Personnel
|
(1) |
(2) |
(3) |
(4) |
(5) |
(6) |
VARIABLES |
Ln_fin |
Ln_mkt |
Ln_RD_Tech |
|||
lnBigdata |
0.025*** |
0.022*** |
0.055*** |
0.054*** |
0.038** |
0.030* |
(0.008) |
(0.008) |
(0.012) |
(0.012) |
(0.018) |
(0.017) |
|
LnAssets |
0.574*** |
0.568*** |
0.566*** |
0.560*** |
0.593*** |
0.577*** |
(0.016) |
(0.016) |
(0.029) |
(0.028) |
(0.041) |
(0.042) |
|
Lev |
0.227*** |
0.239*** |
0.116 |
0.137 |
0.001 |
0.015 |
(0.050) |
(0.050) |
(0.087) |
(0.086) |
(0.126) |
(0.126) |
|
PPE_TA |
0.303*** |
0.324*** |
0.015 |
0.049 |
0.560*** |
0.554*** |
(0.074) |
(0.072) |
(0.140) |
(0.137) |
(0.180) |
(0.176) |
|
lnAge |
0.044** |
0.040** |
0.097*** |
0.096*** |
-0.024 |
0.023 |
(0.019) |
(0.019) |
(0.029) |
(0.030) |
(0.049) |
(0.049) |
|
SOE |
0.037 |
0.036 |
-0.087* |
-0.086* |
-0.005 |
0.003 |
(0.028) |
(0.028) |
(0.049) |
(0.049) |
(0.078) |
(0.081) |
|
SalesGrowth |
0.003*** |
0.003*** |
0.001 |
0.001 |
-0.001** |
-0.001** |
(0.001) |
(0.001) |
(0.004) |
(0.004) |
(0.000) |
(0.000) |
|
ROA |
-0.118*** |
-0.106** |
0.053 |
0.057 |
0.016 |
0.057 |
(0.043) |
(0.043) |
(0.078) |
(0.079) |
(0.111) |
(0.110) |
|
Observations |
27,295 |
27,288 |
26,103 |
26,077 |
30,197 |
30,190 |
Year FE |
Yes |
No |
Yes |
No |
Yes |
No |
Firm FE |
Yes |
Yes |
Yes |
Yes |
Yes |
Yes |
Industry*Year FE |
No |
Yes |
No |
Yes |
No |
Yes |
Province*Year FE |
No |
Yes |
No |
Yes |
No |
Yes |
Adjusted R-squared |
0.906 |
0.907 |
0.890 |
0.891 |
0.630 |
0.634 |
Panel B. Production Workers and Administrative Staff
|
(1) |
(2) |
(3) |
(4) |
VARIABLES |
Ln_prd |
Ln_staff |
||
lnBigdata |
-0.103*** |
-0.095*** |
0.006 |
-0.001 |
(0.029) |
(0.028) |
(0.016) |
(0.016) |
|
LnAssets |
0.479*** |
0.449*** |
0.617*** |
0.606*** |
(0.061) |
(0.061) |
(0.029) |
(0.029) |
|
Lev |
0.463** |
0.450** |
0.064 |
0.081 |
(0.180) |
(0.183) |
(0.109) |
(0.110) |
|
PPE_TA |
1.204*** |
1.214*** |
0.423*** |
0.407*** |
(0.270) |
(0.268) |
(0.141) |
(0.140) |
|
lnAge |
0.046 |
0.075 |
-0.028 |
-0.011 |
(0.067) |
(0.067) |
(0.044) |
(0.047) |
|
SOE |
-0.019 |
-0.067 |
0.057 |
0.067 |
(0.097) |
(0.097) |
(0.062) |
(0.065) |
|
SalesGrowth |
-0.001** |
-0.001** |
0.000 |
0.000 |
(0.000) |
(0.000) |
(0.000) |
(0.000) |
|
ROA |
0.093 |
0.091 |
-0.137 |
-0.128 |
(0.170) |
(0.170) |
(0.096) |
(0.096) |
|
Observations |
30,197 |
30,190 |
30,197 |
30,190 |
Year FE |
Yes |
No |
Yes |
No |
Firm FE |
Yes |
Yes |
Yes |
Yes |
Industry*Year FE |
No |
Yes |
No |
Yes |
Province*Year FE |
No |
Yes |
No |
Yes |
Adjusted R-squared |
0.708 |
0.710 |
0.564 |
0.567 |
Funding Project
The author acknowledges financial support from the National Natural Science Foundation of China (Project 72203250) and the projects funded by China Postdoctoral Science Foundation (Projects 2022M713661 and 2022T150766).
References
[1]. Agrawal, A., Gans, J. S. and Goldfarb A. (2019). Artificial Intelligence: The Ambiguous Labor Market Impact of Automating Prediction. Journal of Economic Perspectives, 33(2), 31—49.
[2]. Babina, T., Fedyk, A., He, A. X., and Hodson J. (2021). Artificial Intelligence, Firm Growth, and Industry Concentration, Firm Growth, and Industry Concentration.
[3]. Mihet, R., & Philippon, T. (2019), The Economics of Big Data and Artificial Intelligence, Disruptive Innovation in Business and Finance in the Digital World (International Finance Review, Vol. 20), Emerald Publishing Limited, 29—43.
[4]. Webb, M. (2020), The Impact of Artificial Intelligence on the Labor Market, Working Paper.
[5]. Zator, M. (2019), Digitization and Automation: Firm Investment and Labor Outcomes, Working Paper.
Cite this article
Zhang,Y. (2024). Big Data and Labor Demand. Journal of Applied Economics and Policy Studies,8,61-67.
Data availability
The datasets used and/or analyzed during the current study will be available from the authors upon reasonable request.
Disclaimer/Publisher's Note
The statements, opinions and data contained in all publications are solely those of the individual author(s) and contributor(s) and not of EWA Publishing and/or the editor(s). EWA Publishing and/or the editor(s) disclaim responsibility for any injury to people or property resulting from any ideas, methods, instructions or products referred to in the content.
About volume
Journal:Journal of Applied Economics and Policy Studies
© 2024 by the author(s). Licensee EWA Publishing, Oxford, UK. This article is an open access article distributed under the terms and
conditions of the Creative Commons Attribution (CC BY) license. Authors who
publish this series agree to the following terms:
1. Authors retain copyright and grant the series right of first publication with the work simultaneously licensed under a Creative Commons
Attribution License that allows others to share the work with an acknowledgment of the work's authorship and initial publication in this
series.
2. Authors are able to enter into separate, additional contractual arrangements for the non-exclusive distribution of the series's published
version of the work (e.g., post it to an institutional repository or publish it in a book), with an acknowledgment of its initial
publication in this series.
3. Authors are permitted and encouraged to post their work online (e.g., in institutional repositories or on their website) prior to and
during the submission process, as it can lead to productive exchanges, as well as earlier and greater citation of published work (See
Open access policy for details).
References
[1]. Agrawal, A., Gans, J. S. and Goldfarb A. (2019). Artificial Intelligence: The Ambiguous Labor Market Impact of Automating Prediction. Journal of Economic Perspectives, 33(2), 31—49.
[2]. Babina, T., Fedyk, A., He, A. X., and Hodson J. (2021). Artificial Intelligence, Firm Growth, and Industry Concentration, Firm Growth, and Industry Concentration.
[3]. Mihet, R., & Philippon, T. (2019), The Economics of Big Data and Artificial Intelligence, Disruptive Innovation in Business and Finance in the Digital World (International Finance Review, Vol. 20), Emerald Publishing Limited, 29—43.
[4]. Webb, M. (2020), The Impact of Artificial Intelligence on the Labor Market, Working Paper.
[5]. Zator, M. (2019), Digitization and Automation: Firm Investment and Labor Outcomes, Working Paper.