


1 Introduction
Since the end of the last century, when computer and network technologies began to be widely used in enterprises, they have undergone several decades of iteration and upgrading, and the latest generation of technologies have begun to partially replace the roles of human capital, capital, and land in past traditional investment and business activities. Information and networks are now becoming a key production factor in modern economic activities, and the application of algorithms has allowed some high-tech enterprises to break through certain traditional theoretical economic laws of return and achieve abnormal profit levels, thereby achieving a certain degree of monopoly status. This has greatly compressed the space for emerging developing countries to make high-tech advancements, and key core technologies have had to be controlled by others, making economic development lack vitality and creativity. In such a trend, in order to strengthen China's voice in the world economy and ensure the healthy, stable, and sustainable development of high-end industries, the State Council issued the "Broadband China Strategy and Implementation Plan" in August 2013. Based on this document, the Ministry of Industry and Information Technology and the National Development and Reform Commission selected 117 prefecture-level cities as pilot cities for "Broadband China" in 2014, 2015, and 2016 in three batches. After the policy was implemented, China's network infrastructure was significantly improved and popularized, especially the application level of network technology in pilot cities was greatly developed, helping promote information exchange across all industries and the entire industrial chain in China, thereby improving productivity and efficiency. However, looking back through history, the popularization and application of new technologies are always a process of both opportunities and risks. Perez (2013) believes that the transmission mechanism of "technological revolution → financial bubble → economic collapse" is a historical phenomenon that needs to be particularly vigilant. [1] In the context of China's economy gradually slowing down its growth pace, manufacturing, as a representative of the real economy, plays an irreplaceable role in stabilizing China's economic base. Therefore, special attention should be paid to the impact of network technology innovation on manufacturing enterprises, preventing them from deviating from their main business and over-financializing. The academic contribution of this paper is to propose that network infrastructure construction will optimize the receivables management of manufacturing enterprises, revealing the influence mechanism of network infrastructure optimization on manufacturing enterprises' financialization. The practical contribution of this paper is to help the government perfect the "new infrastructure" policy, with a service orientation towards the real economy, to better achieve supply-side structural reform.
Historical data and related studies suggest that technological innovation often leads to financial innovation [2], and higher-yielding but also riskier financial products will emerge. After raising funds through the use of these high-risk products, financial institutions will invest in high-growth companies to ensure that they can pay adequate interest to the buyers of their financial products, which in turn will promote technological progress in emerging industries. In addition, economic studies of technological innovation also include research on the relationship between innovation as a whole and at specific time periods [3], which has found significant differences in innovative capacity between different provinces at different stages. In recent years, there have also been many studies on patent-based technological innovation [4-6] and green technological innovation [7-10], among other subfields, which have produced a variety of different mechanisms and impacts, such as the finding that patent-based technological innovation can significantly enhance a company's investment value, but that management may take a negative attitude towards subsequent research and development if the innovation fails.
Specifically in the research on the "Broadband China" policy, there have been many scholars who have discussed the different effects of the policy. On the micro level, there are mainly discussions on technical knowledge, data assets, and entrepreneurial levels [11-13], which find that the "Broadband China" policy can strengthen the positive externalities of technical knowledge, and the innovation capabilities of subsidiary companies can be raised in sync with the parent company. In addition, "Broadband China" can also promote the high-quality development of enterprises and enhance the entrepreneurial vitality of a place. On the macro level, there are discussions on urban innovation, economic growth, pollution control, and income disparity [14-16], which find that the "Broadband China" policy can promote the overall improvement of urban innovation levels and economic growth, and reduce air pollution represented by haze. In summary, the above studies show that the "Broadband China" policy can produce composite effects on the three levels of enterprises, cities, and countries, and can promote the balanced development of the macroeconomy while also forcing micro-enterprises to update their technologies and optimize their management to seek various competitive advantages. However, at the same time, it is necessary to pay attention to the negative effects of technological progress, such as the possible widening of income disparity [17-19], monopoly by large enterprises [20], new challenges in tax administration [21], rising negative externalities of enterprises [22] etc.
This paper uses the financial data and other relevant data of listed manufacturing enterprises on the A-share market from 2010 to 2020, based on the multi-point double-difference model, to explore the impact of the "Broadband China" policy on manufacturing enterprises. Compared with existing literature, its contribution lies in: academic contribution, proposing that the construction of network and other digital infrastructure can improve the enterprise's accounts receivable credit asset management, which improves the enterprise's operational efficiency and optimizes the asset structure, but also inevitably deepens the enterprise's financialization level, causing it to deviate from its original business and providing new empirical evidence for the "technological revolution - financial bubble" cycle. In addition, previous studies only studied all industries in a general way and paid less attention to a specific industry. This paper focuses on the manufacturing industry, a pillar industry of the national economy, and found the financialization trend of manufacturing enterprises in technological upgrading and replacement, providing reference and guidance for researchers of enterprise development-related theories. Practical contribution: the results of this paper provide reference for optimizing the existing and future "new infrastructure" plans, enabling the government to have a better understanding of the impact of "new infrastructure" on manufacturing enterprises and better respond to the concerns of enterprises.
2 Background and Theoretical Analysis
2.1 Background Information
The "Broadband China" strategy was launched by the State Council on August 17, 2013, marking it as a national strategy and the first time that broadband has been defined as a national strategic public infrastructure. The main content of the "Broadband China" strategy includes two stage-targets: the first is to basically achieve fiber-optic access into households and villages in pilot cities by 2015, with the penetration rate of fixed broadband exceeding 50%, and to bring the access rate and speed of broadband to public institutions and administrative villages to new heights; the second is to achieve full coverage of broadband networks in urban and rural areas by 2020, deep integration of broadband networks into daily production and life, comprehensive popularization of mobile internet, gradual improvement of the network security and information security system, and reaching the leading level of broadband application worldwide. As the policy began to enter the pilot phase, a total of 117 prefecture-level cities were successively included in the pilot list in 2014, 2015, and 2016. The cities included in the pilot list also need to strive to improve their network construction level, especially to increase the scale of broadband users and the transmission speed of broadband networks, so that the level of application of broadband networks is significantly higher than before the pilot, and even reaches the leading level nationwide, providing relevant experience for the full rollout of the "Broadband China" policy.
The determination of pilot cities for the "Broadband China" initiative was mainly based on cities submitting application materials, followed by a review and on-site investigation by the NDRC and MIIT to determine whether the city was eligible. From this process, although cities with leading network infrastructure were more likely to actively apply and be selected, the final list of pilot cities included Beijing, Shanghai and other first-tier cities, as well as Aba, Alar and Wenshan, cities with relatively weak infrastructure. Therefore, this paper believes that the determination of pilot cities for the "Broadband China" initiative has no bias. Furthermore, the robustness test results show that the sample selected in this paper meets the assumption of common trend, which is a prerequisite for conducting multi-time-point double difference analysis. In summary, it is reasonable to choose to study the "Broadband China" policy, which may be an exogenous policy shock.
2.2 Theoretical Analysis
2.2.1 The Impact of Optimizing Network Infrastructure on Financialization Level
One common characteristic of Chinese enterprises at present is that the amount of accounts receivable is large and the proportion is high, even leading to the situation where "moving assets are not moving". [23] Especially for manufacturing enterprises with large-scale procurement and sales, delayed delivery and delayed payment are quite common. For example, manufacturing enterprises often have to wait several months after shipping to receive payment for sales. In fact, accounts receivable is common in manufacturing enterprises all over the world. The proportion of accounts receivable for most enterprises is often over 10%, and the average accounts receivable for some industries can even reach 30% or more. However, as China is the world's manufacturing hub and manufacturing is a major part of the national economy, even if only a few enterprises or industries have excessively high accounts receivable, it will have a negative impact on the overall economy, mainly in terms of increasing bad debt and credit risks, slowing down the repayment speed, raising the overall leverage level of the industry, and seriously inflating the economy. The purpose of accounts receivable is to make the economy run more smoothly, without being too rigid about "paying in advance for goods and services," allowing for quick movement of factors. However, a high accounts receivable ratio means that most of a company's profits are earned through credit sales, which also means that its products are not selling well and its profitability is poor. The high sales figure behind this is hiding many risks. If the turnover time is too long, there is a risk of a funding gap, which will directly threaten the survival of the company. Reducing the accounts receivable ratio and keeping it within a reasonable range has the following significant meanings for companies: Firstly, it can alleviate the company's financial pressure, which is the most direct and effective effect. The alleviation of financial pressure will be of great benefit to manufacturing enterprises. After improving the accounts receivable turnover rate, manufacturing enterprises can use the spare funds for other profit points instead of being locked in the sales end for a long time. Holding financial products and earning interest is a good option. Secondly, it can reduce bad debt risks and reduce the probability of credit risk occurring. In addition, since accounts receivable is closely related to current assets, revenue, and profit [23], controlling accounts receivable risks can also The mechanism by which the "Broadband China" policy helps enterprises optimize their accounts receivable management and reduce the proportion of accounts receivable is that it forces pilot cities' enterprises to improve their networked and information-based construction levels, using network systems to connect internal departments and effectively communicate with upstream and downstream enterprises, to understand customer needs and at the same time learn more about customers through the network. The enterprises can then select high-quality customers and set reasonable delayed payment periods based on their characteristics, reducing the risk of bad accounts receivable and avoiding credit sales that may result in losses.
Optimizing accounts receivable management and reducing the proportion of accounts receivable can lower the operating risk of a company and alleviate its cash shortage. Lowering operating risk will enable a company to be more willing to bear financial risks as compensation, so it will tend to increase its holding of financial products and deepen its financialization. Meanwhile, alleviating cash pressure will enable a company to allocate excess funds into the financial market to try to obtain high returns by exploiting market fluctuations, thereby enhancing its overall profitability. Therefore, from these two perspectives, if a company can indeed improve its accounts receivable management level through network infrastructure optimization, it is likely to increase its holding of financial assets.
Based on the above analysis, the following research hypothesis is proposed:
H1: Network infrastructure optimization enhances the level of financialization of manufacturing enterprises
H2: Network infrastructure optimization enhances the level of financialization of manufacturing enterprises by optimizing accounts receivable management and reducing the proportion of accounts receivable.
2.2.2 Differences in Corporate Size and Financialization
The biggest difference between large manufacturing enterprises and small and micro enterprises is the size of the enterprise, but there are also other differences that accompany the size difference, such as policy support, technological level, etc. For example, large manufacturing enterprises often play a crucial role in local economies, and the taxes they contribute and the jobs they provide are difficult for other enterprises to fully replace. Therefore, when such large manufacturing enterprises encounter crises, the government often steps in to provide assistance, including providing policy guidance, acting as a mediator in business disputes, and even injecting funds or using administrative power to remove the enterprise's debt. This creates a de facto situation where "large enterprises cannot collapse," and it also gives them an unfair competitive advantage. Such situations were common after the reform and opening up, but have gradually disappeared in recent years as administrative legalization has progressed. In contrast, small and medium-sized enterprises often have to face such difficulties on their own when they encounter such situations. Only when policy demands it (such as when the state requires support for small and medium-sized enterprises) will local governments provide assistance to small and medium-sized enterprises. Countless small and medium-sized enterprises have fallen behind in competition with large enterprises, and behind the surface competition in the market is deeper-level unfair competition by large enterprises. In the second aspect of technical level, large manufacturing enterprises also have leading technology compared to small and medium-sized enterprises, and these technologies are often two generations or more ahead of those of small and medium-sized enterprises. Except for some small and medium-sized enterprises with strong independent innovation ability and policy support as "specialized, specialized, and innovative," the remaining small and medium-sized enterprises often only have access to obsolete products from large enterprises, fundamentally limiting their ability to compete with large enterprises.
Based on the above analysis, the following research hypothesis is proposed:
H3: Compared to small and medium-sized enterprises, the improvement of network infrastructure is more significant in promoting the financialization of large manufacturing enterprises.
2.2.3 Diversification of Business and Level of Financialization
Modern enterprises often involve to some extent diversified operations, and the characteristics of diversified enterprises are numerous and complex business lines. The manifestation of diversified operations in manufacturing enterprises is mainly the manufacture of multiple products, which are often related or interconnected. The difficulty of switching manufacturing processes is not great. The benefits of diversified operations are that they enable enterprises to broaden their business scope, provide the market with more diversified products, and not focus solely on one product or market. The significance lies in the following two aspects: firstly, expanding profit margins by operating the enterprise with the perspective of "adding one product equals adding one profit point" to improve profitability, expand the market, and make the brand deeply rooted in the minds of new consumers, which will be beneficial to the long-term development of the enterprise and lay a good foundation for the enterprise to switch tracks in the future; secondly, achieving risk hedging by helping reduce profit losses when one product loses its market advantage through the sales of other products, achieving risk diversification, and maintaining stable operation of the enterprise. The motivation of manufacturing enterprises in China is mainly to improve profitability, and this has different expressions in advantage enterprises and non-advantage enterprises. Specifically for non-dominant enterprises, due to the low profit level of the manufacturing industry, especially traditional manufacturing enterprises, it is common for products to become unsalable and factories to shut down in response to market changes. In addition, the manufacturing industry is highly competitive, and enterprises are often in a loss-making state. In order to survive, they have no choice but to produce more different kinds of products to ensure income. For dominant enterprises, after tasting the supernormal profit of more than the average return, they will naturally try to obtain more returns to take the enterprise to the next level. Diversified operations have been a common choice for domestic and foreign enterprises to further develop throughout history. The "Broadband China" policy also eases the proportion of receivables for highly diversified enterprises, thus providing financial space for the asset financialization. For example, enterprises can bear higher transaction costs to support larger asset conversions, providing new incentives for the financialization of highly diversified enterprises.
Based on the above analysis, the following research hypothesis is proposed:
H4: Compared with lowly diversified enterprises, the improvement of network infrastructure is more significant in promoting the financialization of highly diversified manufacturing enterprises.
3 Research Design
Based on the research by Xue Cheng et al. [11], a multi-point double-difference model is established to identify the impact of the "Broadband China" policy on the financialization degree of manufacturing enterprises:
\( FINRATIO_{ict}=β_{0}+β_{1}Policy_{ct}+λX_{ict}+δ_{i}+τ_{t}+ε_{ict} \) (1)
Specifically, the subscript i denotes a firm, c denotes a city, and t denotes a year. The dependent variable FINRATIOict represents the financialization degree of firm i located in city c in year t. Policyct is a policy variable indicating whether city c is selected as a demonstration city for "Broadband China" in year t. If city c is selected in year t, Policyct takes the value of 1 in that year and subsequent years, otherwise it takes the value of 0. Xict is a set of firm- and city-level control variables, δ represents a firm-specific fixed effect, τ represents a year-specific fixed effect, and εict represents a random disturbance term. Taking into account the heteroscedasticity and serial correlation of the random disturbance term, robust standard errors are estimated at the prefecture level using clustering.
Table 1. Variable Definition
Variable types |
Name |
Definition |
Dependent variable |
FINRATIO |
(Trading Financial Assets + Derivative Financial Assets + Loans and Advances Net + Available-for-Sale Financial Assets Net + Held-to-Maturity Investments Net + Investment Property Net) / Total Assets |
finratio |
The dummy variables are whether the enterprise has purchased trading financial assets, derivative financial assets, available-for-sale financial assets, held-to-maturity investments, investment properties, and whether it has provided loans and advances. A value of 1 indicates a purchase, while a value of 0 indicates no purchase. |
|
finratio1 |
The proportion of non-financial enterprises' investment income, fair value gains and other comprehensive income from financial channels to operating profit |
|
Independent variable |
Policy |
The policy implementation year is 1, and the year before that is 0. |
Controlled variables |
LA |
Accounts receivable/Revenue |
Lev |
Total liabilities/total assets |
|
ROE |
Net Profit/Owner's Equity |
|
ATO |
Net operating revenue/average total assets |
|
Top5 |
The top five shareholders' share of ownership |
|
Dual |
Is the chairman and the general manager the same person? Yes=1, No=0. |
|
Growth |
Revenue Growth Rate |
|
Indep |
Number of Independent Directors / Total Number of Board Members |
|
SOE |
State-owned entities are 1, non-state-owned entities are 0. |
|
Cashflow |
Operating Cash Flow Net/Current Liabilities |
|
Dig |
Count the number of occurrences of each digital feature word in the annual reports of listed companies. |
|
Year |
Annual dummy variable |
|
code |
Business Individual Binary Variable |
Table 2. Descriptive Statistics
Variable |
Sample size |
Average value |
Median |
Standard deviation |
Minimum value |
Maximum value |
FINRATIO |
18974 |
0.0315 |
0.00351 |
0.071 |
-0.000179 |
0.949 |
finratio |
18974 |
0.685 |
1 |
0.465 |
0 |
1 |
finratio1 |
18974 |
0.191 |
0.0183 |
5.484 |
-177.9 |
457.7 |
Policy |
18974 |
0.471 |
0 |
0.499 |
0 |
1 |
LA |
18942 |
0.132 |
0.117 |
0.0952 |
0 |
0.813 |
Lev |
18974 |
0.386 |
0.373 |
0.201 |
0.00708 |
1.957 |
ROE |
18951 |
0.064 |
0.075 |
0.254 |
-14.82 |
2.379 |
ATO |
18973 |
0.685 |
0.599 |
0.434 |
0.00026 |
7.871 |
Top5 |
18948 |
0.541 |
0.543 |
0.15 |
0.0691 |
0.992 |
Dual |
18974 |
0.317 |
0 |
0.465 |
0 |
1 |
Growth |
18971 |
0.277 |
0.112 |
4.16 |
-0.985 |
429 |
Indep |
18946 |
0.375 |
0.333 |
0.0551 |
0.182 |
0.8 |
SOE |
18974 |
0.268 |
0 |
0.443 |
0 |
1 |
Cashflow |
18973 |
0.0485 |
0.0471 |
0.0712 |
-0.742 |
0.664 |
4 Empirical Analysis
4.1 Benchmark regression
The benchmark regression results for the model are shown in columns (1) and (2) of Table 3. Column (1) controls for firm and year fixed effects but does not include control variables, while column (2) includes all control variables on top of column (1). Both columns (1) and (2) show that, compared to the control group, the financialization level of the treatment firms is significantly positive at the 5% level, meaning that optimizing network infrastructure will increase the financialization level of manufacturing firms, thus verifying Hypothesis H1.
Table 3. Benchmark Regression Result
(1) |
(2) |
|
VARIABLES |
FINRATIO |
FINRATIO |
Policy |
0.00380** (0.00155) |
0.00369** (0.00155) |
Lev |
-0.0177*** (0.00395) |
|
ROE |
0.00197 (0.00166) |
|
ATO |
-0.00836*** (0.00189) |
|
Top5 |
-0.0410*** (0.00593) |
|
Dual |
-0.00126 (0.00131) |
|
Growth |
0.000122 (0.000110) |
|
Indep |
-0.0214* (0.0110) |
|
SOE |
-0.00577* (0.00307) |
|
Cashflow |
-0.0171*** (0.00662) |
|
Constant |
0.0281*** (0.000803) |
0.0736*** (0.00605) |
Observations |
18629 |
18603 |
R-squared |
0.572 |
0.574 |
4.2 Robustness test
4.2.1 Parallel trend test
Using a multi-time-point double-difference model, this paper aims to identify the possible impact of the "Broadband China" policy on the financialization of manufacturing enterprises. The parallel trend assumption is an important prerequisite for this model, which requires that the financialization trends of the treatment group and the control group remain parallel (co-moving) before the implementation of the "Broadband China" policy. This paper uses the event study method to analyze the data, which can test the validity of the parallel trend assumption while excluding other factors' interference, and also examine the trend of the economic effects of the "Broadband China" policy over time. The specific model is as follows:
\( FINRATIO_{ict}=β_{0}+\sum_{k=-6}^{k=6}β_{k}×Policy_{ic,t+k}+λX_{ict}+δ_{i}+τ_{t}+ε_{ict} \) (2)
Specifically, Policyic,t+k is a series of dummy variables that represent whether city c is selected as a pilot city for "Broadband China" in year k. Figure 2 shows the results of the parallel trend test, and it is not difficult to find that the estimated coefficient of the corresponding virtual variable before the city was selected as a pilot city for "Broadband China" is not significant and close to 0, indicating that the parallel trend assumption is satisfied.
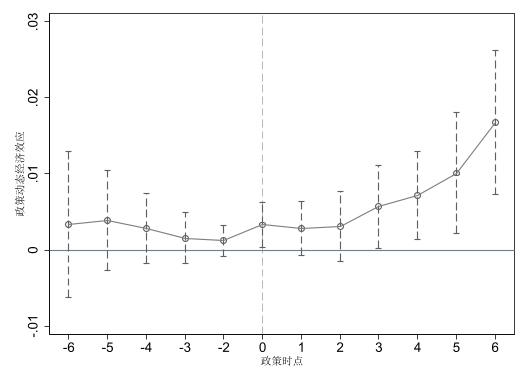
Figure 1. Parallel Trend Test
4.2.2 Placebo test
To eliminate the influence of other policies or random factors and ensure that the financialization degree of manufacturing enterprises is only affected by the "Broadband China" policy, following the approach of Song Heng et al. (2023)[24], this paper conducts a placebo test by artificially creating a treatment group through random selection of some enterprises as the ones affected by the policy, with the remaining enterprises serving as the control group for regression. Based on this, the paper repeats the sampling 500 times and plots the probability density distribution chart of their estimates. Ideally, this distribution will be far from the true regression coefficient. The regression results are shown in Figure 3, and the placebo test estimates coefficients that are approximately normally distributed and far from the true regression coefficient of 0.00369, indicating that the benchmark regression results are robust and not affected by other policies or random factors. The placebo test passes.
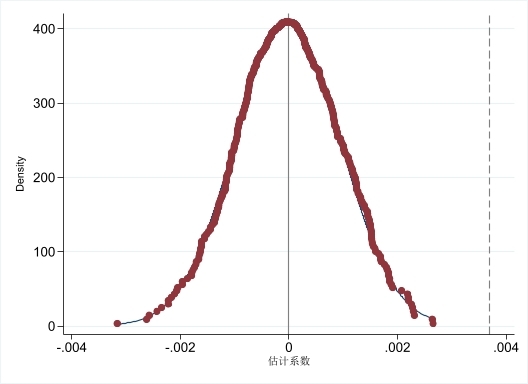
Figure 2. Placebo Test
4.2.3 PSM-DID
To avoid potential selection bias, propensity score matching (PSM) was conducted on the sample of the treatment group and the control group based on all control variables, and then a multi-time-point double difference estimation was conducted again to enable a more reasonable comparison between the experimental group and the control group. The matching method adopted in this paper is a 1:1 nearest neighbor matching with replacement (radius of 0.1). After the sample was matched, the impact effect of the "Broadband China" policy was re-estimated, and no significant changes were found in Table 4, indicating that the baseline regression results are robust.
Table 4. Benchmark Regression Result
(1) |
|
VARIABLES |
FINRATIO |
Policy |
0.00325* (0.00166) |
Lev |
-0.0188*** (0.00419) |
ROE |
0.00104 (0.00234) |
ATO |
-0.00814*** (0.00201) |
Top5 |
-0.0399*** (0.00623) |
Dual |
-0.000552 (0.00138) |
Growth |
0.000124 (0.000112) |
Indep |
-0.0249** (0.0115) |
SOE |
-0.00657** (0.00329) |
Cashflow |
-0.0184*** (0.00696) |
Constant |
0.0750*** (0.00638) |
Observations |
17194 |
R-squared |
0.584 |
4.2.4 Change the measurement indicators of financialization
In order to avoid the interference of different financialization measurement methods on the regression results, this paper examines two other methods of measuring the degree of enterprise financialization:
(1) A dummy variable, finratio, was introduced to represent the substitution variable of corporate financialization, which indicates whether the enterprise has purchased trading financial assets, derivative financial assets, available-for-sale financial assets, held-to-maturity investments, investment properties, or whether it has engaged in lending and intermediation activities.
(2) Following the approach of Zhang Chengsi (2016), we use the ratio of financial gains from non-financial enterprise investment income, fair value changes, and other comprehensive income, etc., as an indicator to measure the degree of financialization (finratio1) of an enterprise. [25]
Adding the above two variables as new explanatory variables to the regression yields the results shown in Table 5. The policy variable Policy still has a significant positive impact on financialization.
Table 5. Changes the Result of the Explained Variable Estimate.
(1) |
(2) |
|
VARIABLES |
finratio |
finratio1 |
Policy |
0.0536*** (0.0109) |
0.307* (0.183) |
Lev |
0.223*** (0.0279) |
-0.120 (0.466) |
ROE |
0.0118 (0.0117) |
-0.0640 (0.196) |
ATO |
-0.0281** (0.0133) |
-0.206 (0.223) |
Top5 |
-0.530*** (0.0419) |
-1.482** (0.701) |
Dual |
-0.0149 (0.00928) |
0.207 (0.155) |
Growth |
0.00102 (0.000779) |
0.00658 (0.0130) |
Indep |
-0.0891 (0.0780) |
5.189*** (1.305) |
SOE |
0.0591*** (0.0216) |
0.141 (0.362) |
Cashflow |
0.0678 (0.0467) |
-1.671** (0.782) |
Constant |
0.895*** (0.0427) |
-0.928 (0.714) |
Observations |
18603 |
18603 |
R-squared |
0.549 |
0.108 |
4.3 Further analysis
4.3.1 Mechanism Analysis
The benchmark regression indicates that network infrastructure optimization significantly deepens the degree of financialization of manufacturing enterprises. In order to explore its impact mechanism, the ratio of accounts receivable to revenue is used as a mediator variable in the regression. The following model is constructed:
\( LA_{ct}=β_{1}Policy_{it}++λX_{ict}+δ_{i}+τ_{t}+ε_{ict} \) (3)
\( FINRATIO_{ict}=β_{0}+β_{1}Policy_{ct}+β_{2}LA_{it}++λX_{ict}+δ_{i}+τ_{t}+ε_{ict} \) (4)
The results of the mechanism test are shown in Table 6. When the receivables ratio LA is introduced as the dependent variable, the policy variable Policy is significantly negative at the 1% level when it is the independent variable, but becomes significantly positive when it is added to the regression as an explanatory variable, while LA becomes significantly negative. This indicates that the optimization of receivables management plays a partial mediating role in the impact of network infrastructure on financialization, thereby verifying Hypothesis H2.
Table 6. Mechanism Test
(1) |
(2) |
|
VARIABLES |
LA |
FINRATIO |
LA |
-0.0550*** (0.00918) |
|
Policy |
-0.00407*** (0.00133) |
0.00347** (0.00155) |
Lev |
0.0349*** (0.00339) |
-0.0160*** (0.00397) |
ROE |
0.00609*** (0.00142) |
0.00230 (0.00166) |
ATO |
0.0415*** (0.00162) |
-0.00605*** (0.00193) |
Top5 |
0.00207 (0.00509) |
-0.0407*** (0.00593) |
Dual |
-0.000332 (0.00113) |
-0.00125 (0.00132) |
Growth |
-9.09e-05 (9.46e-05) |
0.000117 (0.000110) |
Indep |
-0.0188** (0.00949) |
-0.0223** (0.0111) |
SOE |
-0.00207 (0.00263) |
-0.00586* (0.00307) |
Cashflow |
-0.101*** (0.00568) |
-0.0227*** (0.00668) |
Constant |
0.103*** (0.00520) |
0.0791*** (0.00613) |
Observations |
18573 |
18573 |
R-squared |
0.841 |
0.575 |
4.3.2 Heterogeneity Analysis
The size of the enterprise will affect the intensity of the role of network infrastructure construction in promoting the financialization of the enterprise. Based on this, this paper divides enterprises with annual revenue of less than 400 million yuan according to the definition of industrial small and medium-sized enterprises in the Law of the People's Republic of China on Promoting the Development of Small and Medium-sized Enterprises, and divides the rest into large enterprises. The regression is carried out by group, and from Table 7 (1) and (2), it can be seen that the Policy regression coefficient for the large enterprise group is significantly positive at the 5% level, but it is not significant for the small and medium-sized enterprise group. Therefore, the promotion of financialization of large manufacturing enterprises by network infrastructure construction is more obvious, confirming Hypothesis H3.
The degree of diversification of enterprises also affects the impact of network infrastructure construction on the financialization of enterprises. Drawing on Xiao Jianhua et al. (2020) study [26], this paper uses the Herfindahl-Hirschman Index (HHI) of the main business of each enterprise to measure it, the calculation formula is as follows:
\( HHI=\sum_{i=1}^{N}(Xi/X)^{2} \) (5)
Where, N is the total number of enterprises in the same market, Xi is the market share of the I-ranked enterprise, and X is the total market share. HHI index is the inverse indicator of enterprise diversification, the higher the value, the lower the degree of diversification, and vice versa. In this paper, the average HHI of the sample is used to classify the degree of diversification. Higher than the average is the low diversification group, and lower than the average is the high diversification group.
From columns (3) and (4) in Table 7, it can be seen that the Policy regression coefficient of the group with high diversification is significantly positive at the level of 10%, while that of the group with low diversification is not. Therefore, the role of network infrastructure construction in promoting financialization of diversified manufacturing enterprises is more obvious, which confirms the validity of hypothesis H4.
Table 7. Heterogeneity Test.
(1) |
(2) |
(3) |
(1) |
|
VARIABLES |
Big enterprise FINRATIO |
Small and medium-sized enterprise FINRATIO |
Low diversification FINRATIO |
High diversification FINRATIO |
Policy |
0.00340** (0.00155) |
-0.00877 (0.00800) |
0.00228 (0.00208) |
0.00495* (0.00257) |
Lev |
-0.0118*** (0.00405) |
-0.0717*** (0.0218) |
-0.0203*** (0.00557) |
-0.0163** (0.00657) |
ROE |
0.00191 (0.00187) |
0.00269 (0.00687) |
0.000571 (0.00228) |
0.00320 (0.00346) |
ATO |
-0.00867*** (0.00190) |
-0.0265 (0.0169) |
-0.0117*** (0.00273) |
-0.00433 (0.00297) |
Top5 |
-0.0349*** (0.00599) |
-0.0402 (0.0328) |
-0.0431*** (0.00821) |
-0.0200** (0.0100) |
Dual |
0.000192 (0.00133) |
-0.0115** (0.00574) |
-0.00496*** (0.00178) |
0.000491 (0.00208) |
Growth |
0.000104 (0.000104) |
0.00295 (0.00259) |
0.000158 (0.000124) |
-0.000100 (0.000260) |
Indep |
-0.00732 (0.0111) |
-0.152*** (0.0557) |
-0.0298** (0.0149) |
0.00274 (0.0176) |
SOE |
-0.00860*** (0.00305) |
0.0291* (0.0149) |
-0.00306 (0.00439) |
-0.00828* (0.00471) |
Cashflow |
-0.0144** (0.00671) |
-0.0161 (0.0285) |
-0.0199** (0.00867) |
0.00584 (0.0107) |
Constant |
0.0632*** (0.00614) |
0.148*** (0.0293) |
0.0818*** (0.00824) |
0.0506*** (0.00993) |
Observations |
16461 |
1897 |
12167 |
6171 |
R-squared |
0.578 |
0.668 |
0.578 |
0.663 |
5 Research Conclusions and Countermeasures
5.1 Research Conclusions
This paper studies the impact of optimizing network infrastructure on the financialization of manufacturing enterprises, taking the operating data of listed manufacturing enterprises from 2010 to 2020 as a sample, and researching the impact of the "Broadband China" policy on the financialization of manufacturing enterprises. The study finds that: (1) Optimizing network infrastructure will enhance the financialization level of manufacturing enterprises, which is achieved through optimizing credit asset management of receivables. Specifically, network infrastructure optimization helps manufacturing enterprises reduce their receivables ratio, and the surplus funds that result from the optimization can be invested by manufacturing enterprises in financial markets to obtain financial products with much higher returns than those in the real sector. (2) In the heterogeneity analysis of enterprise size, the financialization tendency of large manufacturing enterprises is particularly obvious. This is because large manufacturing enterprises have two underlying advantages in terms of policy support and technical level compared with small and medium-sized enterprises, and these underlying advantages help large manufacturing enterprises obtain relative profit and funding advantages over small and medium-sized enterprises. They can invest excess profits in financial activities. This shows that it is of great significance to fine-tune the "Broadband China" policy to take into account the concerns of different-sized enterprises and address real problems, and it is also an important direction for the future development of the policy. (3) In the heterogeneity analysis of diversified business enterprises at different levels, the financialization level of low-diversified manufacturing enterprises is not sensitive to the optimization of network infrastructure, while high-diversified manufacturing enterprises are more willing to hold more financial assets. This may be because, under the control of the same parent company, enterprises are less likely to be affected by moral hazard and adverse selection in financial activities, which means that the "Broadband China" policy also needs to further clarify how to deal with its differential impact on diversified business enterprises, especially under the trend that centrifugal diversification and excessive financialization will lead to the hollowing out of manufacturing enterprises.
5.2 Countermeasures
Based on the above research findings, this paper proposes the following policy recommendations:
First, during the implementation of "new infrastructure" and other supporting policies, special attention should be paid to the potential negative impacts, and efforts should be made to prevent the possible hollowing-out and excessive financialization of manufacturing enterprises during their information After the policy has taken shape, it should continue to solicit opinions and suggestions from various types of enterprises and continuously revise the draft policy. In the process of policy implementation, it should strive to make the policy as specific as possible, especially for policies that may have differential impacts, and try to achieve "one city one policy" and "one enterprise one policy". It should overcome the rigidity and inflexibility of policy implementation, and hold regular seminars to discuss the implementation of policies and the problems encountered by enterprises, so as to facilitate direct exchanges between enterprises and the government. The government can also designate a dedicated liaison officer for a specific enterprise, so that enterprises can find the government for help at any time when they encounter difficulties. In response to the specific problems of different enterprises, the government should take into account the real concerns of different enterprises and address their concerns, thereby fully stimulating the innovative vitality of enterprises. Third, financial institutions should develop suitable medium-low risk financial products based on the characteristics of manufacturing enterprises, expand the range of enterprise asset allocation options, and contribute financial power to the management of manufacturing surplus funds, thus demonstrating, in concrete actions, the concept of financial services for the real economy. For large manufacturing enterprises that need to hedge their risks through financial derivatives such as futures trading due to large-scale procurement, financial institutions should simplify the procedures for opening accounts and depositing and withdrawing margin money as much as possible. Financial institutions can set up special windows to provide one-stop services for enterprises and provide on-site services when needed. This will lower the threshold for financial services. In addition, financial institutions can regularly hold free lectures for manufacturing enterprises, focusing on the basic principles of hedging, low-to-medium-risk financial products suitable for manufacturing enterprises, and the principles of asset allocation. This will enable manufacturing enterprises to truly feel the convenience and benefits of finance. Fourth, government regulatory authorities can conduct unscheduled visits to manufacturing enterprises and question, guide, and hold talks with those that may engage in excessive financialization. For some key industries, regulatory authorities may also set certain red lines for manufacturing enterprises when necessary, and impose administrative penalties on those that violate the red lines, thus clearly conveying to enterprises the adverse consequences of excessive financialization. Meanwhile, the government needs to optimize the overall business environment in the market, protect the legitimate income of enterprises, and follow certain legal procedures and fully listen to opinions from all walks of life when formulating and abolishing policies. This can avoid arbitrary changes in policies and the introduction of policies that are strongly opposed by enterprises. Policies that are difficult to modify should be carefully revised before being introduced, and greater emphasis should be placed on long-term, stable support for the operation of real-economy enterprises. The government can provide guidance on the overall development goals of enterprises without interfering with their specific business operations, helping manufacturing enterprises better integrate into regional and national development strategies.
References
[1]. Perez, C. (2023). Technological revolution and financial capital: The dynamics of bubbles and golden age (pp. 79-88). Edward Elgar Publishing.
[2]. Cao, D., & Qin, M. (2009). Coupling between financial innovation and technological innovation - A discussion on the deep root cause of financial crisis. Journal of Finance and Economics, 2009(1), 8-14.
[3]. Zhang, X., He, Z., & Ren, Y. (2022). Research on technological innovation efficiency of industrial enterprises in China: Perspective of overall innovation and stage innovation. Science Decision-making, 2022(10), 1-19.
[4]. Li, Z., & Yang, T. (2015). The role of patent quality in company investment value and its influence mechanism. Journal of Management Studies, 12(8), 1230-1239.
[5]. Entezarkheirm, P. (2019). Patent ownership fragmentation and market value: An empirical analysis. International Journal of Innovation Management, 23(02), 213-229.
[6]. Gu, Z., & Ma, B. (2020). How does innovation failure affect the additional R&D investment of enterprises? Management Review, 32(9), 79-96.
[7]. Liao, W. W. (2017). A study on the correlations among environmental education, environment-friendly product development, and green innovation capability in an enterprise. Eurasia Journal of Mathematics, Science & Technology Education, 13(8), 5435-5444.
[8]. Sun, L., Miao, C., & Yang, L. (2017). Ecological-economic efficiency evaluation of green technology innovation in strategic emerging industries based on entropy weighted TOPSIS method. Ecological Indicators, 73(2), 554-558.
[9]. Tian, H., & Sun, Q. (2020). Research on the evaluation of green technological innovation capability of automobile manufacturing enterprises based on cloud model. Management Review, 32(2), 102-114.
[10]. Tang, X., Sun, Y., & Tang, X. (2021). Research on the evaluation of technological innovation ability in China’s high-end equipment manufacturing industry. Scientific Management Research, 42(9), 1-9.
[11]. Xue, C., Meng, Q., & He, X. (2020). Network infrastructure construction and corporate technological knowledge diffusion: A quasi-natural experiment from the "Broadband China" strategy. Journal of Financial Research, 46(4), 48-62.
[12]. Sun, Y., & Chen, S. (2021). Data assets and high-quality development of science and technology service enterprises - Based on the quasi-natural experiment of "Broadband China." Journal of Wuhan University (Philosophy and Social Sciences), 74(5), 132-147.
[13]. Zhao, T., Zhang, Z., & Liang, S. (2020). Digital economy, entrepreneurial vibrancy and high-quality development - Empirical evidence from Chinese cities. Management World, 36(10), 65-76.
[14]. Zhang, J., & Fu, K. (2021). Can information network infrastructure construction drive the improvement of urban innovation level? - Based on the quasi-natural experiment of the "Broadband China" strategy pilot. Journal of Industrial Economics, 2021(5), 1-14, 127.
[15]. Han, B., & Zhu, P. (2014). Empirical analysis of the impact of broadband on China’s economic growth. Journal of Statistical Research, 31(10), 49-54.
[16]. Niu, Z., & Cui, B. (2021). The impact of network infrastructure construction on air pollution control - Based on the quasi-natural experiment of the "Broadband China" strategy. Journal of Economics, 8(4), 153-180.
[17]. Chen, W., & Wu, Y. (2021). Digital economy development, digital divide and urban-rural resident income gap. Southern Economy, 2021(11), 1-17.
[18]. Acemoglu, D., & Restrepo, P. (2018). The race between man and machine: Implications of technology for growth, factor shares, and employment. American Economic Review, 108(6), 1488-1542.
[19]. Acemoglu, D. (2021). Harms of AI. NBER Working Paper.
[20]. Zhou, X., & Bao, Z. (2021). Does the digital economy exert squeezing effect on the real economy? Economic System Reform, 2021(5), 180-186.
[21]. Wang, J., Liu, D., & Fu, J. (2021). Discussion on the tax difficulties and solutions of data assets. Tax Research, 2021(11), 68-73.
[22]. Bai, P., & Yu, L. (2021). Digital economic development and firm markup: Theoretical mechanism and empirical evidence. China Industrial Economy, 2021(11), 59-77.
[23]. Xu, D., & Ma, J. (2018). Research on credit asset management of accounts receivable for enterprises. Macroeconomic Research, 2018(01), 129-145, 155.
[24]. Song, H., Li, C., & Gong, F. (2023). Tax system reform and manufacturing industry carbon emission reduction: A quasi-natural experiment from "VAT reform." Macroeconomic Research, 2023(07), 35-48.
[25]. Zhang, C., & Zhang, B. (2016). The puzzle of declining industrial investment rates in China: An economic financialization perspective. Economic Research, 51(12), 32-46.
[26]. Xiao, J., Shao, J., & Wang, R. (2020). Does the diversification strategy of research organization spin-off companies improve their performance? Evidence from listed companies in China. Science and Technology Management Research, 40(20), 117-122.
Cite this article
Ren,X.;Chen,C.;Nie,Q. (2024). Will Network Infrastructure Optimization Make Manufacturing Enterprises "Out of Real to Virtual"? --- A Quasi-Natural Experiment from the "Broadband China" Policy. Journal of Applied Economics and Policy Studies,9,84-96.
Data availability
The datasets used and/or analyzed during the current study will be available from the authors upon reasonable request.
Disclaimer/Publisher's Note
The statements, opinions and data contained in all publications are solely those of the individual author(s) and contributor(s) and not of EWA Publishing and/or the editor(s). EWA Publishing and/or the editor(s) disclaim responsibility for any injury to people or property resulting from any ideas, methods, instructions or products referred to in the content.
About volume
Journal:Journal of Applied Economics and Policy Studies
© 2024 by the author(s). Licensee EWA Publishing, Oxford, UK. This article is an open access article distributed under the terms and
conditions of the Creative Commons Attribution (CC BY) license. Authors who
publish this series agree to the following terms:
1. Authors retain copyright and grant the series right of first publication with the work simultaneously licensed under a Creative Commons
Attribution License that allows others to share the work with an acknowledgment of the work's authorship and initial publication in this
series.
2. Authors are able to enter into separate, additional contractual arrangements for the non-exclusive distribution of the series's published
version of the work (e.g., post it to an institutional repository or publish it in a book), with an acknowledgment of its initial
publication in this series.
3. Authors are permitted and encouraged to post their work online (e.g., in institutional repositories or on their website) prior to and
during the submission process, as it can lead to productive exchanges, as well as earlier and greater citation of published work (See
Open access policy for details).
References
[1]. Perez, C. (2023). Technological revolution and financial capital: The dynamics of bubbles and golden age (pp. 79-88). Edward Elgar Publishing.
[2]. Cao, D., & Qin, M. (2009). Coupling between financial innovation and technological innovation - A discussion on the deep root cause of financial crisis. Journal of Finance and Economics, 2009(1), 8-14.
[3]. Zhang, X., He, Z., & Ren, Y. (2022). Research on technological innovation efficiency of industrial enterprises in China: Perspective of overall innovation and stage innovation. Science Decision-making, 2022(10), 1-19.
[4]. Li, Z., & Yang, T. (2015). The role of patent quality in company investment value and its influence mechanism. Journal of Management Studies, 12(8), 1230-1239.
[5]. Entezarkheirm, P. (2019). Patent ownership fragmentation and market value: An empirical analysis. International Journal of Innovation Management, 23(02), 213-229.
[6]. Gu, Z., & Ma, B. (2020). How does innovation failure affect the additional R&D investment of enterprises? Management Review, 32(9), 79-96.
[7]. Liao, W. W. (2017). A study on the correlations among environmental education, environment-friendly product development, and green innovation capability in an enterprise. Eurasia Journal of Mathematics, Science & Technology Education, 13(8), 5435-5444.
[8]. Sun, L., Miao, C., & Yang, L. (2017). Ecological-economic efficiency evaluation of green technology innovation in strategic emerging industries based on entropy weighted TOPSIS method. Ecological Indicators, 73(2), 554-558.
[9]. Tian, H., & Sun, Q. (2020). Research on the evaluation of green technological innovation capability of automobile manufacturing enterprises based on cloud model. Management Review, 32(2), 102-114.
[10]. Tang, X., Sun, Y., & Tang, X. (2021). Research on the evaluation of technological innovation ability in China’s high-end equipment manufacturing industry. Scientific Management Research, 42(9), 1-9.
[11]. Xue, C., Meng, Q., & He, X. (2020). Network infrastructure construction and corporate technological knowledge diffusion: A quasi-natural experiment from the "Broadband China" strategy. Journal of Financial Research, 46(4), 48-62.
[12]. Sun, Y., & Chen, S. (2021). Data assets and high-quality development of science and technology service enterprises - Based on the quasi-natural experiment of "Broadband China." Journal of Wuhan University (Philosophy and Social Sciences), 74(5), 132-147.
[13]. Zhao, T., Zhang, Z., & Liang, S. (2020). Digital economy, entrepreneurial vibrancy and high-quality development - Empirical evidence from Chinese cities. Management World, 36(10), 65-76.
[14]. Zhang, J., & Fu, K. (2021). Can information network infrastructure construction drive the improvement of urban innovation level? - Based on the quasi-natural experiment of the "Broadband China" strategy pilot. Journal of Industrial Economics, 2021(5), 1-14, 127.
[15]. Han, B., & Zhu, P. (2014). Empirical analysis of the impact of broadband on China’s economic growth. Journal of Statistical Research, 31(10), 49-54.
[16]. Niu, Z., & Cui, B. (2021). The impact of network infrastructure construction on air pollution control - Based on the quasi-natural experiment of the "Broadband China" strategy. Journal of Economics, 8(4), 153-180.
[17]. Chen, W., & Wu, Y. (2021). Digital economy development, digital divide and urban-rural resident income gap. Southern Economy, 2021(11), 1-17.
[18]. Acemoglu, D., & Restrepo, P. (2018). The race between man and machine: Implications of technology for growth, factor shares, and employment. American Economic Review, 108(6), 1488-1542.
[19]. Acemoglu, D. (2021). Harms of AI. NBER Working Paper.
[20]. Zhou, X., & Bao, Z. (2021). Does the digital economy exert squeezing effect on the real economy? Economic System Reform, 2021(5), 180-186.
[21]. Wang, J., Liu, D., & Fu, J. (2021). Discussion on the tax difficulties and solutions of data assets. Tax Research, 2021(11), 68-73.
[22]. Bai, P., & Yu, L. (2021). Digital economic development and firm markup: Theoretical mechanism and empirical evidence. China Industrial Economy, 2021(11), 59-77.
[23]. Xu, D., & Ma, J. (2018). Research on credit asset management of accounts receivable for enterprises. Macroeconomic Research, 2018(01), 129-145, 155.
[24]. Song, H., Li, C., & Gong, F. (2023). Tax system reform and manufacturing industry carbon emission reduction: A quasi-natural experiment from "VAT reform." Macroeconomic Research, 2023(07), 35-48.
[25]. Zhang, C., & Zhang, B. (2016). The puzzle of declining industrial investment rates in China: An economic financialization perspective. Economic Research, 51(12), 32-46.
[26]. Xiao, J., Shao, J., & Wang, R. (2020). Does the diversification strategy of research organization spin-off companies improve their performance? Evidence from listed companies in China. Science and Technology Management Research, 40(20), 117-122.