


1 Introduction
Following the implementation of reform and opening up policies, China's economy has experienced rapid growth and achieved significant progress. Nevertheless, the prolonged use of a hasty development approach has resulted in the revelation of China's economic inefficiency and environmental pollution. Therefore, it is becoming more and more crucial to modify the model of economic development. and implement green economic development. China’s comprehensive development strategy greatly relies on the significant contribution of green development, and is an inevitable choice for overcoming limitations in resources and the environment, transforming the mode of development, and realizing sustainable development and high-quality development. In the context of achieving the maximum level of carbon emissions, achieving carbon neutrality, high energy consumption industries need to be transformed, lifestyle consumption needs to be optimized, emphasizing green development is now a necessary condition and a crucial foundation for achieving the goal of “dual carbon “and advancing high-caliber economic growth. One of the important tasks in promoting green economic development is to enhance the efficiency of comprehensive green production. Green total factor productivity involves the integration of energy and environmental considerations into the analysis of economic growth, thereby modifying traditional total factor productivity, and acts as the basis for evaluating whether a country or region has the potential to achieve long-lasting, sustainable progress. Currently, the focus of green total factor productivity research mainly involves examining the factors that influence green total factor productivity, but not much research has been done on its driving path and internal mechanism. In the context of digitization and greening development, how can green total factor productivity be increased so as to promote green economic development? and so on are urgent to be explored. Therefore, this study employs the fuzzy set qualitative comparative analysis (fsQCA) method and takes 30 provinces (cities, autonomous regions) in China as the research object, and considering technology, organization, and environment from three different angles, to explore the role paths of five factors, namely, the development of digital finance, the level of green innovation, the construction of the talent system, the government's support capacity, and the social financing environment, on the green total factor productivity, in order to identify strategies for advancing the eco-friendly growth of the economy using various approaches.
2 Review of Existing Literature and Conceptual Framework
2.1 Measurement of green total factor productivity
Measuring the integrated progress of resources, environment, and economy in a country or region, green total factor productivity is an essential measure that plays a critical role, and it represents the relationship between overall inputs and outputs from all production activities within a nation or specific area, considering all the contributing elements (such as capital, workforce, and resources) and all resulting factors (including economic productivity and emission of pollutants). Data envelopment analysis (DEA) is mostly used in the measurement of green total factor productivity. Farrell (1957) first introduced the concept of efficiency by dividing production efficiency into technical efficiency and allocative efficiency to measure the production frontier [1]. The method is widely used because it does not require parametric assumptions and simultaneously addressing the issue of numerous inputs and outputs can be achieved. While many research papers have focused on assessing green total factor productivity, there is no consensus in the existing literature on the use of DEA models. Zhang Hu and Gong Shuwen (2017) used the Malmquist index method of DEA modeling to measure green total factor productivity in Hubei Province [2]. Ge Pengfei (2017) measured carbon emissions as an undesirable outcome through the application of the Luenberger index utilizing the SBM-DDF approach [3]. Wu Lei (2020) measured it using DEA-GML index [4]. Jie Feng and Shiqiu Zhang (2017) measured green total factor productivity using different DEA models and found that the SBM model was more in line with the realistic meaning [5]. Therefore, this paper uses the DEA-SBM model that includes non-expected output to calculate green total factor productivity.
2.2 Individual Factors and Green Total Factor Productivity
According to the TOE research framework, this paper puts forward five influencing factors derived from technology, organization, and environmental aspects:
2.2.1 Digital Financial Development and Green Total Factor Productivity
The convergence of online technology and the financial sector has driven the progress of digital financial growth in recent times, with the aim of empowering finance with technology and making the financial system more inclusive through the use of digital technology, thus serving the real economy[6].Digital finance can bring about green and efficiency changes, reducing energy consumption and pollution while also improving resource allocation efficiency, resulting in an increase in the overall efficiency of environmentally friendly practices [7]. Utilizing digital finance can act as a channel to improve overall green productivity by leveraging technological advancements and local entrepreneurial initiatives [8]. Simultaneously, digital finance holds the promise of promoting sustainable growth through facilitating the digitalization of businesses and tackling energy inequality.[9]. Therefore, digital finance holds the promise of improving overall green productivity and facilitate the advancement of environmentally friendly economic growth through various means.
2.2.2 Green Innovation Level and Green Total Factor Productivity
The initial suggestion for green technology emerged from Rhodes and Wield, stating that green technology can reduce environmental pollution and minimize energy and raw material consumption [10]. Green technology innovation can reduce production costs, thus boosting the development of enterprises in the direction of green development [11]. Meanwhile, Chen Chaofan (2016) pointed out that the primary catalyst for industrial green development lies in technological advancement and innovation, aiming to improve the effectiveness of resource allocation and promote the concentrated and enduring utilization of resources [12]. Therefore, the advancement of green technology has a significant influence on overall green productivity.
2.2.3 Talent System Construction and Green Total Factor Productivity
The influence of human capital on the advancement of the economy is significant [13]. Talent has the potential to impact green total factor productivity by fostering innovation in green technology, as well as by stimulating spatial spillover effects that enhance green total factor productivity [14]. Simultaneously, the talent system, serving as a crucial vehicle for accumulating knowledge and fostering scientific and technological innovation, has the potential to influence overall green productivity by facilitating the introduction of external technology and internal technology accumulation [15].
2.2.4 Government Support Capacity and Green Total Factor Productivity
Government support can be embodied in four aspects, namely, resource-driven, information-driven, technology-driven and competition-driven, and here it is mainly embodied in resource-subsidy-driven, Incentives for environmentally friendly advancements can encourage the enhancement of overall green productivity [16]. State support can incentivize the advancement of scientific and technological research, leading to improved capabilities in addressing pollution, fostering innovation for sustainable production, minimizing environmental footprints, and boosting overall green productivity [17].
2.2.5 Social Financing Environment and Green Total Factor Productivity
The expansion of social funding on a large scale effectively drives the growth of the tangible economy [18], Enhanced financial development has the potential to notably drive the enhancement of overall factor productivity [19]. A better financing environment also means that there is abundant capital in society, so that encourages businesses to better promote green technological innovation. The progress of financial development may result in a rise in overall green productivity through the enhancement of efficiency and advancement of environmentally friendly technology [20].
2.3 A Research Framework for Green Total Factor Productivity from a Group Perspective
The aforementioned study of the correlation between personal factors and overall green productivity sets the groundwork for a more comprehensive comprehension of how digital finance advancement, talent system establishment, green innovation proficiency, government backing capability, and social funding environment influence total green productivity. However, the symmetric analysis method based on relevant theories cannot effectively deal with the synergistic effect of multiple factors' interdependence. Previous studies have been devoted to how factors such as digital finance affect green total factor productivity respectively [21-22], and these studies provide guidance for the selection of antecedent conditions in this paper. However, there are multiple synergies between digital financial development, talent system construction, green innovation level, government support capacity, and social financing environment. The group perspective provides feasible theories and methods to analyze such complex relationships, making the analysis more fine-grained. Using the TOE research framework as a basis, this paper outlines five distinct precursor conditions from the perspectives of technology, organization, and environment. According to the grouping perspective, the presence of these five antecedent conditions can result in varied combinations and give rise to various approaches for improving green total factor productivity in different categories of provinces. Thus, considering the grouping effect between different antecedent conditions helps to reveal the complex relationship between multiple factors and green total factor productivity [23]. Since China is in the transition and gear-shifting period of economic development, there are imbalances in the resource endowment and economic development level of different provinces, and one factor alone cannot sufficiently enhance the overall green total factor productivity across all provinces, so it is important to take into account the combined impact of various factors from diverse viewpoints, and to find effective paths to promote green development in different provinces according to local conditions.
In brief, both within the country and around the world, scholars have conducted thorough research on the factors influencing green total factor productivity. This includes elements such as technology, organization, and environment, which have been identified as essential components for analyzing the enhancement of green total factor productivity. Nevertheless, the variations in these elements across various provinces naturally result in diverse approaches to improving green total factor productivity. While academics acknowledge that the improvement of green total factor productivity is influenced by a range of factors, most of them use traditional statistical measurement methods to analyze the mechanism of these factors, empirically test the linear relationship and correlation between some of the factors and green total factor productivity, the group effect of the interaction and arrangement of factors on improving overall green productivity is not being thoroughly investigated, which makes it difficult to explain the differences in the paths of different provinces. Drawing on this, the present study utilizes fuzzy set qualitative comparative analysis (fsQCA), integrates five elements of digital financial development, green innovation level, talent system construction, government support capacity and social financing level from the perspectives of technology, organization and environment, and selects 30 provinces, autonomous regions, and municipalities directly under the central government of China as case studies, in an attempt to analyze the causal complexity of the elements in multiple dimensions, as well as the relationship between their different groupings and the enhancement of total factor productivity in green initiatives, and exploration of approaches to foster sustainable development across different geographical areas.
According to the analysis provided above, this paper adopts a group perspective and considers technology, organization, and environment simultaneously, selects the development of digital finance, the level of green innovation, the construction of the talent system, the government's support capacity and the level of social financing as the antecedent conditions, and at the same time, establishes the input indexes covering energy, capital, and labor with the desired and non-desired output indexes, and chooses the resulting green total factor productivity measured in this manner. A theoretical framework is developed to explore the combined impact of various precursor factors on overall green productivity from different angles, as shown in Figure 1.
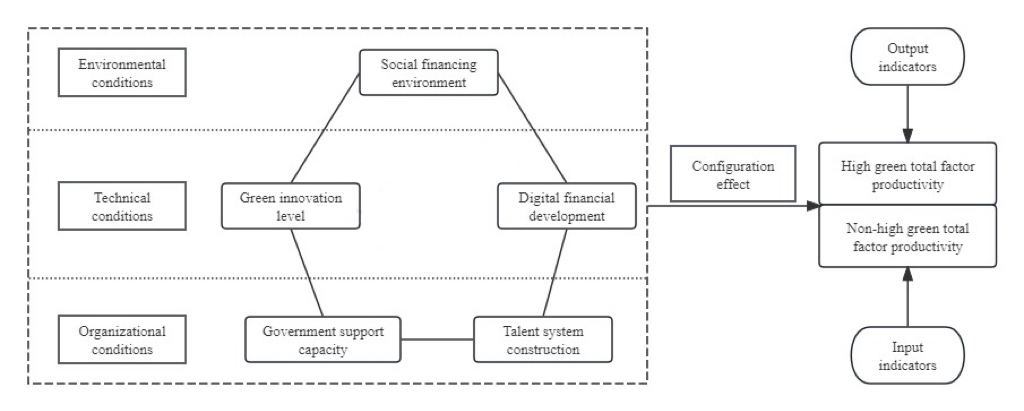
Figure 1. Theoretical framework
3 Research Design
3.1 Primary Methodology
3.1.1 QCA Method
Conventional analysis of correlation and regression emphasizes the overall impact, its basic assumption is that the antecedent circumstances are not interdependent, and there is a unidirectional linear relationship with the results [24], which cannot explain the complex causal relationship between the various factors affecting green total factor productivity. QCA, on the other hand, takes a comprehensive approach and performs comparative examination at the individual case level, considering each case as a "collection" of conditional variables. QCA analysis aims to focus on the synergistic effect of multiple factor combinations on the outcome through comparison between cases, and grouping analysis can better answer the asymmetric problem of causality. In traditional quantitative analyses, larger sample sizes are often required to achieve better statistical results. In this research, 30 provinces were included in the sample, which falls short of the extensive sample size typically employed in traditional quantitative research and significantly more than the optimal sample size of 2-10 recommended for qualitative research, while QCA is suitable for dealing with the intermediate situation where the sample size is too small for quantitative research but too large for qualitative research. Therefore, this research utilizes fuzzy set qualitative comparative analysis (fsQCA) as the method of analysis.
3.1.2 DEA Method
Considering that this study examines the influence of antecedent conditions such as digital finance on green development, this research employs green total factor productivity as a measure of sustainable development with an environmental focus., and adopts the SBM model in the DEA (Data Envelopment Analysis) methodology that incorporates unanticipated results in order to assess the overall environmental efficiency of the selected urban areas[5].Traditional DEA models are often based on radial theory, which fails to consider the fundamental issues of inefficiency, such as excessive inputs and inadequate outputs from decision-making units, resulting in an overestimation of the effectiveness of decision-making units, and the angular DEA models will also neglect one aspect of input or output elements, which will easily lead to inaccurate measurement results[24].In order to compensate for this shortcoming, Thorn (2001) proposed a relaxation measure DEA-SBM model considering non-angle and non-radial. In addition, since the economic and social development of cities has both “good” economic outputs and “bad” outputs such as pollutants, this paper introduces a DEA-SBM model that includes undesired outputs to calculate green total factor productivity.
3.2 Data Sources
The primary sources of research data in this paper are derived from the China Statistical Yearbook, China Energy Statistical Yearbook, China Environmental Statistical Yearbook, as well as statistical yearbooks of various provinces and cities. These sources can be classified into two mains aspects. First, the data used to calculate green total factor productivity between 2000 and 2020 is sourced from officially published national statistics, with some missing data filled in using interpolation. Second, in the antecedent conditions, the information regarding the advancement of digital finance is sourced from Peking University's Internet Finance Research Center; the information regarding green innovation levels is sourced from the China Research Data Service Platform (CNRDS); and the data on the construction of talent system, government subsidy capacity, and social financing environment come from the Statistical Yearbook. Considering the availability and completeness of the data, 30 provinces and autonomous regions in China (excluding Tibet, China, Hong Kong, Macao and Taiwan) are selected as the research samples in this paper.
3.3 Variable Measurement
3.3.1 Outcome Variable
This research utilizes green total factor productivity as a measure to evaluate the environmental sustainability of regional development in terms of input and output, and adopts the SBM model in the DEA methodology that includes non-desired outputs to measure the green total factor productivity of the sample provinces, constructing input indicators according to the three major categories of energy inputs, capital inputs and labor inputs, and constructing output indicators according to the two major categories of desired outputs and non-desired outputs. In terms of input indicators: first, energy input. Considering that the large-scale use of energy is the main cause of pollution, this study chooses total energy consumption as the energy input indicator. Second, capital inputs. In the production function, capital inputs are generally referred to as “physical capital inputs”, and the indicator “fixed capital stock” is almost always chosen as a proxy in the existing literature. At present, the perpetual inventory method proposed by Goldsmith in 1951 is the widely employed approach for assessing fixed capital stock. In this paper, we choose the depreciation rate estimated by Mr. Zhang Jun (2004) [25]and use 2000 as the base period for calculation. Third, labor input. Theoretically, the measurement of labor input should be the number of workers multiplied by the average labor time. However, due to the restricted access to data, almost all of the literature in China's empirical research only considers the number of workers, and similarly, this research also utilizes the total workforce in each region as a measure of labor contribution.
In terms of output indicators: First, desired output. Referring to the existing studies, the regional gross domestic product (GDP) of each province is used as the only desired output. Second, non-desired output. The main pollution problems that China is facing now are air pollution and water pollution. The four major pollutants, SO2, COD, ammonia nitrogen and nitrogen oxides, have become increasingly worrisome in relation to achieving objectives for conserving energy and reducing emissions. Therefore, the selection of non-expected outputs based on the above pollutants is significantly better than the selection based on the emissions of three wastes. Since the 11th Five-Year Plan, SO2 and COD have been the key pollutants to be controlled, therefore, SO2 and COD emissions are used as the indicators of non-desired outputs in this study.
3.3.2 Measurement of Antecedent Conditions
This research examines how five preceding factors collectively influence the overall efficiency of green productivity, namely, digital financial development, green innovation level, talent system construction, government support capacity and social financing environment, considering technology, organization, and environment, the five antecedent conditions are evaluated in the following manner:
Advancement in digital finance: This study utilizes the China Digital Inclusive Finance Index to illustrate the progress of digital financial services in China [8]. The index is collaboratively created by the Digital Finance Research Center at Peking University and Ant Financial Services Group, utilizing Ant Financial Services' extensive transaction account data. It encompasses three key aspects: breadth of coverage, depth of utilization, and digital support services. This index has been utilized for assessing and examining the progress of digital finance in China as well as its economic impact.
Green innovation level: Quantifying green technology innovation involves assessing the volume of green patent filings in each geographical area as reported by the CNRDS database [26]. The level of technical expertise required for green patent applications is relatively high, which has a higher requirement regarding the exploration and innovation, promotion and application of green technology in the region, more accurately demonstrating the strong capacity for innovative green practices at a high level, the time lag is eliminated by the ratio of green patent applications to the number of approvals.
Talent system building: Referring to the existing literature, the quantity of individuals registered in institutions of higher education in each region was used to measure the talent system building variables.
Government support capacity: With reference to existing studies, this study employs the ratio of government spending on environmental protection to overall public expenditure as a measure of the government's capacity for providing support.
Social financing environment: With reference to existing studies, this paper adopts the scale of social financing to measure the status of the social financing environment.
3.4 Variable Calibration
Prior to the necessity and sufficiency analysis, the data are calibrated and transformed into the concept of sets. The calibration of variables into sets is based on the setting of three thresholds: fully affiliated, fully unaffiliated, and crossover, based on theoretical and practical external knowledge or criteria. In this paper, the 5th percentile, median, and the 95th percentile of the statistical data is established as reference points for comprehensive independence, cross-affiliation, and complete affiliation, respectively. The pooled affiliation for each case after calibration was between 0 and 1 under Boolean logic [24]. The reference values for each variable's calibration are displayed below.
Table 1. Anchor points for each condition variable
Variant |
Calibration point |
|||
Completely unaffiliated |
Cross-affiliation |
Complete affiliation |
||
Conditional variable |
Digital financial development |
305.7587 |
337.7169 |
412.9265 |
Green innovation level |
1330.75 |
7437.5 |
42424.1 |
|
Talent system building |
74945.8 |
970645.5 |
2875235.65 |
|
Government support capacity |
0.2009 |
0.3165 |
0.6334 |
|
Social financing environment |
351.6 |
4791 |
21461.5 |
|
Outcome variable |
Green total factor productivity |
0.17387 |
0.292846 |
0.56596 |
4 Analysis of Results
4.1 Necessity Analysis
Before performing a group analysis, it is crucial to confirm whether each previous variable acts as an essential requirement. Necessary conditions are required for the outcome to occur, but their mere presence does not ensure the result. Consistency serves as a crucial standard for evaluating the essential prerequisites. When the consistency of a particular factor exceeds 0.9, it indicates that this factor is an indispensable prerequisite contributing to the final result. The table below displays the findings from the analysis of the essential conditions.
Table 2. Analysis of the necessity of single conditional variables
Antecedent variable |
High green total factor productivity |
Non-high green total factor productivity |
||
Consistency |
Coverage |
Consistency |
Coverage |
|
Digital financial development |
0.834534 |
0.928244 |
0.424525 |
0.500000 |
~Digital financial development |
0.550477 |
0.474615 |
0.939076 |
0.857337 |
Green innovation level |
0.742571 |
0.878247 |
0.418692 |
0.524351 |
~Green innovation level |
0.597831 |
0.492704 |
0.902781 |
0.787839 |
Talent system building |
0.726855 |
0.712719 |
0.577419 |
0.599529 |
~Talent system building |
0.591586 |
0.569353 |
0.723313 |
0.737120 |
Government support capacity |
0.634823 |
0.629680 |
0.679889 |
0.714091 |
~Government support capacity |
0.711756 |
0.677400 |
0.647417 |
0.652449 |
Social financing environment |
0.792739 |
0.878269 |
0.455052 |
0.533835 |
~Social financing environment |
0.579233 |
0.500950 |
0.896235 |
0.820750 |
Based on the analysis results of the essential factors for non-high green total factor productivity in the table, it is observed that, apart from the level of non-high green innovation, the consistency of these factors is below 0.9, indicating that non-high green innovation level might be a crucial factor in explaining non-high green total factor productivity. Nevertheless, after conducting additional testing and analysis, it has been determined that this condition does not serve as an essential factor in explaining non-high green total factor productivity. This illustrates the complex process of advancing green total factor productivity and fostering sustainable urban development. It involves connecting and aligning technological, organizational, and environmental elements that collectively influence green total factor productivity.
4.2 Configuration Analysis
According to the existing literature, the initial and PRI consistency thresholds were set at 0.8, with a case frequency threshold of 1. When analyzing the effective groupings that led to the results, three categories of resolutions were produced, specifically the uncomplicated resolution, the middle-level resolution, and the intricate resolution. In this paper, we refer to Fiss's study and use the intermediate solution as the main reference, and through nested comparisons of the intermediate and simple solutions, elements present in both the basic and intermediate solutions are acknowledged as fundamental conditions, while those found exclusively in the intermediate solution are categorized as secondary conditions. The figure below displays the outcomes of the provincial grouping aimed at enhancing overall green total factor productivity.
Table 3. Results of group analysis of condition variables
High green total factor productivity |
|||||
Antecedent variable |
S1 |
S2 |
S3 |
S4 |
S5 |
Digital financial development |
● |
● |
● |
● |
|
Green innovation level |
● |
● |
● |
● |
|
Talent system building |
● |
● |
● |
● |
|
Government support capacity |
⊗ |
⊗ |
● |
● |
|
Social financing environment |
● |
● |
● |
⊗ |
|
Consistency |
0.962 |
0.98 |
0.945 |
0.988 |
0.979 |
Raw coverage |
0.662 |
0.34 |
0.502 |
0.399 |
0.317 |
Unique coverage |
0.062 |
0.017 |
0.029 |
0.017 |
0.035 |
Overall solution consistency |
0.785 |
||||
Overall solution coverage |
0.939 |
||||
According to the above table, in general, the overall solution consistency of the intermediate solution of high green total factor productivity is 0.785, and the overall solution coverage is 0.939. In terms of individual groupings, the three groupings have a consistency range of 0.945-0.988, and the raw coverage range of 0.317-0.662, which is in line with the criteria of fsQCA analysis. Among the 5 groupings, grouping S4 has the highest consistency and grouping S1 has the highest original coverage. In order to better compare the differences between the 5 groupings, they are named according to the differences in the antecedent conditions included in the paths, which are analyzed as follows.
Technology-finance driven. Configuration S1 points out that the economic development model with high digital financial development, high level of green innovation and high social financing environment as the core conditions can produce high green total factor productivity. This path includes both technology-led digital finance and green innovation, as well as capital-led social financing environment, so the path is named technology-funding-driven. The consistency of this grouping is 0.962, the unique coverage is 0.062, and the raw coverage is 0.662, this grouping explains about 66.2% of the cases with high green total factor productivity. This grouping shows that under a high level of green innovation and a high social financing environment, the rapid development of digital finance can also lead to high green total factor productivity, regardless of the availability of talent support and government support. In provinces with well-developed digital finance, this can be used to improve the social financing environment, so that enterprises can receive more financial support, this can enhance their capacity for green development through engaging in scientific and technological innovation activities, leading to a subsequent rise in overall green factor productivity. Typical provinces of this type include Beijing, Zhejiang, Jiangsu and Shanghai. Take Zhejiang, for example, in 2021, the province achieved a digital economy added value of 3.57 trillion yuan, placing it fourth in the nation and doubling that of the “13th Five-Year Plan” at its inception. And as of the end of 2021, the province has built and opened 105,000 5G base stations, the first to achieve full coverage of counties, townships and administrative villages basic coverage, the cumulative completion of all kinds of data centers 202, of which the number of large-scale data centers and more than 20 number of the scale of the country's forefront. Zhejiang Province has a better digital environment, so it can provide a good platform for the development of digital finance. Zhejiang Province has implemented the green economy cultivation action, and the ratio of the increase in value derived from high-tech industry in the industry above the scale has increased from 40.1% to 59.6% in five years, and the green innovation ability has been gradually improved. The case of Zhejiang Province reflects the typical feature of digital finance, green innovation and social financing jointly Facilitating the enhancement of overall eco-friendly productivity.
Technology-Talent Driven. Group S2 points out that the economic development model with high digital financial development, high level of green innovation, non-high government support capacity as the core condition, and high talent system construction as the marginal condition can improve green total factor productivity. This path contains technology-led digital finance as well as green innovation, and also talent-led talent system construction, so the path is named technology-talent-driven. The consistency of this grouping is 0.98, the unique coverage is 0.17, and the raw coverage is 0.34, which means that this grouping can explain about 34% of the high green total factor productivity cases. This categorization implies a strong level of advancement in digital financial services, high levels of green innovation and high talent system building can generate high green total factor productivity even without government support. From this type of pathway, it can be seen that in an economic environment with inadequate government support, digital finance as well as green innovation activities are driven by talents, which ultimately increase green total factor productivity. The province that is a part of this category is: Guangdong Province. Guangdong Province ranks at the forefront of fintech enterprise development in the country, and Guangdong's digital finance leaders, represented by Tencent, Ping An Technology and GDT, have a clear advantage. In the 2019 Global Financial Centers Index, Guangzhou's fintech ranked 4th in the world. Meanwhile, Guangzhou has been granted the first approval in China to establish a cutting-edge demonstration zone for blockchain development, with the establishment of the first local organization for digital finance in the country, the Guangzhou Digital Finance Association; Shenzhen, as an important fintech innovation center in China, has a complete fintech ecosystem. Since 2008, Guangdong Province's annual index of green technology innovation has improved significantly, with a compound growth rate of 14.6% in 2021, and a strong capacity for green innovation. By 2022, the total number of professional and technical talents and skilled personnel in Guangdong province will reach more than 21 million, ranking among the top in the country. The team of R&D personnel has grown to 1.1 million people, and the province's high-tech enterprises and the amount of effective invention patents have ranked first in the country, which has strongly supported the regional innovation capacity to rank first in the country for four consecutive years. From the above data, Guangdong Province is at the forefront of the country in terms of both digital financial development, talent system construction and green innovation capacity, by doing so, it will offer increased backing for the eco-friendly expansion of the economy and enhance the area's overall ecological efficiency.
Technology-resource driven. Configuration S3 points out that the economic development model with high level of green innovation, high social financing environment and non-high government support capacity as the core conditions and high talent system construction as the marginal conditions can improve green total factor productivity and enhance the promotion of eco-friendly economic growth. This path contains technology-led green innovation, and also contains two kinds of resources, talent and capital, so it is named technology-resource-driven. The consistency of this grouping is 0.945, the unique coverage is 0.029, and the raw coverage is 0.502, which means that this grouping is able to explain about 50.2% of the high green total factor productivity cases. This grouping suggests that with a strong level of green innovation, a good social financing environment and a well-developed talent system, enhancing green total factor productivity and promoting the greening of the economy can be achieved independently of government assistance. Talents are able to promote the enhancement of green innovation capacity, with the added support of finance, thus enhancing the green total factor productivity. The provinces belonging to this grouping are: Shandong Province. According to statistics, the added value of the “four new” (new technologies, new industries, new business forms and new modes) economy of Shandong Province has increased by 10 percentage points in four years to reach 31.7% of regional GDP in 2021. At present, Shandong has approved the construction of 21 provincial key laboratories in the direction of resource environment and ecological restoration, and 5 provincial technological innovation centers. Shandong Province has a good social financing environment and relatively rich financial resources, with a large number of regional banks, mainly small and medium-sized city commercial banks and agricultural commercial banks. As of the end of June 2022, Shandong Province's deposit balance was 140,659 billion yuan, ranking among the largest in the nation in terms of sheer magnitude, with a deposit-to-loan ratio of 81.3%, and the number of local banks and their registered capital ranking second in the country. Shandong Province's green innovation capacity and social financing environment are among the highest in the country. Motivated by both factors and talent, they have collectively enhanced the overall green productivity and advanced the eco-friendly economic growth of the region.
Technology-environment driven. Configuration S4 points out that the economic development model with high digital financial development and high social financing environment as the core conditions, and enhancing the overall factor productivity and promoting the sustainable development of regional economy can be achieved by establishing a robust talent system and strengthening government support for green initiatives. This path contains technology-led digital finance, and factors about environmental aspects, talent system construction, government support capacity and social financing environment, so this path is named technology-environment driven. The consistency of this grouping is 0.988, the unique coverage is 0.017, and the raw coverage is 0.399, i.e., this grouping can explain about 39.9% of the cases of high green total factor productivity. In this path, a digital financial and financing environment is dominant, supported by talent and government support, and is able to demonstrate high green total factor productivity. In other words, in an economic model with a high digital finance and financing environment, the green development of the economy can be promoted regardless of the degree of green innovation capacity. The province belonging to this grouping is: Anhui Province. The electronic information industry in Anhui Province has been growing, and in 2020, the value added of the province's electronic information-regulated industry realized an increase of 24.1%, and the operating income increased by 25.2% year-on-year, which is higher than that of the same industry in the country by 16.3 percentage points. Since 2015, a total of 25 projects in Anhui Province have been supported by the National Intelligent Manufacturing Comprehensive Standardization and New Mode Application Project, and 18 national intelligent manufacturing pilot demonstration projects have been pursued. In 2017-2020, a total of 98 provincial-level intelligent factories and 472 digital workshops have been identified in Anhui province. From the above data, it can be seen that Anhui province has a good digital environment, so the development of digital finance is better. In 2020, the social financing scale in Anhui province reached 925.12 billion yuan, marking a significant increase of 300.8% compared to the figures from 2015.At the end of 2020, the province has a total of 126 listed companies in the territory of the province, ranked first in central China; in the foreseeable future, the growth rates of loans for the province's manufacturing industry and inclusive small and micro-enterprises were 32.71% and 24.25%, individually, each of them is considerably above the mean increase in loan rates, and the cost of enterprise financing has steadily declined. Anhui Province has a better foundation for digital financial development and a social financing environment, in this way, by leveraging the expertise of skilled individuals and receiving backing from governmental entities, a substantial increase in environmentally friendly total factor productivity can be achieved.
Technology-government driven. The grouping S5 indicates that the economic development model with high digital financial development and high level of green innovation as the core conditions, and high talent system construction and high government support capacity as the marginal conditions can increase green total factor productivity. The consistency of this path is 0.979, the unique coverage is 0.035, and the raw coverage is 0.317, which means that this grouping can explain about 31.7% of the cases of high green total factor productivity. In this path, the two core conditions are technology-led digital finance and green innovation, with talent and government support playing a supporting role. A strong talent system promotes technological innovation, which in turn drives the greening of the economy. The case belonging to this configuration is: Hainan Province. In terms of green development, Hainan Province, relying on its geographical advantages, can better develop new energy sources, so there are Dongfang Daguangba hydropower, Qionghai Niululing hydropower, Danzhou Eman wind power, Changjiang Tianlicho solar power generation and so on. In the construction of talents, Hainan Province, the number of talents introduced in the year-on-year increase, and the high-end talent has the corresponding policy subsidies. Simultaneously, a range of policy actions have been implemented to encourage eco-friendly innovation and bolster the sustainable growth of the economy.
4.3 Potential Substitution Relationships between Conditions
By examining the resemblances and variances among the condition categories S1-S5, we can
more accurately pinpoint the potential interchangeability of technology, organization, and environmental circumstances. The comparison of group states 1 and 3 shows that for the provinces with high level of green innovation and good social financing environment, the construction of talent system and the level of digital financial development can be substituted for each other, as shown in the figure. Comparison of condition group state 1 and 4 found that for provinces with high level of digital financial development and good social financing environment, the level of green innovation can play a role instead of the talent system construction and government support capacity to encourage the sustainable growth of urban areas with a focus on environmental conservation, as shown in Fig. Comparison of group state 2 and 3 found that in provinces with better talent system construction and strong green innovation level, digital finance development level and social financing environment can substitute each other, as shown in Fig. Comparison of group state 2 and 4 found that in provinces with high digital financial development and better talent system construction, the level of green innovation can play a role instead of government support capacity and social financing environment, as shown in Fig 2.
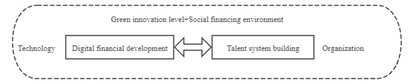
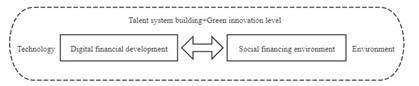
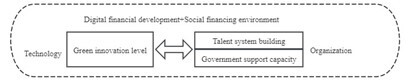
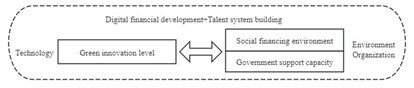
Figure 2. Path diagram of substitution effect
In the analysis of the substitution effect, it was discovered that the advancement of digital finance on a technological level and the extent of green innovation had a greater impact. This is because digital finance provides financing channels and financial instruments for green development. Through the digital finance platform, users can directly invest or lend to environmental enterprises. Green innovation and digital finance are mutually reinforcing and jointly promote sustainable development. The ongoing advancement in digital financial technology, including the utilization of blockchain, cloud computing and artificial intelligence, provides new opportunities and solutions for green innovation. For example, decentralization and transparency of energy transactions can be achieved through blockchain technology, promoting the application and development of renewable energy.
4.4 Robustness Check
In this paper, the robustness of the grouping that produces high green total factor productivity is tested.QCA is an approach that draws on the principles of ensemble theory, which is deemed to be resilient in cases where minor adjustments in the process that generates a subset of connections between outcomes do not alter the fundamental interpretation of the research results [24]. Therefore, in this paper, the PRI consistency is reduced from 0.7 to 0.65, and the resulting grouping is consistent with the original grouping. Therefore, the robustness assessment conducted previously suggests that the results presented in this paper demonstrate a considerable degree of durability.
5 Conclusion and Discussion
5.1 Conclusion
In this era of frequent ecological problems, the importance of green development has become increasingly prominent. In the process of driving green development, technology, organization and environment all play an important role, and how to coordinate the relationship between the three and promote the synergistic effect of the combination of multiple factors is highly important to enhance the overall efficiency of green resources utilization. Starting from the TOE theory and combining the DEA and QCA methods, this study not only assesses the green total factor productivity of the provinces in China, but also examines the combined impact of various antecedent conditions on green total factor productivity, and obtains the following conclusions: firstly, using the QCA method, this study has found that a single antecedent condition can not constitute a necessary condition for high green total factor productivity, so the 3 dimensions of the five variables in the three dimensions were grouped and analyzed, and it was found that all five groupings that produced high green total factor productivity constituted sufficient conditions for the outcome variable. Second, this study found five combinations of factors that promote high green total factor productivity, namely, “technology-financing-driven”, “technology-talent-driven”, “technology-resource-driven”, “technology-environment-driven”, and “technology-government-driven”. “Technology-environment-driven” “Technology-government-driven”. These five different combinations of antecedent conditions reflect the multiple ways in which different provinces in China can promote green development when they have different technologies, organizations and environments. Thirdly, by comparing the five paths derived from this paper, it can be found that the level of digital financial development and green innovation at the technological level plays a very important role. To improve the overall green productivity of China and advance the cause of environmentally friendly development, we should focus on improving China's technological level, vigorously developing digital finance and carrying out green innovation. It can also be found that the influence of government support capacity and talent system construction on high green total factor productivity is mainly auxiliary, and exists mostly in the form of marginal conditions in the path.
5.2 Theoretical Contribution
First, from a comprehensive perspective, we investigate the various simultaneous elements that improve China's overall green productivity and support sustainable development. Existing studies often rely on conventional statistical approaches to examine the collective influence of various elements in assessing the drivers of overall green productivity. Improving the progress of eco-friendly economic development and boosting green overall productivity is a component of a complex framework, where the influencing factors are interconnected and there exist numerous simultaneous causal relationships, making traditional statistical measurement methods unsuitable. The fsQCA approach is effective in uncovering the simultaneous and interconnected mechanisms of multiple factors influencing outcome variables. Consequently, this research employs the QCA approach to investigate how technology, organizational factors, and environmental engagements influence green total factor productivity. This analysis aims to identify strategies for enhancing green total factor productivity and advancing sustainable economic development, addressing existing research limitations.
Secondly, it uncovers the equal importance of antecedent conditions within intricate causal relationships and identifies various routes to enhance green total factor productivity in China. Due to China's vast geographical expanse, factors like the progress of the economy and the allocation of resources and technological advancement vary across regions. As a result, each province exhibits distinct paths for enhancing green total factor productivity. Conventional measurement techniques are limited to identifying only the single best solution in a state of balance, and they cannot differentiate the importance of factors within a collective framework. In this paper, the QCA method not only clarifies multiple paths to promote green economic development, but also identifies the core and marginal conditions affecting green total factor productivity enhancement, which helps provinces to promote green economic development in their regions according to the actual situation and the local conditions.
5.3 Policy Implications
First, boosting funding for scientific and technological advancements to drive the progress of digital finance and the enhancement of eco-friendly innovation technology, while establishing a conducive social financing atmosphere. Regions should prioritize boosting funding for research and development in order to offer the essential financial backing for digital finance and environmentally friendly technological advancement, and at the same time reward enterprises that contribute to promoting technological innovation, thereby mobilizing their motivation. Formulate a development plan for digital finance, with clear development goals, policy measures and regulatory mechanisms, to provide a basic framework and guidelines for promoting digital finance. At the same time, increase investment in and support for digital financial infrastructure to improve the stability and security of digital finance.
Secondly, the training of scientific and technological talents should be strengthened and the social financing environment should be improved. The government ought to enhance the development and recruitment of scientific and technological experts, provide them with better training and development opportunities, and provide them with talent support for the development of digital finance and green innovation technology. Simultaneously, it should improve the social financing environment, simplify the financing process, minimize the expenses associated with funding, improve the efficiency of financing, and attract more capital to flow into the real economy and innovation.
Thirdly, support for green innovative technologies should be increased and financial institutions should be guided to place greater emphasis on green finance and social responsibility. The government has the ability to incentivize businesses to participate in the exploration, development, and implementation of environmentally friendly technologies by offering tax benefits, subsidies and loans. Encouraging financial institutions to focus on promoting sustainable development and incentivizing them to provide eco-friendly products such as environmentally conscious credit, sustainable bonds, and green investment funds is crucial. This, in turn, will help promote the progress of a viable economy.
References
[1]. Farrell, M. J. (1957). The measurement of productive efficiency. Journal of the Royal Statistical Society: Series A (General), (1).
[2]. Zhang, H., & Gong, S. (2017). Measurement and analysis of industrial green total factor productivity based on DEA-Malmquist: Taking Hubei Province as an example. Journal of Jiangxi Normal University (Natural Science Edition), (5).
[3]. Ge, P., Xu, Z., & Huang, X. (2017). Has scientific research and innovation improved the green total factor productivity of countries along the “Belt and Road”? International Trade Issues, (9).
[4]. Wu, L., Jia, X., & Wu, C. (2020). Impact of heterogeneous environmental regulation on green total factor productivity in China. China Population-Resources and Environment, (10).
[5]. Feng, J., & Zhang, S. Q. (2017). China's interprovincial green total factor productivity assessment based on DEA method: An exploration of the variability of different model choices. Journal of Peking University (Natural Science Edition), (1).
[6]. Qian, H., Tao, Y., & Cao, S. (2020). Theoretical and empirical evidence on digital financial development and economic growth in China. Research on Quantitative and Technical Economics, (6).
[7]. Zhang, R., & Yu, J. (2021). Digital finance, business environment, and economic growth. Modern Economic Discussion, (7).
[8]. Fan, X., & Yin, Q. S. (2021). Does digital finance enhance green total factor productivity? Journal of Shanxi University (Philosophy and Social Science Edition), (4).
[9]. Asif, R., & Yang, X. (2023). Digital finance and green growth in China: Appraising inclusive digital finance using web crawler technology and big data. Technological Forecasting and Social Change, (3).
[10]. Rhodes, E., & Wield, D. (1994). Implementing new technologies: Innovation and the management of technology. New Jersey: Wiley Blackwell.
[11]. Xie, X., Huo, J., & Wang, H. (2019). Research on the relationship between green process innovation and financial performance of manufacturing industry. Research Management, (3).
[12]. Chen, C. (2016). China's industrial green total factor productivity and its influencing factors: An empirical study based on ML productivity index and dynamic panel model. Statistical Research, (3).
[13]. Jones, L. E., & Manuelli, R. E. (1990). A convex model of equilibrium growth: Theory and policy implications. Journal of Political Economy, (5).
[14]. Zhang, M., & Hu, Y. (2020). The impact of innovative human capital on green total factor productivity in the Yangtze River Delta region: An empirical analysis based on the spatial Durbin model. China Population-Resources and Environment, (9).
[15]. Zhao, L., Zhang, L., & Xu, L. (2016). Role mechanism of human capital, industrial restructuring, and green development efficiency. China Population-Resources and Environment, (11).
[16]. Xiong, A., Ding, Y., & Hu, Y. (2020). Impact of green innovation subsidies on total factor productivity under low carbon threshold. Resource Science, (11).
[17]. Li, B., Qi, Y., & Li, Q. (2016). Fiscal decentralization, FDI, and green total factor productivity: An empirical test based on panel data dynamic GMM method. International Trade Issues, (7).
[18]. Guo, L. H., Zhang, X. J., & Xu, L. B. (2014). Research on the impact of social financing scale and financing structure on the real economy. International Financial Studies, (6).
[19]. Li, J., & Wei, P. (2015). Financial development and total factor productivity growth: An empirical analysis based on Chinese interprovincial panel data. Economic Theory and Economic Management, (8).
[20]. Xu, Z., & Zhu, R. (2020). Analysis of the impact of financial development on green total factor productivity: An empirical study from western China. Journal of Shanxi University (Philosophy and Social Science Edition), (1).
[21]. Wang, Q. (2023). Digital economy development and green total factor productivity in urban agglomerations: Mechanism of action and inclusive nature. China Circulation Economy, (6).
[22]. Hu, R., Tang, J., & Song, H. (2023). Environmental regulation, green technology innovation, and green total factor productivity in manufacturing industry. Industrial Technology and Economics, (7).
[23]. Jia, J., Liu, W., & Du, Y. (2023). Multiple paths to enhance the efficiency of green technology innovation under the perspective of institutional grouping. Nankai Management Review, (9).
[24]. Du, Y., & Jia, L. (2017). Group perspective and qualitative comparative analysis (QCA): A new path for management research. Management World, (6).
[25]. Zhang, J., Wu, G., & Zhang, J. (2004). Estimation of inter-provincial physical capital stock in China: 1952-2000. Economic Research, (10).
[26]. Xiao, J., Zeng, P., & Ren, G. (2022). How to enhance the performance of green transformation in manufacturing industry? A group study based on TOE framework. Science Research, (12).
[27]. Gao, X., He, Z., & Zhang, F. (2022). How do government subsidies and environmental regulations enhance regional green technology innovation level? A study of linkage effect based on grouping perspective. Research and Development Management, (3).
Cite this article
Ma,X. (2024). Research on Multiple Enhancement Paths of Green Total Factor Productivity--Group analysis based on the TOE framework. Journal of Applied Economics and Policy Studies,10,15-26.
Data availability
The datasets used and/or analyzed during the current study will be available from the authors upon reasonable request.
Disclaimer/Publisher's Note
The statements, opinions and data contained in all publications are solely those of the individual author(s) and contributor(s) and not of EWA Publishing and/or the editor(s). EWA Publishing and/or the editor(s) disclaim responsibility for any injury to people or property resulting from any ideas, methods, instructions or products referred to in the content.
About volume
Journal:Journal of Applied Economics and Policy Studies
© 2024 by the author(s). Licensee EWA Publishing, Oxford, UK. This article is an open access article distributed under the terms and
conditions of the Creative Commons Attribution (CC BY) license. Authors who
publish this series agree to the following terms:
1. Authors retain copyright and grant the series right of first publication with the work simultaneously licensed under a Creative Commons
Attribution License that allows others to share the work with an acknowledgment of the work's authorship and initial publication in this
series.
2. Authors are able to enter into separate, additional contractual arrangements for the non-exclusive distribution of the series's published
version of the work (e.g., post it to an institutional repository or publish it in a book), with an acknowledgment of its initial
publication in this series.
3. Authors are permitted and encouraged to post their work online (e.g., in institutional repositories or on their website) prior to and
during the submission process, as it can lead to productive exchanges, as well as earlier and greater citation of published work (See
Open access policy for details).
References
[1]. Farrell, M. J. (1957). The measurement of productive efficiency. Journal of the Royal Statistical Society: Series A (General), (1).
[2]. Zhang, H., & Gong, S. (2017). Measurement and analysis of industrial green total factor productivity based on DEA-Malmquist: Taking Hubei Province as an example. Journal of Jiangxi Normal University (Natural Science Edition), (5).
[3]. Ge, P., Xu, Z., & Huang, X. (2017). Has scientific research and innovation improved the green total factor productivity of countries along the “Belt and Road”? International Trade Issues, (9).
[4]. Wu, L., Jia, X., & Wu, C. (2020). Impact of heterogeneous environmental regulation on green total factor productivity in China. China Population-Resources and Environment, (10).
[5]. Feng, J., & Zhang, S. Q. (2017). China's interprovincial green total factor productivity assessment based on DEA method: An exploration of the variability of different model choices. Journal of Peking University (Natural Science Edition), (1).
[6]. Qian, H., Tao, Y., & Cao, S. (2020). Theoretical and empirical evidence on digital financial development and economic growth in China. Research on Quantitative and Technical Economics, (6).
[7]. Zhang, R., & Yu, J. (2021). Digital finance, business environment, and economic growth. Modern Economic Discussion, (7).
[8]. Fan, X., & Yin, Q. S. (2021). Does digital finance enhance green total factor productivity? Journal of Shanxi University (Philosophy and Social Science Edition), (4).
[9]. Asif, R., & Yang, X. (2023). Digital finance and green growth in China: Appraising inclusive digital finance using web crawler technology and big data. Technological Forecasting and Social Change, (3).
[10]. Rhodes, E., & Wield, D. (1994). Implementing new technologies: Innovation and the management of technology. New Jersey: Wiley Blackwell.
[11]. Xie, X., Huo, J., & Wang, H. (2019). Research on the relationship between green process innovation and financial performance of manufacturing industry. Research Management, (3).
[12]. Chen, C. (2016). China's industrial green total factor productivity and its influencing factors: An empirical study based on ML productivity index and dynamic panel model. Statistical Research, (3).
[13]. Jones, L. E., & Manuelli, R. E. (1990). A convex model of equilibrium growth: Theory and policy implications. Journal of Political Economy, (5).
[14]. Zhang, M., & Hu, Y. (2020). The impact of innovative human capital on green total factor productivity in the Yangtze River Delta region: An empirical analysis based on the spatial Durbin model. China Population-Resources and Environment, (9).
[15]. Zhao, L., Zhang, L., & Xu, L. (2016). Role mechanism of human capital, industrial restructuring, and green development efficiency. China Population-Resources and Environment, (11).
[16]. Xiong, A., Ding, Y., & Hu, Y. (2020). Impact of green innovation subsidies on total factor productivity under low carbon threshold. Resource Science, (11).
[17]. Li, B., Qi, Y., & Li, Q. (2016). Fiscal decentralization, FDI, and green total factor productivity: An empirical test based on panel data dynamic GMM method. International Trade Issues, (7).
[18]. Guo, L. H., Zhang, X. J., & Xu, L. B. (2014). Research on the impact of social financing scale and financing structure on the real economy. International Financial Studies, (6).
[19]. Li, J., & Wei, P. (2015). Financial development and total factor productivity growth: An empirical analysis based on Chinese interprovincial panel data. Economic Theory and Economic Management, (8).
[20]. Xu, Z., & Zhu, R. (2020). Analysis of the impact of financial development on green total factor productivity: An empirical study from western China. Journal of Shanxi University (Philosophy and Social Science Edition), (1).
[21]. Wang, Q. (2023). Digital economy development and green total factor productivity in urban agglomerations: Mechanism of action and inclusive nature. China Circulation Economy, (6).
[22]. Hu, R., Tang, J., & Song, H. (2023). Environmental regulation, green technology innovation, and green total factor productivity in manufacturing industry. Industrial Technology and Economics, (7).
[23]. Jia, J., Liu, W., & Du, Y. (2023). Multiple paths to enhance the efficiency of green technology innovation under the perspective of institutional grouping. Nankai Management Review, (9).
[24]. Du, Y., & Jia, L. (2017). Group perspective and qualitative comparative analysis (QCA): A new path for management research. Management World, (6).
[25]. Zhang, J., Wu, G., & Zhang, J. (2004). Estimation of inter-provincial physical capital stock in China: 1952-2000. Economic Research, (10).
[26]. Xiao, J., Zeng, P., & Ren, G. (2022). How to enhance the performance of green transformation in manufacturing industry? A group study based on TOE framework. Science Research, (12).
[27]. Gao, X., He, Z., & Zhang, F. (2022). How do government subsidies and environmental regulations enhance regional green technology innovation level? A study of linkage effect based on grouping perspective. Research and Development Management, (3).