


1 Introduction
The global climate crisis, marked by global warming, wildfires, droughts, sea level rise, and air pollution, demands urgent and sustainable solutions. As transportation is a significant contributor to global CO2 emissions, promoting electric vehicles (EVs) is essential to mitigate pollution and achieve net-zero targets [1]. EVs offer the potential to remarkably lower the carbon footprint of transportation, especially when combined with renewable energy sources [2]. By displacing conventional vehicles, EVs can contribute to the broader effort to achieve net-zero emissions.
The urgency of achieving net-zero carbon emission targets has been underscored by international bodies such as the United Nations, particularly through initiatives like the Paris Agreement [3, 27]. However, to facilitate this transition, it is imperative to conduct comprehensive studies that examine the various factors influencing EV adoption. Such studies are essential to understand the challenges and opportunities in different regions, develop effective policies, and implement strategies that will enhance the global uptake of EVs. By advancing our understanding of these dynamics, research ensure that the ambitious climate goals set by the international community are met.
This study focuses on the electric vehicle (EV) markets in three major regions: the United States, the European Union (EU), and China. These regions were selected due to their significant contributions to global EV sales and their distinct approaches to EV adoption and policy implementation [4]. The research examines key EV brands within these markets, including Tesla, Ford, and Chevrolet in the United States; Volkswagen, BMW, and Mercedes-Benz in the EU; and BYD Auto and NIO in China. By analyzing these markets, the study aims to analyze the factors driving the promotion of electric vehicles, such as government incentives, consumer preferences, and technological advancements. Specific aspects explored include the role of regulatory frameworks, the impact of infrastructure development on EV growth, and the strategies employed by leading brands to capture market share. This research not only compares the performance of EV markets across these regions but also delves into the environmental benefits, especially in carbon emission reductions, and the potential contribution of EVs to global sustainability efforts.
Previous studies on electric vehicles (EVs) have primarily focused on the technological advancements and economic benefits associated with their adoption. Researchers have extensively examined the efficiency of EV batteries, the innovation of charging infrastructure, and the role of governance in promoting EV sales [5]. Many studies have also highlighted the environmental advantages of EVs, particularly in decreasing greenhouse gas emissions and promoting air quality [6]. However, despite these advancements, several areas remain underexplored or are still under debate. For instance, while the impact of EV adoption on reducing carbon emissions is well-documented, there is ongoing debate about the life cycle environmental impacts of EVs, particularly concerning battery production and disposal. Additionally, the effectiveness of different policy frameworks in various regions has not been fully explored, especially when considering the diverse economic and cultural contexts of different regions. Furthermore, while much attention has been given to the role of government incentives, there is a lack of comprehensive studies that integrate consumer behavior, market dynamics, and technological innovations into a unified analysis of EV adoption. This research aims to contribute to a detailed explanation about the global transition to electric mobility.
The research searches to answer specific questions related to the role of integrated policy frameworks, such as government incentives and environmental regulations, and consumer engagement strategies in promoting EV adoption. Key questions include: How do different policy frameworks influence EV adoption across these major markets? What are the most effective consumer engagement strategies in encouraging the promotion of EVs? And how do technological advancements and infrastructure development contribute to the growth of the EV market? By identifying the critical drivers and barriers to EV adoption, this study aims to inform, industry leaders, researchers, and policymakers on the most effective strategies for accelerating the transition to electric mobility and accomplishing net-zero carbon emissions on a global scale.
2 Data and Materials
2.1 Selected Countries and brands of EV
This study selected the United States, the European Union (EU), and China as the primary regions for analyzing electric vehicle (EV) markets. These regions were chosen due to their significant contributions to global EV sales [7]. In terms of brand selection, the study referred to the popular EV brands in the United States, Europe and China in recent years [8-10]. Based on the information, this study creates figures to show EV sales data and popular EV brands in different regions. At the same time, this study also collected EV sales data in the United States, Europe and China over the past 12 years [4]. This data helps us show the changing trends in EV sales in recent years.
2.2 Regression and correlation analysis
Regression and correlation analysis are fundamental statistical methods used to make explanation and predictions based on the relationship between variables. To analyze the impact of various factors on electric vehicle (EV) sales, the study use simple linear regression and multivariate regression models. Represented by the equation \( y=ax+b \) , the simple linear regression model was used to examine the relationship between EV sales (dependent variable) and individual predictors such as price (x1), carbon emissions (x2), population (x3), and production (x4). Correlation analysis was also managed to measure the strength and direction of the relationships between these variables. For example, a strong negative correlation between EV prices and sales would indicate that as prices decrease, sales increase significantly. Additionally, multiple regression analysis, which incorporates multiple independent variables simultaneously, helps identify these predictors’ combined effect on EV sales. This approach allows for a more comprehensive understanding of how factors such as market size, environmental policies, and production capacities interact to influence EV market dynamics.
2.3 Multivariate modeling
Multivariate modeling provides a more nuanced analysis by considering multiple predictors simultaneously, offering insights into the complex interactions between various factors affecting EV sales. The equation represents the multivariate regression model used in this study: y=a1x1+a2x2+a3x3+...+b, where y denotes EV sales, and x1, x2, x3, etc., represent independent variables such as price, carbon emissions, population, and production. This model helps to isolate each factor’s individual impact while controlling for others’ influence. For instance, by including both price and carbon emissions in the model, it becomes possible to determine the effect of price on EV sales while accounting for the impact of carbon emissions. The coefficients a1, a2, a3, etc., indicate the strength and direction of these relationships. The model’s accuracy and predictive power were evaluated using metrics such as the coefficient of determination (R-squared) and p-values, which help assess the predictors’ significance. This multivariate approach is essential for developing robust strategies for enhancing EV adoption by understanding the interplay of various economic, environmental, and demographic factors.
2.4 Sustainability and Net Zero carbon emissions
The increasing accessibility and promotion of electric vehicles (EVs) not only represents a technological shift but also an economic transformation, a change in lifestyles, and a critical measure to achieve sustainability and net-zero carbon emissions. The raw materials required for EV batteries, such as lithium and cobalt, necessitate further development and sustainable sourcing. Economically, policymakers view the promotion of EVs as a strategic opportunity to reshape their national economic structures [1]. Vehicles powered by gasoline and diesel emit air pollutants that can trigger asthma attacks, cause lung damage, and lead to heart conditions. Research from Duke University [11] highlights that gasoline consumption at gas stations and diesel usage in agricultural equipment contribute significantly to health and climate-related costs [6].
The 2015 Paris Agreement aims to limit temperature rise to 1.5°C above pre-industrial levels. Since transportation is the largest contributor to greenhouse gas emissions [3], replacing ICE vehicles with EVs is considered one of the most effective and rapid approaches. Achieving sustainable resource development and net-zero carbon emissions is a long-term endeavor that will significantly impact people's living conditions and lifestyles [1].
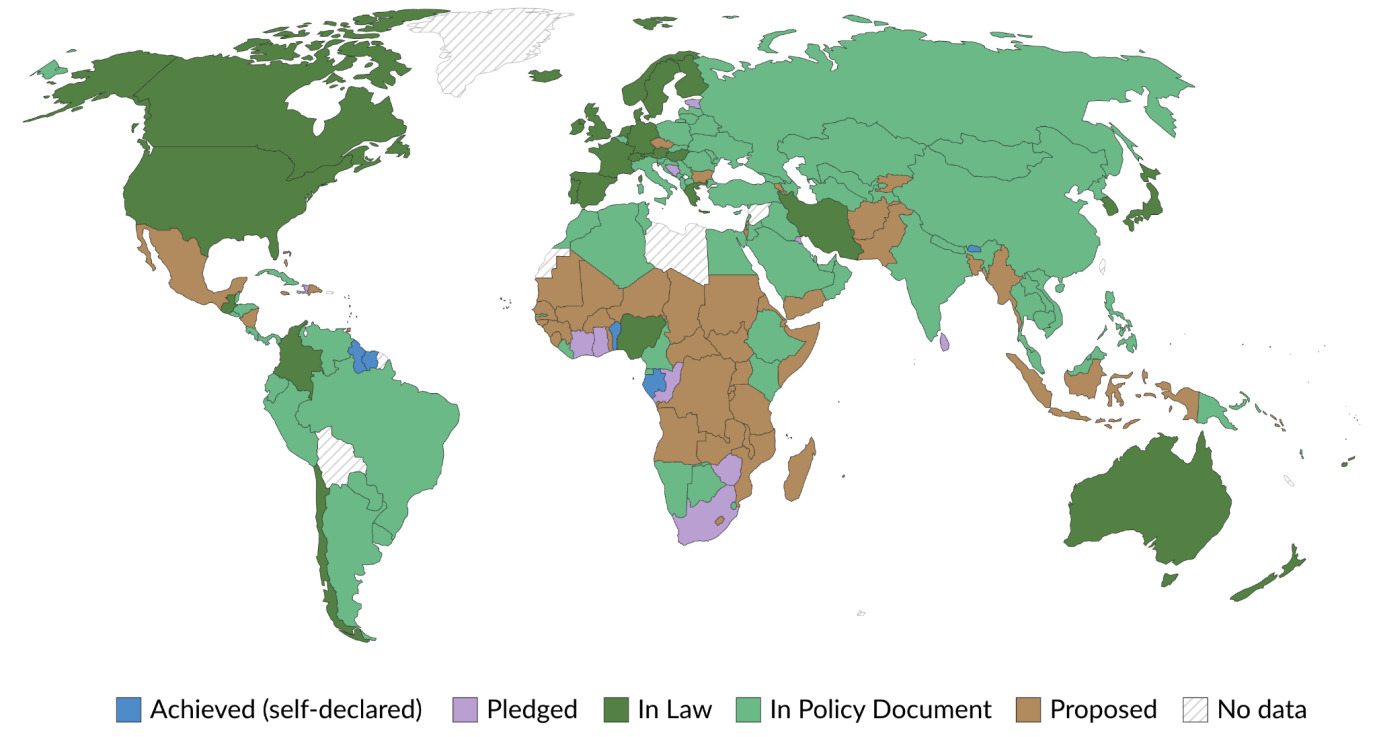
Figure 1. Status of Global Net Zero Carbon Emission Targets
Note. Stages of reaching 'net-zero' emissions. The characteristic of the policy can vary, with some countries have committed to net-zero greenhouse gas emissions, and other countries have only defined it as carbon emissions. [12]
3 Results and Discussion
3.1 EV Sales Trend and EV Brand Preferences
The comparison of EV sales, adoption rates, and brand preferences across the US, EU, and China reveals significant regional differences driven by various market dynamics and policies. In 2023, China led the global EV market with robust sales figures, accounting for approximately 60% of global EV sales, driven by strong government incentives and a wide range of affordable models [4, 16]. The EU followed, showing substantial growth supported by stringent regulations of emissions and motivates for both consumersand manufacturers [16, 17]. In contrast, the US market, while growing, lagged behind due to relatively lower federal incentives and a slower rollout of charging infrastructure [16, 18]. Consumer preferences also varied, with Chinese buyers favoring domestic brands like BYD and NIO, while European consumers leaned towards their local brands such as Volkswagen and BMW. Tesla remained the dominant player in the US, though legacy automakers like Ford and GM have been gaining market share with new EV models [4, 17]. Analyzing these trends highlights the influence of regional policies and economic factors on EV adoption and brand success.
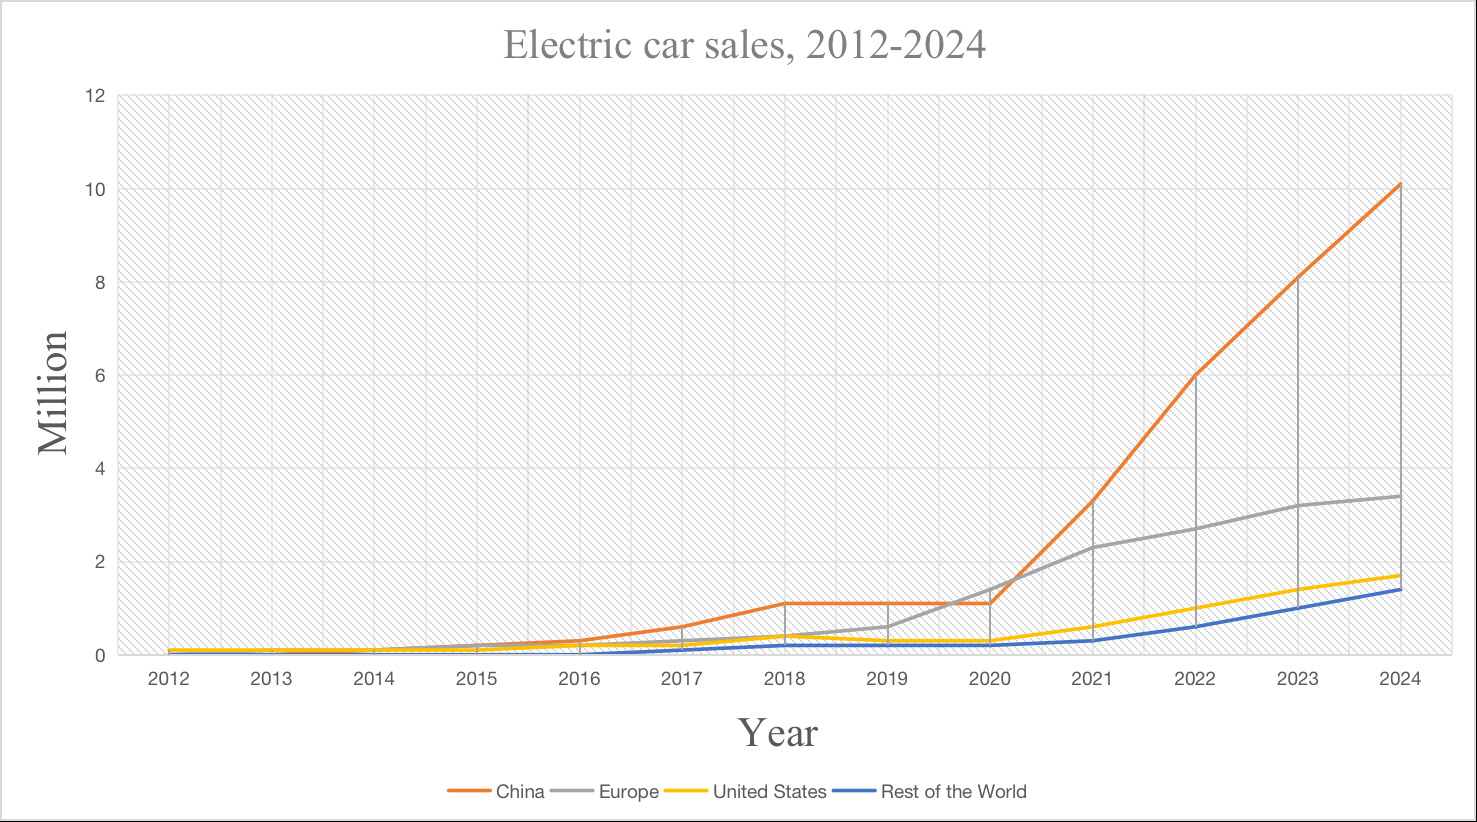
Figure 2. Electric Car Sales between 2012-2024
Note. This line graph illustrates electric car sales growth from 2012 to 2024 across four major regions: China, Europe, the United States, and the rest of the world. The data highlights the rapid increase in sales, particularly in China and Europe, with projections extending into 2024. [4]
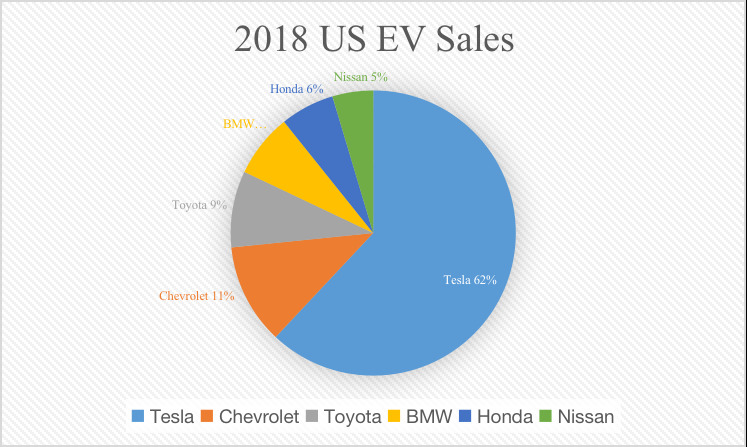
Figure 3. EV Brand Preferences in the United States
Note. This pie chart displays the market share of electric vehicle (EV) sales in 2018. Tesla leads the market with a significant share, followed by Chevrolet, Toyota, BMW, Honda, and Nissan.[13]
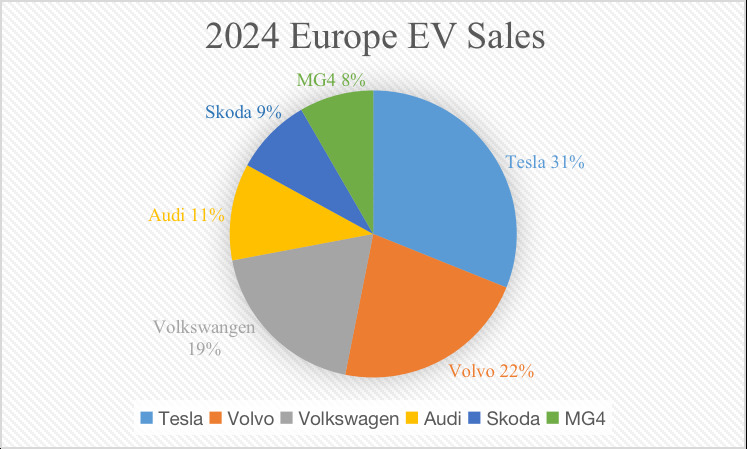
Figure 4. EV Brand Preferences in Europe
Note. This pie chart shows the market share of electric vehicle (EV) sales in Europe for the year 2024. Tesla holds the largest market share, followed by Volvo, Volkswagen, Audi, Skoda, and MG4. [14]
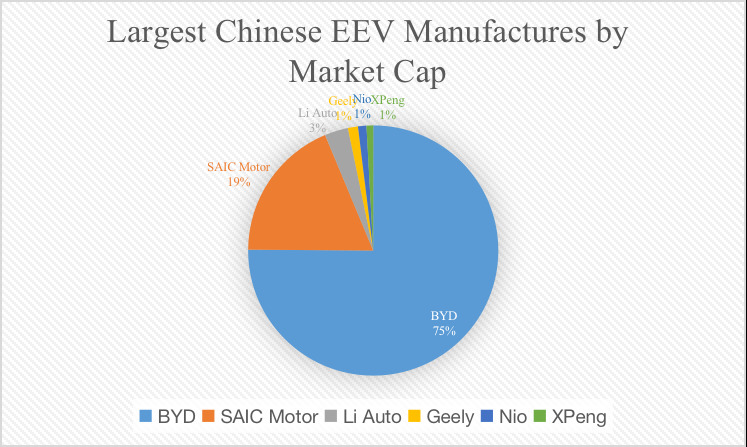
Figure 5. EV Brand Preferences in China
Note. This pie chart illustrates the market capitalization distribution among the largest Chinese electric vehicle (EV) manufacturers. BYD dominates the market, followed by SAIC Motor, Li Auto, Geely, Nio, and XPeng. [15]
3.2 Lifecycle Emissions
The environmental impact of EVs is a critical aspect of their adoption, focusing on carbon emission reductions, life cycle analysis, and battery recycling and waste management. EVs significantly reduce carbon emissions compared to ICE vehicles, with substantial benefits observed in regions with high EV adoption. In 2023, China’s light passenger vehicles alone account for 35% of global road transport emissions reductions, demonstrating the significant potential of EVs to contribute to climate goals [4, 16]. Life cycle analysis reveals that EVs emit substantially less greenhouse gases over their lifetime than conventional vehicles, even when accounting for production and battery manufacturing emissions. These benefits are expected to increase as the electricity grid becomes greener [4, 19]. Battery recycling and waste management are important for decreasing EVs’ environmental influences. Improvement in battery recycling technology is increasing the efficiency of recovering valuable resources such as nickel, lithium, and cobalt, thus minimizing environmental harm [19, 20].
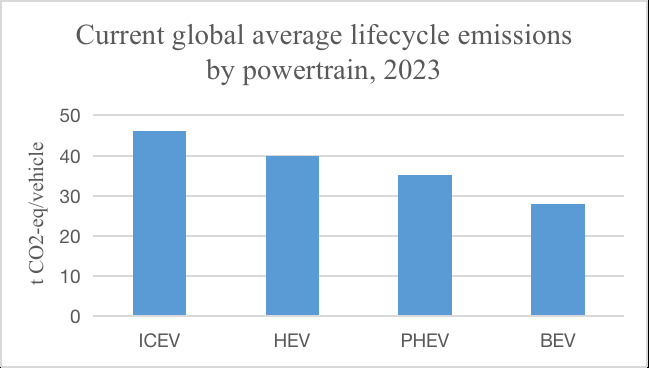
Figure 6. Current Global Average Lifecycle Emissions by Powertrain in 2023
Note. This bar graph compares the global average lifecycle carbon emissions for different types of powertrains in 2023, including internal combustion engine vehicles (ICEV), hybrid electric vehicles (HEV), plug-in hybrid electric vehicles (PHEV), and battery electric vehicles (BEV). The data highlights the emissions differences across these powertrain types, with BEVs showing the lowest lifecycle emissions. [4]
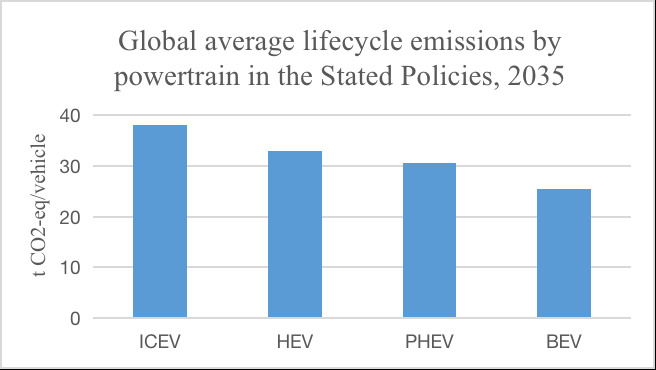
Figure 7. Global Average Lifecycle Emissions by Powertrain in the Stated Policies in 2035
Note. This bar graph compares the projected global average lifecycle carbon emissions for different types of powertrains in 2035, based on stated policy scenarios. The data suggests future reductions in emissions across all powertrain types, with BEVs continuing to exhibit the lowest lifecycle emissions. [4]
3.3 Evaluating Factors Impacting EV Sales and Trends Based on Statistical Models
Several key factors influence EV sales and market trends, including technological advancements, government policies, and demographics. Technological advancements, particularly in battery technology, play a crucial role in enhancing EVs’ performance, range, and affordability. Innovations such as silicon anode batteries and solid-state batteries promise faster charging times, longer lifespans, and higher energy density, which are critical for increasing consumer acceptance and market penetration [21-23]. Government policies are equally important, with subsidies, tax incentives, and stringent emissions regulations driving EV adoption in major markets. The Inflation Reduction Act in the US and the European Green Deal are examples of policies that provide substantial support for EV production and infrastructure development [16, 17]. Demographic factors, including consumer preferences and economic conditions, also impact EV sales. Younger consumers and urban dwellers are more likely to adopt EVs, driven by environmental concerns and access to charging infrastructure [24]. Understanding these factors is essential for stakeholders to develop strategies supporting the EV market’s growth.
Table 1. Correlation Coefficients for Factors Influencing EV Sales in the United States
Factors Influencing EV Sales – US Correlation Cofficients |
Population |
CO2 |
GDP |
Number of new car sold |
Electric car stocks |
Population |
1.00 |
-0.75 |
0.94 |
-0.22 |
0.87 |
CO2 |
-0.75 |
1.00 |
-0.66 |
0.42 |
-0.80 |
GDP |
0.94 |
-0.66 |
1.00 |
-0.29 |
0.97 |
Number of new car sold |
-0.22 |
0.42 |
-0.29 |
1.00 |
-0.35 |
Electric car stocks |
0.87 |
-0.80 |
0.97 |
-0.35 |
1.00 |
Note. This table displays the correlation coefficients between various factors influencing electric vehicle (EV) sales in the United States. The factors considered include population, CO2 emissions, GDP, the number of new cars sold, and electric car stocks. Positive and negative correlations indicate the strength and direction of the relationships between these variables.
Table 2. Correlation Coefficients for Factors Influencing EV Sales in Europe
Factors Influencing EV Sales – Europe Correlation Cofficients |
Population |
CO2 |
GDP |
Number of new car sold |
Electric car stocks |
Population |
1.00 |
-0.87 |
0.57 |
-0.09 |
0.80 |
CO2 |
-0.87 |
1.00 |
-0.11 |
0.16 |
-0.96 |
GDP |
0.57 |
-0.11 |
1.00 |
-0.34 |
0.80 |
Number of new car sold |
-0.09 |
0.16 |
-0.34 |
1.00 |
-0.44 |
Electric car stocks |
0.80 |
-0.96 |
0.80 |
-0.44 |
1.00 |
Note. This table presents the correlation coefficients between various factors influencing electric vehicle (EV) sales in Europe. The factors considered include population, CO2 emissions, GDP, the number of new cars sold, and electric car stocks.
Table 3. Correlation Coefficients for Factors Influencing EV Sales in China
Factors Influencing EV Sales – China Correlation Cofficients |
Population |
CO2 |
GDP |
Number of new car sold |
Electric car stocks |
Population |
1.00 |
-0.49 |
0.92 |
-0.09 |
0.63 |
CO2 |
-0.49 |
1.00 |
-0.78 |
0.44 |
-0.85 |
GDP |
0.92 |
-0.78 |
1.00 |
-0.31 |
0.83 |
Number of new car sold |
-0.09 |
0.44 |
-0.31 |
1.00 |
-0.39 |
Electric car stocks |
0.63 |
-0.85 |
0.83 |
-0.39 |
1.00 |
Note. This table shows the correlation coefficients between various factors influencing electric vehicle (EV) sales in China. The factors considered include population, CO2 emissions, GDP, the number of new cars sold, and electric car stocks.
Table 4. ANOVA Table for US EV Sales Regression Analysis
ANOVAa |
||||||
Model |
Sum of Squares |
df |
Mean Square |
F |
Sig. |
|
1 |
Regression |
.093 |
5 |
.019 |
8.590 |
.053b |
Residual |
.007 |
3 |
.002 |
|||
Total |
.100 |
8 |
||||
a. Dependent Variable: US EV sales |
||||||
b. Predictors: (Constant), Electric car stocks, Number of new cars sold, CO2, Population, GDP |
||||||
Note. This ANOVA table presents the results of the regression analysis for electric vehicle (EV) sales in the United States. The table includes the sum of squares, degrees of freedom (df), mean square, F-value, and significance level (Sig.) for the regression model. The dependent variable is US EV sales, with predictors including electric car stocks, the number of new cars sold, CO2 emissions, population, and GDP.
Table 5. Coefficients Table for US EV Sales Regression Analysis
Coefficientsa |
||||||||
Model |
Unstandardized B |
Coefficients Std. Error |
Standardized Coefficients Beta |
t |
Sig. |
Collinearity Tolerance |
Statisticks VIF |
|
1 |
(Constant) |
1.465 |
8.140 |
.019 |
.180 |
.869 |
||
Population |
-2.930E-9 |
.000 |
-.154 |
-.108 |
.921 |
.011 |
93.725 |
|
CO2 |
2.013E-7 |
.000 |
.424 |
.770 |
.497 |
.072 |
13.942 |
|
GDP |
-1.976E-13 |
.000 |
-3.387 |
-1.490 |
.233 |
.004 |
237.616 |
|
Number of new cars sold |
2.262E-8 |
.000 |
1.035 |
2.263 |
.109 |
.104 |
9.615 |
|
Electric car stocks |
8.901E-7 |
.000 |
4.676 |
2.505 |
.087 |
.006 |
160.154 |
|
a. Dependent Variable: US EV sales |
||||||||
Note. This table presents the coefficients from the regression analysis for electric vehicle (EV) sales in the United States. The table includes unstandardized coefficients (B), standardized coefficients (Beta), standard error, t-values, significance levels (Sig.), and collinearity statistics (tolerance and VIF) for each predictor. The predictors include population, CO2 emissions, GDP, the number of new cars sold, and electric car stocks.
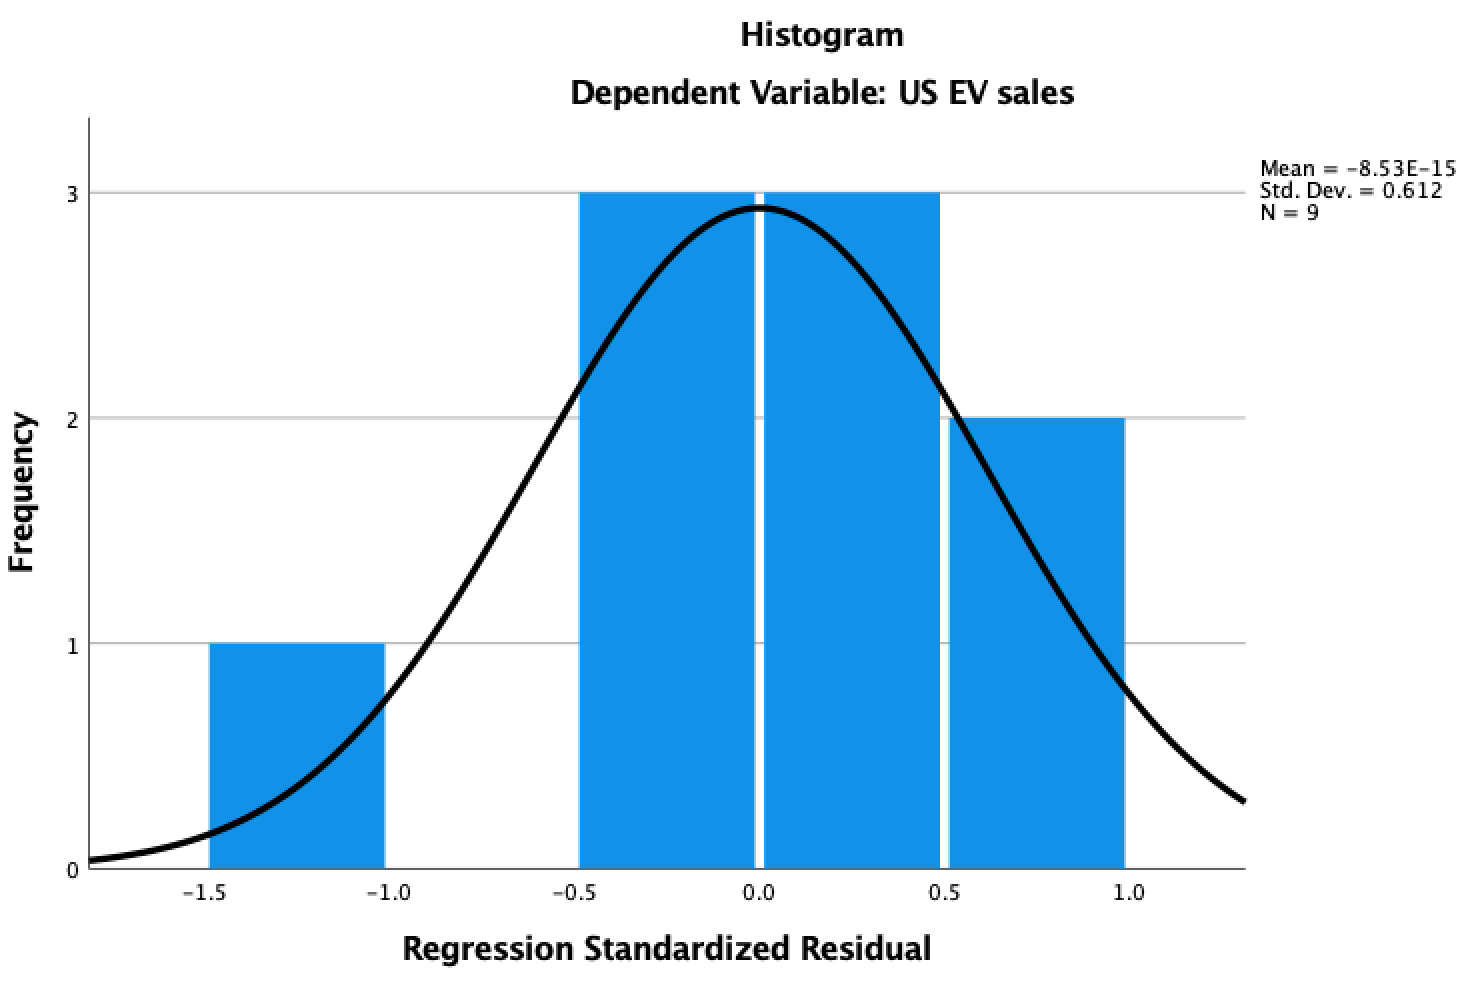
Figure 8. Histogram of Regression Standardized Residuals for US EV Sales
Note. This histogram displays the distribution of the regression standardized residuals for electric vehicle (EV) sales in the United States. The curve represents the normal distribution, providing a visual assessment of the residuals' normality, which is crucial for validating the assumptions of the regression model.
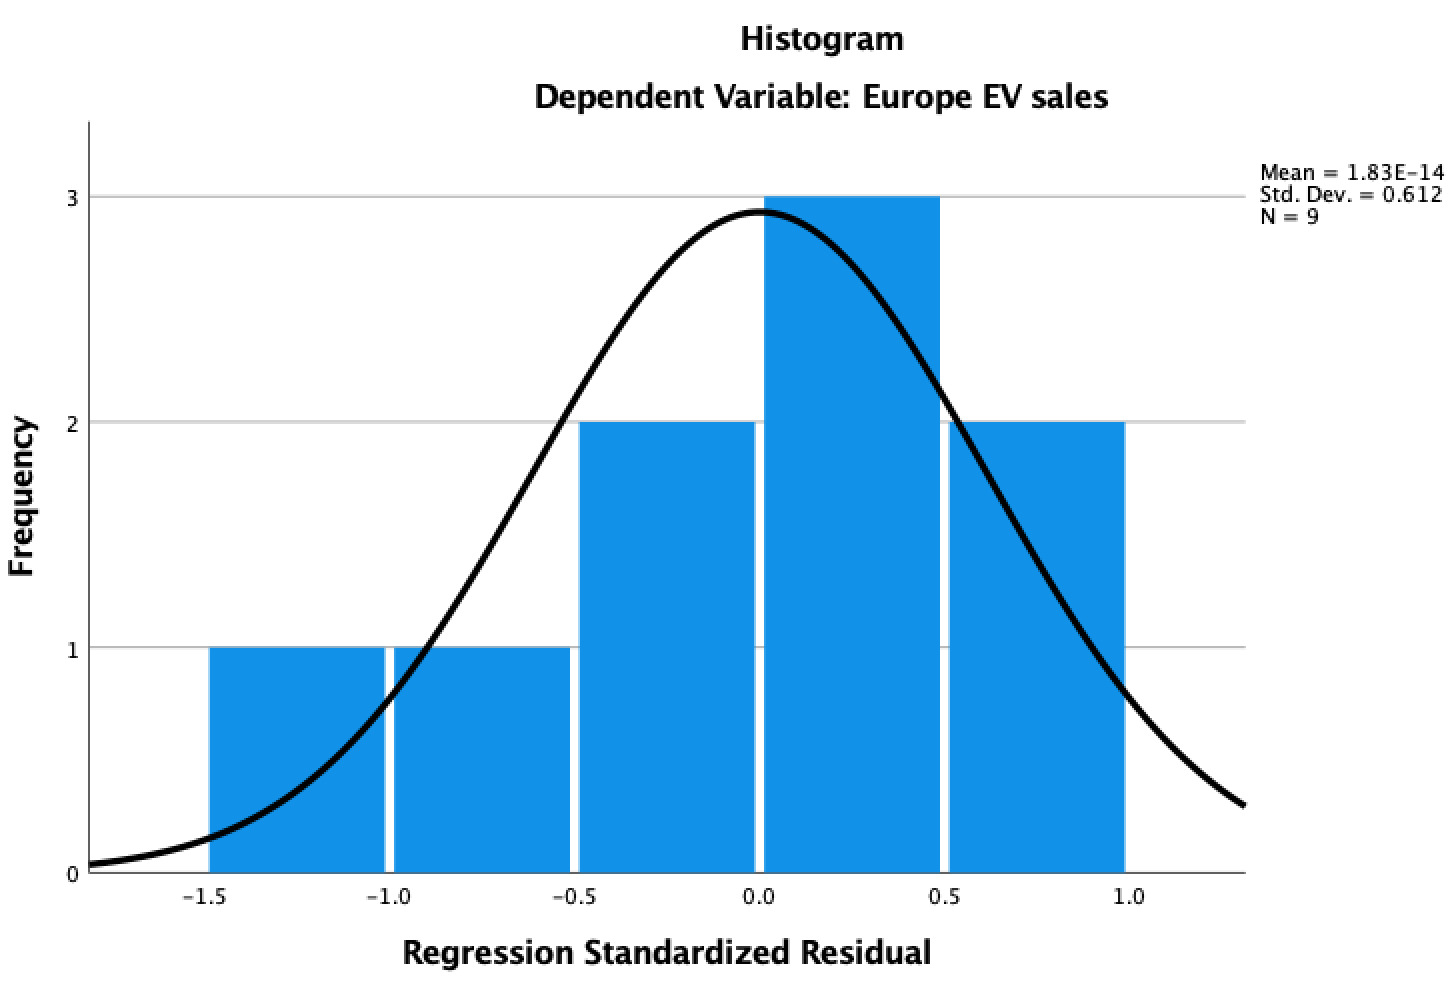
Figure 9. Histogram of Regression Standardized Residuals for Europe EV Sales
Note. This histogram illustrates the distribution of the regression standardized residuals for electric vehicle (EV) sales in Europe. The curve represents the normal distribution, offering a visual check of the residuals' normality, which is essential for validating the assumptions of the regression model.
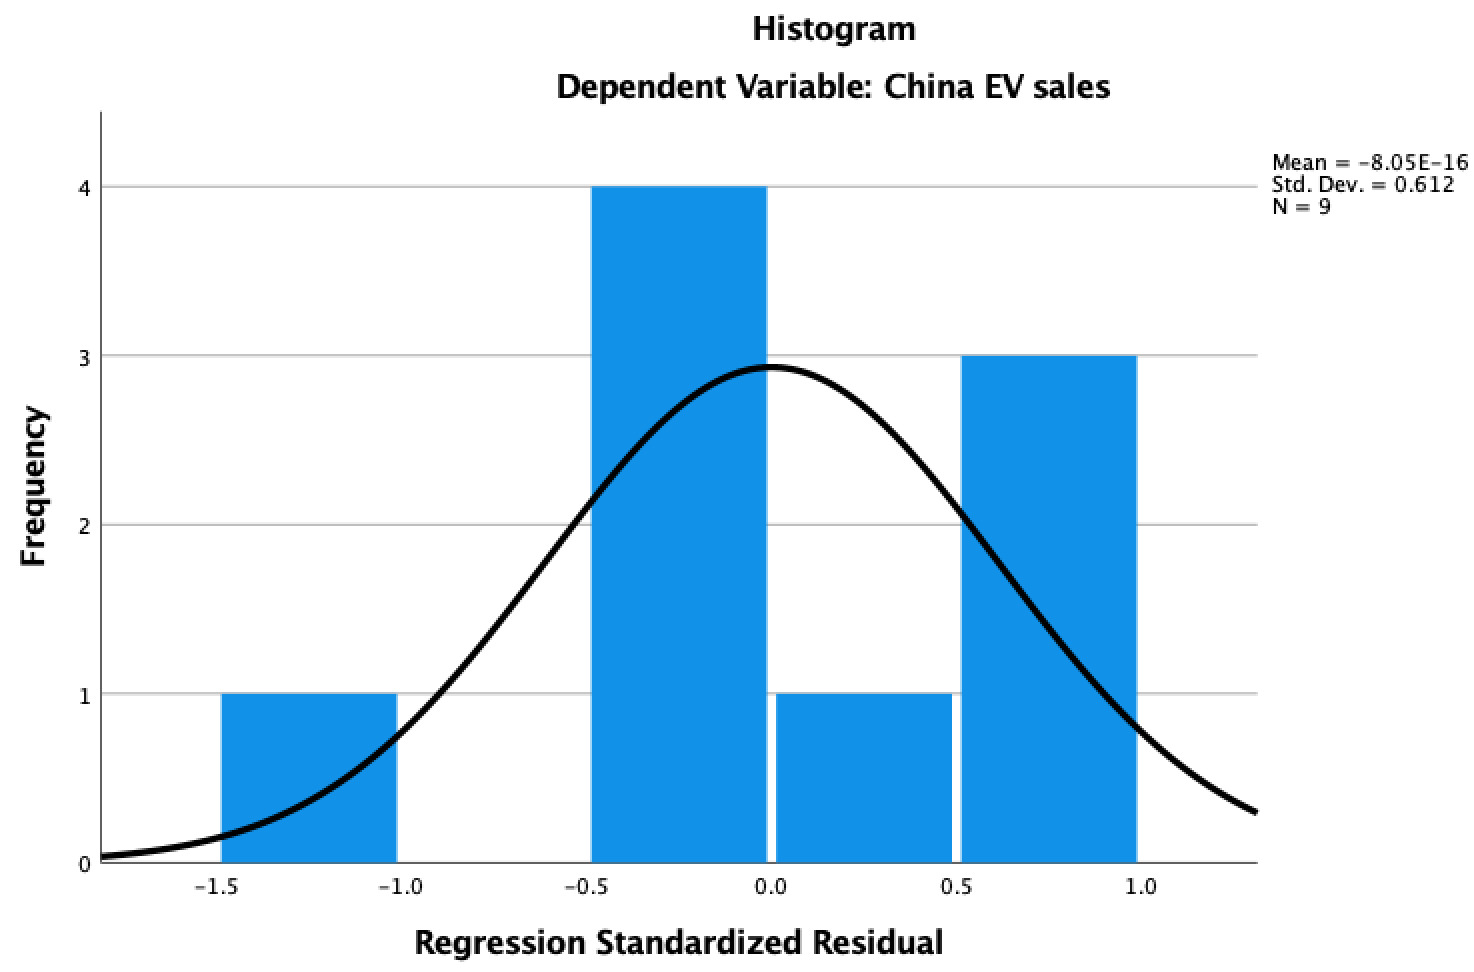
Figure 10. Histogram of Regression Standardized Residuals for China EV Sales
Note. This histogram shows the distribution of the regression standardized residuals for electric vehicle (EV) sales in China. The curve represents the normal distribution, providing a visual check for the residuals' normality, which is crucial for validating the assumptions of the regression model.
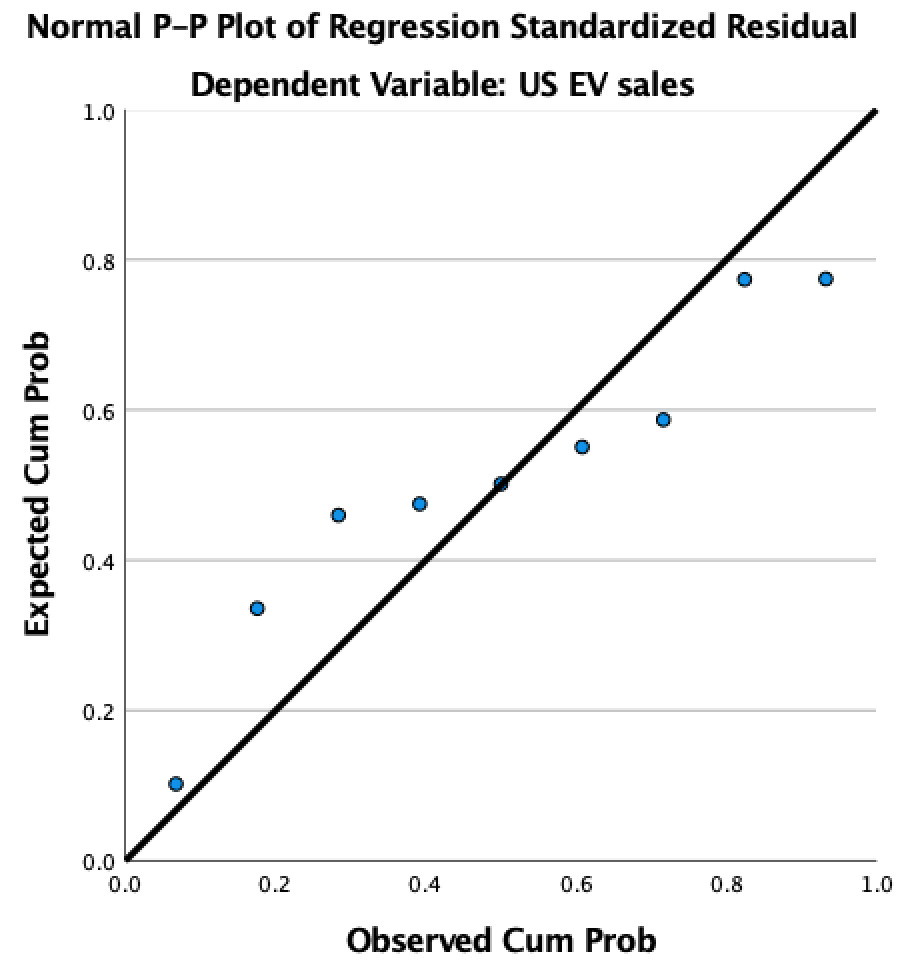
Figure 11. Normal P–P Plot of Regression Standardized Residuals for US EV Sales
Note. This Normal P–P Plot illustrates the relationship between the expected cumulative probability and the observed cumulative probability for the regression standardized residuals of electric vehicle (EV) sales in the United States. The plot is used to assess the normality of the residuals, which is an important assumption for the validity of the regression model.
Table 6. ANOVA Table for Europe EV Sales Regression Analysis
ANOVAa |
||||||
Model |
Sum of Squares |
df |
Mean Square |
F |
Sig. |
|
1 |
Regression |
1.451 |
5 |
.290 |
102.256 |
.0023b |
Residual |
.009 |
3 |
.003 |
|||
Total |
1.460 |
8 |
||||
a. Dependent Variable: Europe EV sales |
||||||
b. Predictors: (Constant), Electric car stocks, Number of new cars sold, CO2, Population, GDP |
||||||
Note. This ANOVA table presents the results of the regression analysis for electric vehicle (EV) sales in Europe. The dependent variable is Europe EV sales, with predictors including electric car stocks, GDP, the number of new cars sold, CO2 emissions, and population.
Table 7. Coefficients Table for Europe EV Sales Regression Analysis
Coefficientsa |
||||||||
Model |
Unstandardized B |
Coefficients Std. Error |
Standardized Coefficients Beta |
t |
Sig. |
Collinearity Tolerance |
Statisticks VIF |
|
1 |
(Constant) |
4.453 |
11.748 |
.379 |
.730 |
|||
Population |
-4.748E-9 |
.000 |
-.036 |
-.126 |
.908 |
.024 |
42.231 |
|
CO2 |
-7.262E-7 |
.000 |
-.278 |
-1.394 |
.258 |
.049 |
20.508 |
|
GDP |
-3.518E-14 |
.000 |
-.048 |
-1.051 |
.370 |
.927 |
1.079 |
|
Number of new cars sold |
-1.071E-8 |
.000 |
-.128 |
-.737 |
.514 |
.064 |
15.553 |
|
Electric car stocks |
4.609E-7 |
.000 |
.714 |
2.402 |
.096 |
.022 |
45.465 |
|
a. Dependent Variable: Europe EV sales |
||||||||
Note. This table presents the coefficients from the regression analysis for electric vehicle (EV) sales in Europe. The predictors include population, CO2 emissions, GDP, the number of new cars sold, and electric car stocks.
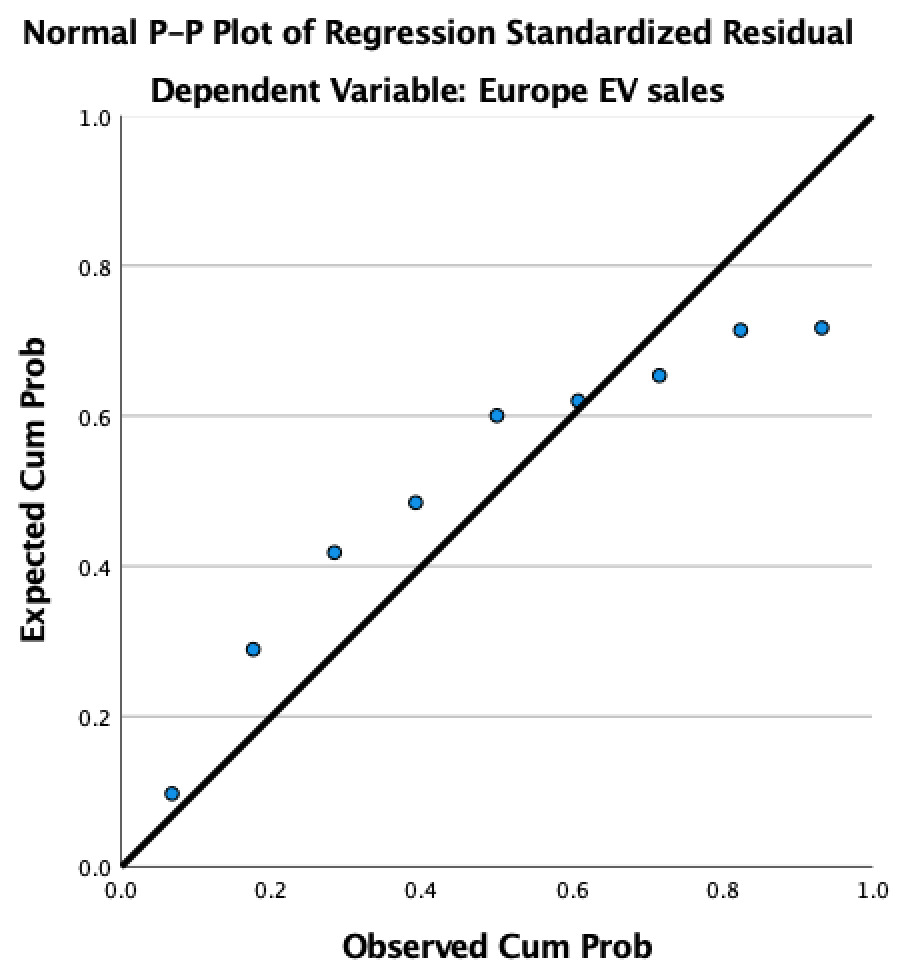
Figure 12. Normal P–P Plot of Regression Standardized Residuals for Europe EV Sales
Note. This Normal P–P Plot illustrates the relationship between the expected cumulative probability and the observed cumulative probability for the regression standardized residuals of electric vehicle (EV) sales in Europe. The plot is used to assess the normality of the residuals, which is an important assumption for the validity of the regression model.
Table 8. ANOVA Table for China EV Sales Regression Analysis
ANOVAa |
||||||
Model |
Sum of Squares |
df |
Mean Square |
F |
Sig. |
|
1 |
Regression |
1.858 |
5 |
.372 |
49.949 |
.004b |
Residual |
.022 |
3 |
.007 |
|||
Total |
1.880 |
8 |
||||
a. Dependent Variable: China EV sales |
||||||
b. Predictors: (Constant), Electric car stocks, Number of new cars sold, CO2, Population, GDP |
||||||
Note. This ANOVA table presents the results of the regression analysis for electric vehicle (EV) sales in China. The dependent variable is China EV sales, with predictors including electric car stocks, the number of new cars sold, CO2 emissions, population, and GDP.
Table 9.
Coefficients Table for China EV Sales Regression Analysis
Coefficientsa |
||||||||
Model |
Unstandardized B |
Coefficients Std. Error |
Standardized Coefficients Beta |
t |
Sig. |
Collinearity Tolerance |
Statisticks VIF |
|
1 |
(Constant) |
25.047 |
20.087 |
1.247 |
.301 |
|||
Population |
-2.146E-9 |
.000 |
-.894 |
-.1549 |
.219 |
.012 |
84.131 |
|
CO2 |
-7.671E-7 |
.000 |
-.074 |
-.196 |
.857 |
.028 |
36.309 |
|
GDP |
1.867E-13 |
.000 |
.883 |
-1.051 |
.370 |
.004 |
223.477 |
|
Number of new cars sold |
4.182E-8 |
.000 |
.441 |
-.737 |
.514 |
.122 |
8.171 |
|
Electric car stocks |
3.291E-7 |
.000 |
1.113 |
3.002 |
.058 |
.029 |
34.706 |
|
a. Dependent Variable: China EV sales |
||||||||
Note. This table presents the coefficients from the regression analysis for electric vehicle (EV) sales in China. The predictors include population, CO2 emissions, GDP, the number of new cars sold, and electric car stocks.

Figure 10. Normal P–P Plot of Regression Standardized Residuals for China EV Sales
Note. This Normal P–P Plot illustrates the relationship between the expected cumulative probability and the observed cumulative probability for the regression standardized residuals of electric vehicle (EV) sales in China. The plot is used to assess the normality of the residuals, which is crucial for validating the assumptions of the regression model.
3.4 Achieving Sustainability and Net Zero Carbon Emissions
To promote sustainability, it is essential to continue improving battery technology and recycling processes to minimize the environmental impact of EV production and disposal [20, 22]. Governments and industry stakeholders must collaborate to expand the charging infrastructure, ensuring it is widely accessible and capable of supporting a growing number of EVs [4]. Additionally, policies that incentivize using renewable energy for charging EVs can significantly enhance their environmental benefits [4, 25]. Potential challenges include the high initial cost of EVs, which can be mitigated through continued subsidies and incentives, and the need for significant investment in charging infrastructure.
Although replacing ICE vehicles with EVs will greatly help sustainable development, reduce carbon emissions from transportation, and alleviate climate warming, EVs still have some negative impacts on sustainable development. In order to popularize the use of EVs, we should consider more about the application of related products and resources.Take power-grid as an example. As more and more people choose to charge their EVs at night, the usage pattern of power-grid has been changed, thus reducing its service life from 30 years to 3 years. This requires a significant increase in the production volume of power-grids, and it costs more than $20,000 each power-grid. The consumption of more related products is not conducive to sustainable development [26].
Increasing the use of EVs and sustainable energy to combat climate change is a viable approach, but large-scale use of EVs in the short term will create a lot of uncertainty [1]. Policies like the Paris Agreement help us to regularly observe and provide feedback on our decisions. At the annual UN Climate Change Conference, countries will also modify and formulate new policies based on the current state of the environment. With more data and research support, combined with updated policies, sustainable development will reach a more stable and predictable state in the future.
Achieving sustainability and net zero carbon emissions through EV adoption requires a multifaceted approach that includes recommended practices, addressing potential challenges, and a future outlook. Looking forward, the widespread adoption of EVs, coupled with advancements in technology and supportive policies, holds the promise of achieving net zero carbon emissions in the transportation sector. Addressing these challenges and implementing effective strategies can accelerate the transition to a sustainable, low-carbon future [19, 20].
4 Conclusion and Implications
This study offers a thoroughly analysis of the factors driving EV adoption in the world's largest markets. The findings highlight the important role of integrated policy frameworks and consumer engagement in accelerating the transition to electric mobility. To achieve net-zero carbon emissions, continuous investment in battery technology, expansion of charging infrastructure, and international cooperation are essential. Policymakers and industry leaders must work together to create a sustainable, low-carbon future that benefits all regions, including emerging markets. The insights gained from this research offer a roadmap for guiding the global EV market towards a more sustainable future.
One of the key findings of this study is the significant regional differences in electric vehicle (EV) adoption across the United States, the European Union, and China, driven largely by varying policy frameworks, consumer preferences, and market dynamics. China emerged as the global leader in EV sales, supported by strong government incentives and a rapidly expanding charging infrastructure. The European Union demonstrated substantial growth, driven by stringent emissions regulations and robust incentives aimed at both consumers and manufacturers. Meanwhile, the United States, despite being a hub for technological innovation, showed slower growth in EV adoption due to relatively lower federal incentives and challenges in infrastructure development.
Another finding is the significance of integrated policy making in promoting EV adoption. The study highlighted that regions with well-coordinated policies that combine incentives, regulatory measures, and infrastructure support tend to experience higher EV adoption rates. Moreover, the analysis underscored the importance of consumer engagement strategies, particularly in educating consumers about the long-term advantages of EVs and addressing concerns related to cost and convenience.
However, this study also has some caveats. While it provides a detailed analysis of the factors influencing EVs’ accessibility, the study primarily focuses on the three largest markets, potentially overlooking emerging markets where EV adoption is still in its nascent stages. Additionally, the study relies on available data from 2023, which may not fully capture the long-term trends or the impact of future technological advancements and policy changes. Finally, the environmental analysis, while robust, acknowledges the ongoing debate around the life cycle impacts of EV batteries, particularly concerning production and disposal processes, which remain areas for further research.
To further enhance the promotion of EVs, and achieve the goal of net-zero carbon emissions, several key strategies should be considered. First, continued investment in battery technology is crucial. Advancements in battery efficiency, energy density, and cost reduction will make EVs more accessible and attractive to a broader range of consumers. Research and development should focus on next-generation batteries which promise higher energy storage and safety. Additionally, expanding the capacity for battery recycling and improving the sustainability of raw material sourcing, particularly for lithium, cobalt, and nickel, will address environmental concerns and reduce dependency on finite resources.
Second, the expansion of EV charging infrastructure is vital. Governments and private stakeholders must collaborate to create a widespread and reliable network of charging stations, particularly in underserved and rural areas. This infrastructure should be supported by policies that encourage the use of sustainable resource for charging, ensuring that the environmental benefits of EVs are maximized. Moreover, smart grid technology should be integrated to manage the increased demand for electricity efficiently and to balance the grid load, thereby extending the lifespan of power grids and minimizing disruptions.
Achieving net-zero carbon emissions will require a holistic approach that integrates policy, technology, and consumer engagement. Governments should continue to implement and strengthen policies that support EV adoption, including subsidies, tax incentives, and regulations that phase out internal combustion engine vehicles. Additionally, policies should promote the decarbonization of the energy sector, as the environmental benefits of EVs are closely tied to the cleanliness of the electricity grid. Consumer engagement is also essential; educational campaigns that highlight the improved performance of EVs, environmental benefits, and long-term cost savings, which can help shift consumer preferences towards more sustainable transportation options.
Furthermore, international cooperation will play a crucial role in achieving global net-zero targets. Countries must work together to harmonize standards, share technological advancements, and support the global supply chain for EV production. By fostering a collaborative approach, nations can accelerate the transition to electric mobility and ensure that the benefits are equitably distributed across all regions, including emerging markets. This collective effort will not only contribute to mitigating climate change but also drive economic growth and innovation in the automotive and energy sectors.
This research is significant as it provides a detailed analysis of the factors driving the accessibility of EVs across the world’s largest markets. By exploring the interplay between technological advancements, consumer behavior, and policy frameworks, this study offers valuable insights that can inform future strategies for promoting EV adoption and achieving sustainability goals. The findings highlight the importance of a well-coordinated approach that integrates government policies, infrastructure development, and consumer engagement, which is essential for overcoming the barriers to promote EV usage. This research contributes to the wider discussion on how to transition to sustainable transportation and reduce carbon emissions on a global scale.
The broader implications of this research extend beyond the automotive industry, influencing policy-making, urban planning, and energy management. The study’s insights can be applied to developing policies that promote clean energy and sustainable resource management, which are critical for achieving net-zero carbon emissions. Additionally, the findings can guide international collaborations and investments in EV infrastructure, ensure the benefits of electric mobility acknowledged worldwide, including in emerging markets. As we aiming to achieve a greener future, the strategies and recommendations derived from this research can serve as a roadmap for governments, industry leaders, and stakeholders across various sectors, helping to drive the global transition to a sustainable, low-carbon economy.
References
[1]. Charette, R. N. (2023, March 28). The EV transition is harder than anyone thinks. IEEE Spectrum. https://spectrum.ieee.org/the-ev-transition-explained-2659602311
[2]. Moses, M. (2020, February 15). Benefits of electric cars on the environment. EDF Energy. https://www.edfenergy.com/energywise/electric-cars-and-environment
[3]. International Energy Agency. (2020). Global energy-related CO2 emissions by sector. IEA.
[4]. International Energy Agency. (2024). Global EV outlook 2024. IEA. https://www.iea.org/reports/global-ev-outlook-2024
[5]. Crownhart, C. (2023, January 4). What’s next for batteries. MIT Technology Review. https://www.technologyreview.com/2023/01/04/1066141/whats-next-for-batteries/
[6]. Earthjustice. (2022, December 30). Electric vehicles are not just the wave of the future, they are saving lives today. Earthjustice. https://earthjustice.org/feature/electric-vehicles-explainer?gad_source=1
[7]. International Energy Agency. (2024). Global EV outlook 2024. IEA. https://www.iea.org/reports/global-ev-outlook-2024/trends-in-electric-cars
[8]. Evadoption. (2018). US EV sales percentages of total vehicle sales by brand. Evadoption.com. https://evadoption.com/ev-sales/evs-percent-of-vehicle-sales-by-brand/
[9]. European Alternative Fuels Observatory. (2024, July 3). Europe’s EV market update for May 2024. Alternative-Fuels-Observatory.ec.europa.eu. https://alternative-fuels-observatory.ec.europa.eu/general-information/news/europes-ev-market-update-may-2024
[10]. Ross, L. (2024, May 2). Top 6 Chinese electric vehicle companies. Thomasnet. https://www.thomasnet.com/insights/top-chinese-ev-companies/
[11]. Duke University, & Shindell, D. T. (2015, March 4). New models yield clearer picture of emissions’ true costs. Phys.org. https://phys.org/news/2015-03-yield-clearer-picture-emissions-true.html
[12]. Energy and Climate Intelligence Unit, Data-Driven EnviroLab, NewClimate Institute, & Oxford Net Zero - Net Zero Tracker. (2023). Status of net-zero carbon emissions targets. Our World in Data. https://ourworldindata.org/grapher/net-zero-targets
[13]. Evadoption. (2018). US EV sales percentages of total vehicle sales by brand. Evadoption.com. https://evadoption.com/ev-sales/evs-percent-of-vehicle-sales-by-brand/
[14]. European Alternative Fuels Observatory. (2024, July 3). Europe’s EV market update for May 2024. Alternative-Fuels-Observatory.ec.europa.eu. https://alternative-fuels-observatory.ec.europa.eu/general-information/news/europes-ev-market-update-may-2024
[15]. Ross, L. (2024, May 2). Top 6 Chinese electric vehicle companies. Thomasnet. https://www.thomasnet.com/insights/top-chinese-ev-companies/
[16]. International Energy Agency. (2023). Global EV outlook 2023. IEA. https://www.iea.org/reports/global-ev-outlook-2023
[17]. Stevens, A. (2023, July 27). An overview of federal government support for electric vehicles. Institute for Energy Research. https://www.instituteforenergyresearch.org/regulation/an-overview-of-federal-government-support-for-electric-vehicles/
[18]. Javadnejad, F., Jahanbakh, M., Pinto, C. A., & Saeidi, A. (2023). Analyzing incentives and barriers to electric vehicle adoption in the United States. Environment Systems and Decisions. https://doi.org/10.1007/s10669023099583
[19]. Hausfather, Z. (2019, May 13). How electric vehicles help to tackle climate change. Carbon Brief. https://www.carbonbrief.org/factcheck-how-electric-vehicles-help-to-tackle-climate-change/
[20]. McConnell, V., & Leard, B. (2020). Progress and potential for electric vehicles to reduce carbon emissions.
[21]. Crownhart, C. (2023, January 4). What’s next for batteries. MIT Technology Review.
[22]. Steer EV. (2023a, June 23). Top 10 revolutionary advances in EV battery technology. Steer EV. https://steerev.com/electric-vehicles-evs/top-revolutionary-advances-in-ev-battery-technology/
[23]. Steer EV. (2023b, September 7). Future of EV batteries: Tech, advancements, & what’s next. Steer EV. https://steerev.com/electric-vehicles-evs/future-of-ev-batteries-tech-advancements-whats-next/
[24]. Evenergi. (2023). EV owner demographics and behaviours. Ausgrid.
[25]. Johnson, P. (2022, October 20). How record EV and clean energy deployment are working to reduce CO2 emissions. Electrek. https://electrek.co/2022/10/20/record-ev-clean-energy-deployment-reducing-co2-emissions/
[26]. Goldstein, H. (2023, March 31). The staggering scale of the EV transition. IEEE Spectrum. https://spectrum.ieee.org/the-ev-transition-explained-2659623150
[27]. UNFCCC. (2015). The Paris Agreement. United Nations Climate Change; United Nations. https://unfccc.int/process-and-meetings/the-paris-agreement
Cite this article
Sun,S.;Li,T. (2024). An Analysis of the Global EV Market: Sustainable Pathways to Net Zero Emissions. Journal of Applied Economics and Policy Studies,11,67-80.
Data availability
The datasets used and/or analyzed during the current study will be available from the authors upon reasonable request.
Disclaimer/Publisher's Note
The statements, opinions and data contained in all publications are solely those of the individual author(s) and contributor(s) and not of EWA Publishing and/or the editor(s). EWA Publishing and/or the editor(s) disclaim responsibility for any injury to people or property resulting from any ideas, methods, instructions or products referred to in the content.
About volume
Journal:Journal of Applied Economics and Policy Studies
© 2024 by the author(s). Licensee EWA Publishing, Oxford, UK. This article is an open access article distributed under the terms and
conditions of the Creative Commons Attribution (CC BY) license. Authors who
publish this series agree to the following terms:
1. Authors retain copyright and grant the series right of first publication with the work simultaneously licensed under a Creative Commons
Attribution License that allows others to share the work with an acknowledgment of the work's authorship and initial publication in this
series.
2. Authors are able to enter into separate, additional contractual arrangements for the non-exclusive distribution of the series's published
version of the work (e.g., post it to an institutional repository or publish it in a book), with an acknowledgment of its initial
publication in this series.
3. Authors are permitted and encouraged to post their work online (e.g., in institutional repositories or on their website) prior to and
during the submission process, as it can lead to productive exchanges, as well as earlier and greater citation of published work (See
Open access policy for details).
References
[1]. Charette, R. N. (2023, March 28). The EV transition is harder than anyone thinks. IEEE Spectrum. https://spectrum.ieee.org/the-ev-transition-explained-2659602311
[2]. Moses, M. (2020, February 15). Benefits of electric cars on the environment. EDF Energy. https://www.edfenergy.com/energywise/electric-cars-and-environment
[3]. International Energy Agency. (2020). Global energy-related CO2 emissions by sector. IEA.
[4]. International Energy Agency. (2024). Global EV outlook 2024. IEA. https://www.iea.org/reports/global-ev-outlook-2024
[5]. Crownhart, C. (2023, January 4). What’s next for batteries. MIT Technology Review. https://www.technologyreview.com/2023/01/04/1066141/whats-next-for-batteries/
[6]. Earthjustice. (2022, December 30). Electric vehicles are not just the wave of the future, they are saving lives today. Earthjustice. https://earthjustice.org/feature/electric-vehicles-explainer?gad_source=1
[7]. International Energy Agency. (2024). Global EV outlook 2024. IEA. https://www.iea.org/reports/global-ev-outlook-2024/trends-in-electric-cars
[8]. Evadoption. (2018). US EV sales percentages of total vehicle sales by brand. Evadoption.com. https://evadoption.com/ev-sales/evs-percent-of-vehicle-sales-by-brand/
[9]. European Alternative Fuels Observatory. (2024, July 3). Europe’s EV market update for May 2024. Alternative-Fuels-Observatory.ec.europa.eu. https://alternative-fuels-observatory.ec.europa.eu/general-information/news/europes-ev-market-update-may-2024
[10]. Ross, L. (2024, May 2). Top 6 Chinese electric vehicle companies. Thomasnet. https://www.thomasnet.com/insights/top-chinese-ev-companies/
[11]. Duke University, & Shindell, D. T. (2015, March 4). New models yield clearer picture of emissions’ true costs. Phys.org. https://phys.org/news/2015-03-yield-clearer-picture-emissions-true.html
[12]. Energy and Climate Intelligence Unit, Data-Driven EnviroLab, NewClimate Institute, & Oxford Net Zero - Net Zero Tracker. (2023). Status of net-zero carbon emissions targets. Our World in Data. https://ourworldindata.org/grapher/net-zero-targets
[13]. Evadoption. (2018). US EV sales percentages of total vehicle sales by brand. Evadoption.com. https://evadoption.com/ev-sales/evs-percent-of-vehicle-sales-by-brand/
[14]. European Alternative Fuels Observatory. (2024, July 3). Europe’s EV market update for May 2024. Alternative-Fuels-Observatory.ec.europa.eu. https://alternative-fuels-observatory.ec.europa.eu/general-information/news/europes-ev-market-update-may-2024
[15]. Ross, L. (2024, May 2). Top 6 Chinese electric vehicle companies. Thomasnet. https://www.thomasnet.com/insights/top-chinese-ev-companies/
[16]. International Energy Agency. (2023). Global EV outlook 2023. IEA. https://www.iea.org/reports/global-ev-outlook-2023
[17]. Stevens, A. (2023, July 27). An overview of federal government support for electric vehicles. Institute for Energy Research. https://www.instituteforenergyresearch.org/regulation/an-overview-of-federal-government-support-for-electric-vehicles/
[18]. Javadnejad, F., Jahanbakh, M., Pinto, C. A., & Saeidi, A. (2023). Analyzing incentives and barriers to electric vehicle adoption in the United States. Environment Systems and Decisions. https://doi.org/10.1007/s10669023099583
[19]. Hausfather, Z. (2019, May 13). How electric vehicles help to tackle climate change. Carbon Brief. https://www.carbonbrief.org/factcheck-how-electric-vehicles-help-to-tackle-climate-change/
[20]. McConnell, V., & Leard, B. (2020). Progress and potential for electric vehicles to reduce carbon emissions.
[21]. Crownhart, C. (2023, January 4). What’s next for batteries. MIT Technology Review.
[22]. Steer EV. (2023a, June 23). Top 10 revolutionary advances in EV battery technology. Steer EV. https://steerev.com/electric-vehicles-evs/top-revolutionary-advances-in-ev-battery-technology/
[23]. Steer EV. (2023b, September 7). Future of EV batteries: Tech, advancements, & what’s next. Steer EV. https://steerev.com/electric-vehicles-evs/future-of-ev-batteries-tech-advancements-whats-next/
[24]. Evenergi. (2023). EV owner demographics and behaviours. Ausgrid.
[25]. Johnson, P. (2022, October 20). How record EV and clean energy deployment are working to reduce CO2 emissions. Electrek. https://electrek.co/2022/10/20/record-ev-clean-energy-deployment-reducing-co2-emissions/
[26]. Goldstein, H. (2023, March 31). The staggering scale of the EV transition. IEEE Spectrum. https://spectrum.ieee.org/the-ev-transition-explained-2659623150
[27]. UNFCCC. (2015). The Paris Agreement. United Nations Climate Change; United Nations. https://unfccc.int/process-and-meetings/the-paris-agreement