


1.Introduction
New guidelines are urgently needed. The 2022 Paris Agreement established a new global climate governance mechanism, advancing this process through the Nationally Determined Contributions (NDC) goals and action plans of each party involved [1]. In terms of “carbon reduction” measures, the international community has taken action, including the introduction of a “carbon trading” mechanism to promote global climate governance [2]. As a major participant, contributor, and leader in global climate governance, China’s President Xi Jinping announced during the 75th United Nations General Assembly Debate in 2020 that China would strive to peak CO₂ emissions before 2030 and work toward achieving carbon neutrality by 2060 [3]. To expedite the attainment of the “carbon peak” target, China’s 13th Five-Year Plan and the “13th Five-Year Work Plan for Controlling Greenhouse Gas Emissions” proposed that key regions should aim to reach their carbon peak targets ahead of the national timeline [4].
As an essential part of the Yangtze River Delta region’s economy, Jiangsu Province faces challenges related to regional and industrial balance. However, according to the data from the World Resources Institute’s Climate and Energy Program, Jiangsu Province has ranked among the top three in China for total carbon emissions since 2004, consistently maintaining this position. The worsening of carbon emissions is primarily due to increased industrial emissions and an imbalanced energy structure [5]. As a major manufacturing hub in China, Jiangsu has extensive heavy industry, chemical, and steel sectors, all of which are energy-intensive. Currently, Jiangsu is still overly reliant on traditional coal energy, making it difficult to reduce carbon emissions. Given the strong background of policy support, it is crucial to analyze data scientifically and accurately to achieve precise predictions of carbon emissions, which remains an urgent challenge.
In light of the above analysis, this paper utilizes numerical fitting and scenario analysis methods to study and forecast carbon emissions under different scenarios to achieve Jiangsu Province’s “carbon peak” and “carbon neutrality” goals and to accelerate its transition to a low-carbon society. By simulating and analyzing carbon emission trends across various scenarios, this study provides robust support for Jiangsu’s carbon reduction policies and measures, offering a model for similar low-carbon cities in China and advancing China’s path to achieving its “carbon peak” goal.
2.Literature Review
Since China made its solemn commitment to achieve “carbon peaking” by 2030 and “carbon neutrality” by 2060, the country has actively launched a new strategic layout to advance ecological civilization [6]. Undoubtedly, carbon neutrality has become a major socio-economic transformation in 21st-century China [7,8].
Since the 18th National Congress of the Communist Party, China has aimed to build a beautiful new nation, consistently adhering to the fundamental concept of green and sustainable development. The Party Central Committee and the State Council have successively issued policies such as the “Opinions on Fully and Accurately Implementing New Development Concepts to Achieve Carbon Peaking and Carbon Neutrality” and the “Carbon Peaking Action Plan Before 2030.” Relevant departments have also introduced 12 implementation plans targeting key areas and industries, as well as 11 support and guarantee plans. Additionally, all 31 provinces, autonomous regions, and municipalities have completed their respective “carbon peaking” implementation plans. The issuance and implementation of these policy documents and plans signify the continuous advancement of the “dual carbon” policy framework.
Balancing economic development with carbon emissions is currently a hot research topic. Existing studies often differ in focus. Liu Yatian et al. [9], for example, constructed a green development evaluation system for the Qaidam Basin, concluding that controlling carbon emissions will be a priority in future development. Ma Yingying et al. [10] focused on implementing departments, developing a tripartite collaborative governance game model involving “central government-local government-high-emission enterprises.” They found that appropriate subsidies and tax policies would effectively achieve pollution and carbon reduction. Hongli Wang and Jinguang Guo [11], examining 113 cities across 11 coastal provinces in China, discussed the impact mechanism of environmental regulations on the dual carbon goals, providing new policy insights for the government.
However, sustainable development inevitably requires a substantial energy supply, while the traditional energy structure is primarily reliant on fossil fuels. The combustion of these fuels generates considerable carbon emissions, which will hinder the achievement of the dual carbon goals. Therefore, an energy revolution has become an urgent need of our time, and restructuring the energy mix is essential [12]. Sun Baodong and Zhang Jun [13], after comprehensively considering key boundary conditions related to energy and the economy, proposed the China Energy System Forecast Optimization Model (CESFOM) to conduct an in-depth analysis of the pathway to carbon reduction. Their findings indicated that China’s carbon peak would occur around 2029 at approximately 10.9 billion tons, decreasing to around 2.2 billion tons by 2060. Jiang Kejun et al. [14] used a multi-objective analysis framework to study China’s long-term energy transition pathways, concluding that technological innovation is crucial. Cai Liya et al. [15], using the LEAP energy system model, simulated energy supply, demand, and carbon emissions across multiple scenarios and identified an overall trend of “reduced coal, stable oil, increased gas, and accelerated electrification.” Shengyuan Liu et al. [16] employed the Electricity Supply Structure Transition (EPSST) model to forecast China’s future power supply. The Modern Management Research Center of Tsinghua University [17] and Chi Zhao [18] analyzed the patterns of carbon peaking in developed countries from an international comparative perspective using mathematical theory, deriving strategic recommendations for China’s carbon peaking process. Qi Yu and Li Yan et al. [19] used the Logarithmic Mean Divisia Index (LMDI) model to examine the degree of impact various factors have on carbon emissions, finding that low-carbon technology has a suppressive effect on the logistics industry, while factors such as industry income levels and workforce size have a promotional effect.
Carbon emission prediction based on provincial boundaries is one of the subdivisions of this field. In Jiangsu Province, where rapid economic development has led to persistently high carbon emissions [20], the 13th Plenary Session of the Provincial Committee proposed that Jiangsu should serve as a model in advancing industrial and energy structure adjustments. Conducting carbon emission prediction research on Jiangsu Province—a region with a dense economy, population, and urbanization—can provide valuable insights for other areas, contributing to the early realization of the “dual carbon” target and holding significant practical importance [21,22]. The Kaya identity is widely applied as a mainstream method for analyzing factors affecting carbon emissions [23,24]. For example, Xianhong Qin et al. [25] applied the Kaya model to predict that the carbon emissions peak in Wuxi, a city in Jiangsu Province, would occur between 2025 and 2026, with a total emission equivalent of approximately 120-130 million tons. Based on these findings, they proposed relevant pathways for future reductions. Similarly, Shihua Zhu and Chi Zhang [26] used the AEM model to evaluate nearly 40 years of spatial and temporal carbon dynamics in Jiangsu Province, recommending that future studies focus on the impact of temperature and urban heat effects on carbon emissions in this region.
However, in terms of model selection, most existing studies use factors from models such as the Kaya model directly for analysis but often overlook the cross-influence between these factors. This oversight neglects the interactions and potential multicollinearity between variables, and lacks depth in the quantitative statistical analysis. This paper utilizes a penalized Lasso-Kaya model to predict carbon emissions in Jiangsu Province. During the prediction process, numerical fitting methods are employed to estimate each carbon emission factor, while deep learning models such as LSTM are used to further explore carbon emission data. Finally, by setting different scenario parameters, this study derives an optimized carbon emission pathway for Jiangsu Province, providing specific recommendations and strategies for its energy-saving and emission reduction policies.
3.Materials and Methods
3.1.Data Sources
The data used in this study is primarily based on the actual conditions of Jiangsu Province, covering the years 2010 to 2020. We selected data such as the total resident population, gross regional product (GRP), and total energy consumption for analysis. These data were sourced from the Jiangsu Statistical Yearbook (2011–2021), which are official statistics provided by governmental agencies, ensuring high authority and reliability.
In the analysis process, we carefully considered the reliability and accuracy of the data to ensure the precision and credibility of the research results. Numerous factors influence carbon emissions. For instance, a larger resident population implies greater energy consumption and carbon emissions; gross regional product indicates increased traffic volume, industrial expansion, and per capita consumption levels, all of which impact total energy consumption. Additionally, metrics such as carbon emissions per unit of energy consumption and carbon emissions per unit of GDP directly reflect the impact of energy efficiency and economic activities on sustainable development. To comprehensively and systematically analyze the primary factors affecting carbon emissions and seek a coordinated improvement in economic growth and energy utilization efficiency, a multidimensional approach is required.
3.2.Analysis Methods
3.2.1.Principle of the Kaya Model
To analyze the factors influencing carbon emissions and calculate the carbon peak, economists and scientists have developed numerous methods, such as the Environmental Kuznets Curve model, STIRPAT model, and Long-range Energy Alternatives Planning (LEAP) system. The Kaya identity is one of the mainstream methods currently used in such analyses. Although the Kaya identity is relatively simple, it has strong extensibility, provides decomposition without residuals, and effectively explains the driving factors behind changes in carbon emissions [27]. The formula is expressed as follows:
\( C=P(\frac{G}{P})(\frac{E}{G})(\frac{C}{E})=Pgec=G*\frac{C}{G}=G*h \)
Where:
C — Total carbon emissions; P — Total population; G — Total GDP; E — Total energy consumption; g — GDP per capita; e — Energy intensity, or the amount of energy consumed per unit of GDP; c — Carbon emission intensity, or the amount of carbon emissions per unit of energy consumed; h — Carbon intensity, or the amount of carbon emissions per unit of GDP. By taking the logarithm of both sides and applying a first-order partial derivative with respect to time, we obtain:
\( ln{C}={β_{1}}ln{P}+{β_{2}}ln{g}+{β_{3}}ln{e}+{β_{4}}ln{c} \)
In the formula,\( {β_{i}}(i=1,2,3,4) \)represents the elasticity coefficient, indicating the percentage change in\( {β_{i}}\%(i=1,2,3,4) \)of C resulting from a 1% change in P、g、e、c.
3.2.2.Penalized Lasso-Enhanced Kaya Model
Japanese scholar Yoichi Kaya [28] proposed the Kaya identity to describe the relationship between carbon emissions and factors such as the economy, policy, and population, along with the relevant calculation formula. However, neither Yoichi Kaya nor other scholars have provided a detailed explanation for selecting specific carbon emission factors within the Kaya model. A review of 127 studies on the Kaya model revealed no specific guidelines on factor selection; instead, scholars have generally used the model directly or in expanded form to calculate carbon emissions. To construct an objective and scientifically sound indicator system, this paper introduces the L1-norm penalized Lasso model, providing an interpretation of carbon emissions within the Kaya framework from a statistical perspective.
The Lasso algorithm is a linear model estimation method with a penalty term, aiming to constrain the absolute values of regression coefficients while minimizing the sum of squared residuals in the regression equation under given constraints [29]. The Lasso algorithm addresses multicollinearity among variables and provides the regression coefficients of output variables. Assuming the input independent variables and the dependent variable are\( {y_{i}},{x_{ij}},i=1,2...n,{j}=1,2...p \)
we consider the linear model:\( Y{=}βX{+}ε \),\( \)\( (\begin{matrix}{y_{1}} \\ ⋮ \\ {y_{n}} \\ \end{matrix})=(\begin{matrix}1 & {x_{11}} & ⋯ & {x_{1p}} \\ 1 & {x_{21}} & ⋯ & {x_{2p}} \\ ⋮ & ⋮ & & ⋮ \\ 1 & {x_{n1}} & ⋯ & {x_{np}} \\ \end{matrix}) \)
where n represents the sample size. This is achieved by minimizing the objective function:\( {\sum _{i=1}^{n}({y_{i}}-\sum _{j}{x_{ij}}{β_{j}})^{2}}+λ\sum _{j}|{β_{j}}| \)
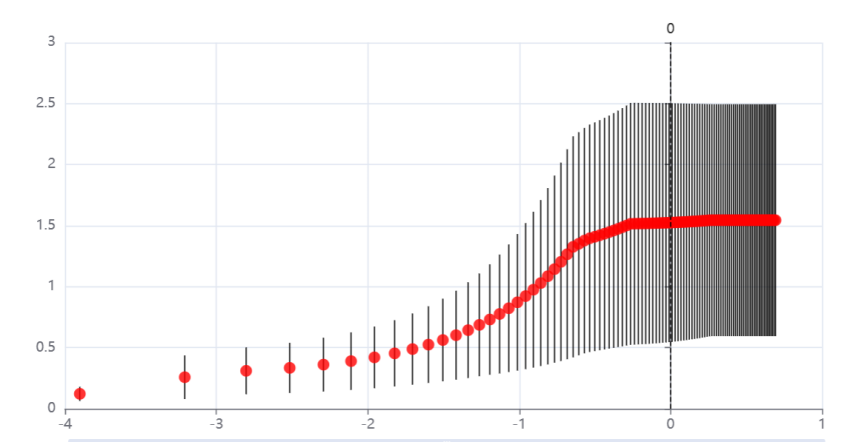
Figure 1. Cross-Validation Plot for Lasso Regression
The results obtained from the Lasso regression cross-validation plot indicate that all variable coefficients were selected as non-zero, meaning that the carbon emission factors included in the Kaya identity are strongly correlated with carbon emissions. This finding confirms that the carbon emission factors within the Kaya identity are both reasonable and effective, and they efficiently simplify the analysis.
4.Empirical Analysis of Carbon Emission Prediction
4.1.Fitting and Predicting Carbon Emissions – Penalized Lasso Kaya Model
We conducted a descriptive analysis of carbon emissions in Jiangsu Province, as shown in Figure 2. During the "12th Five-Year Plan," carbon emissions exhibited an overall growth trend. Although there was a slight reduction in 2014, the decrease was not substantial. In the "13th Five-Year Plan," the growth in carbon emissions became more pronounced, even showing a leap-like increase, with a slight decline only appearing in 2020.

Figure 2. Carbon Emissions in Jiangsu Province During the 12th and 13th Five-Year Plans
Simultaneously, after normalizing each carbon emission factor, we performed a line chart visualization analysis. As shown in Figure 3, from 2010 to 2020, while each carbon emission factor displayed fluctuations, the overall trend remained upward.

Figure 3. Normalized Trend Distribution of Carbon Emission Factors in Jiangsu Province
Observing the data itself, the collected data is panel data, featuring both time series and cross-sectional data characteristics, making it well-suited for numerical fitting analysis.
Numerical fitting is a method used to predict future data by analyzing and modeling existing data. Through numerical fitting, we can visually observe trends and patterns in the data and further uncover relationships and patterns behind the data. This method is commonly applied in economics and scientific fields, helping us better understand phenomena and predict future trends.
In the Kaya model, numerical fitting enables us to determine the relationships among various factors, providing more accurate predictions of energy consumption and economic growth. By fitting the existing data, we can find the most suitable parameters and models to more precisely forecast future energy consumption and economic growth.
Additionally, numerical fitting allows us to verify the accuracy and applicability of the Kaya model. By fitting existing data, we can assess the model's alignment with real-world data and evaluate its credibility for future prediction and assessment.
The numerical fitting results obtained through Python are as follows:
Table 1. Numerical Fitting Estimation Results
|
Variable |
Coefficient |
Standard Error |
T-Statistic |
sig |
|
\( ln{P} \) |
10.159 |
3.814 |
2.664 |
0.029 |
|
\( ln{g} \) |
0.0246 |
0.047 |
0.521 |
0.016 |
|
\( ln{e} \) |
0.0327 |
0.001 |
39.526 |
0.000 |
|
\( ln{c} \) |
3.63e+04 |
52.771 |
92.347 |
0.000 |
|
const |
5.661*104 |
2.86E+04 |
-1.98 |
0.083 |
Note: R2=0.94,F value=62.14,sig F=0.000
Based on the numerical fitting results, the coefficient of determination R2 is 0.94, the F value is 62.14, and sig F is 0.000, indicating a significant fitting effect. The coefficients show that total population, economic development level, energy consumption intensity, and carbon emission intensity of energy are all driving factors of carbon emissions growth in Jiangsu Province. Among these, population size has the greatest impact: a 1% increase in population results in a 10.16% increase in carbon emissions in Jiangsu Province. Following this, a 1% increase in energy consumption intensity raises carbon emissions by 3.27%, and a 1% increase in economic development level increases carbon emissions by 2.46%.
|
|
|
|
|
|
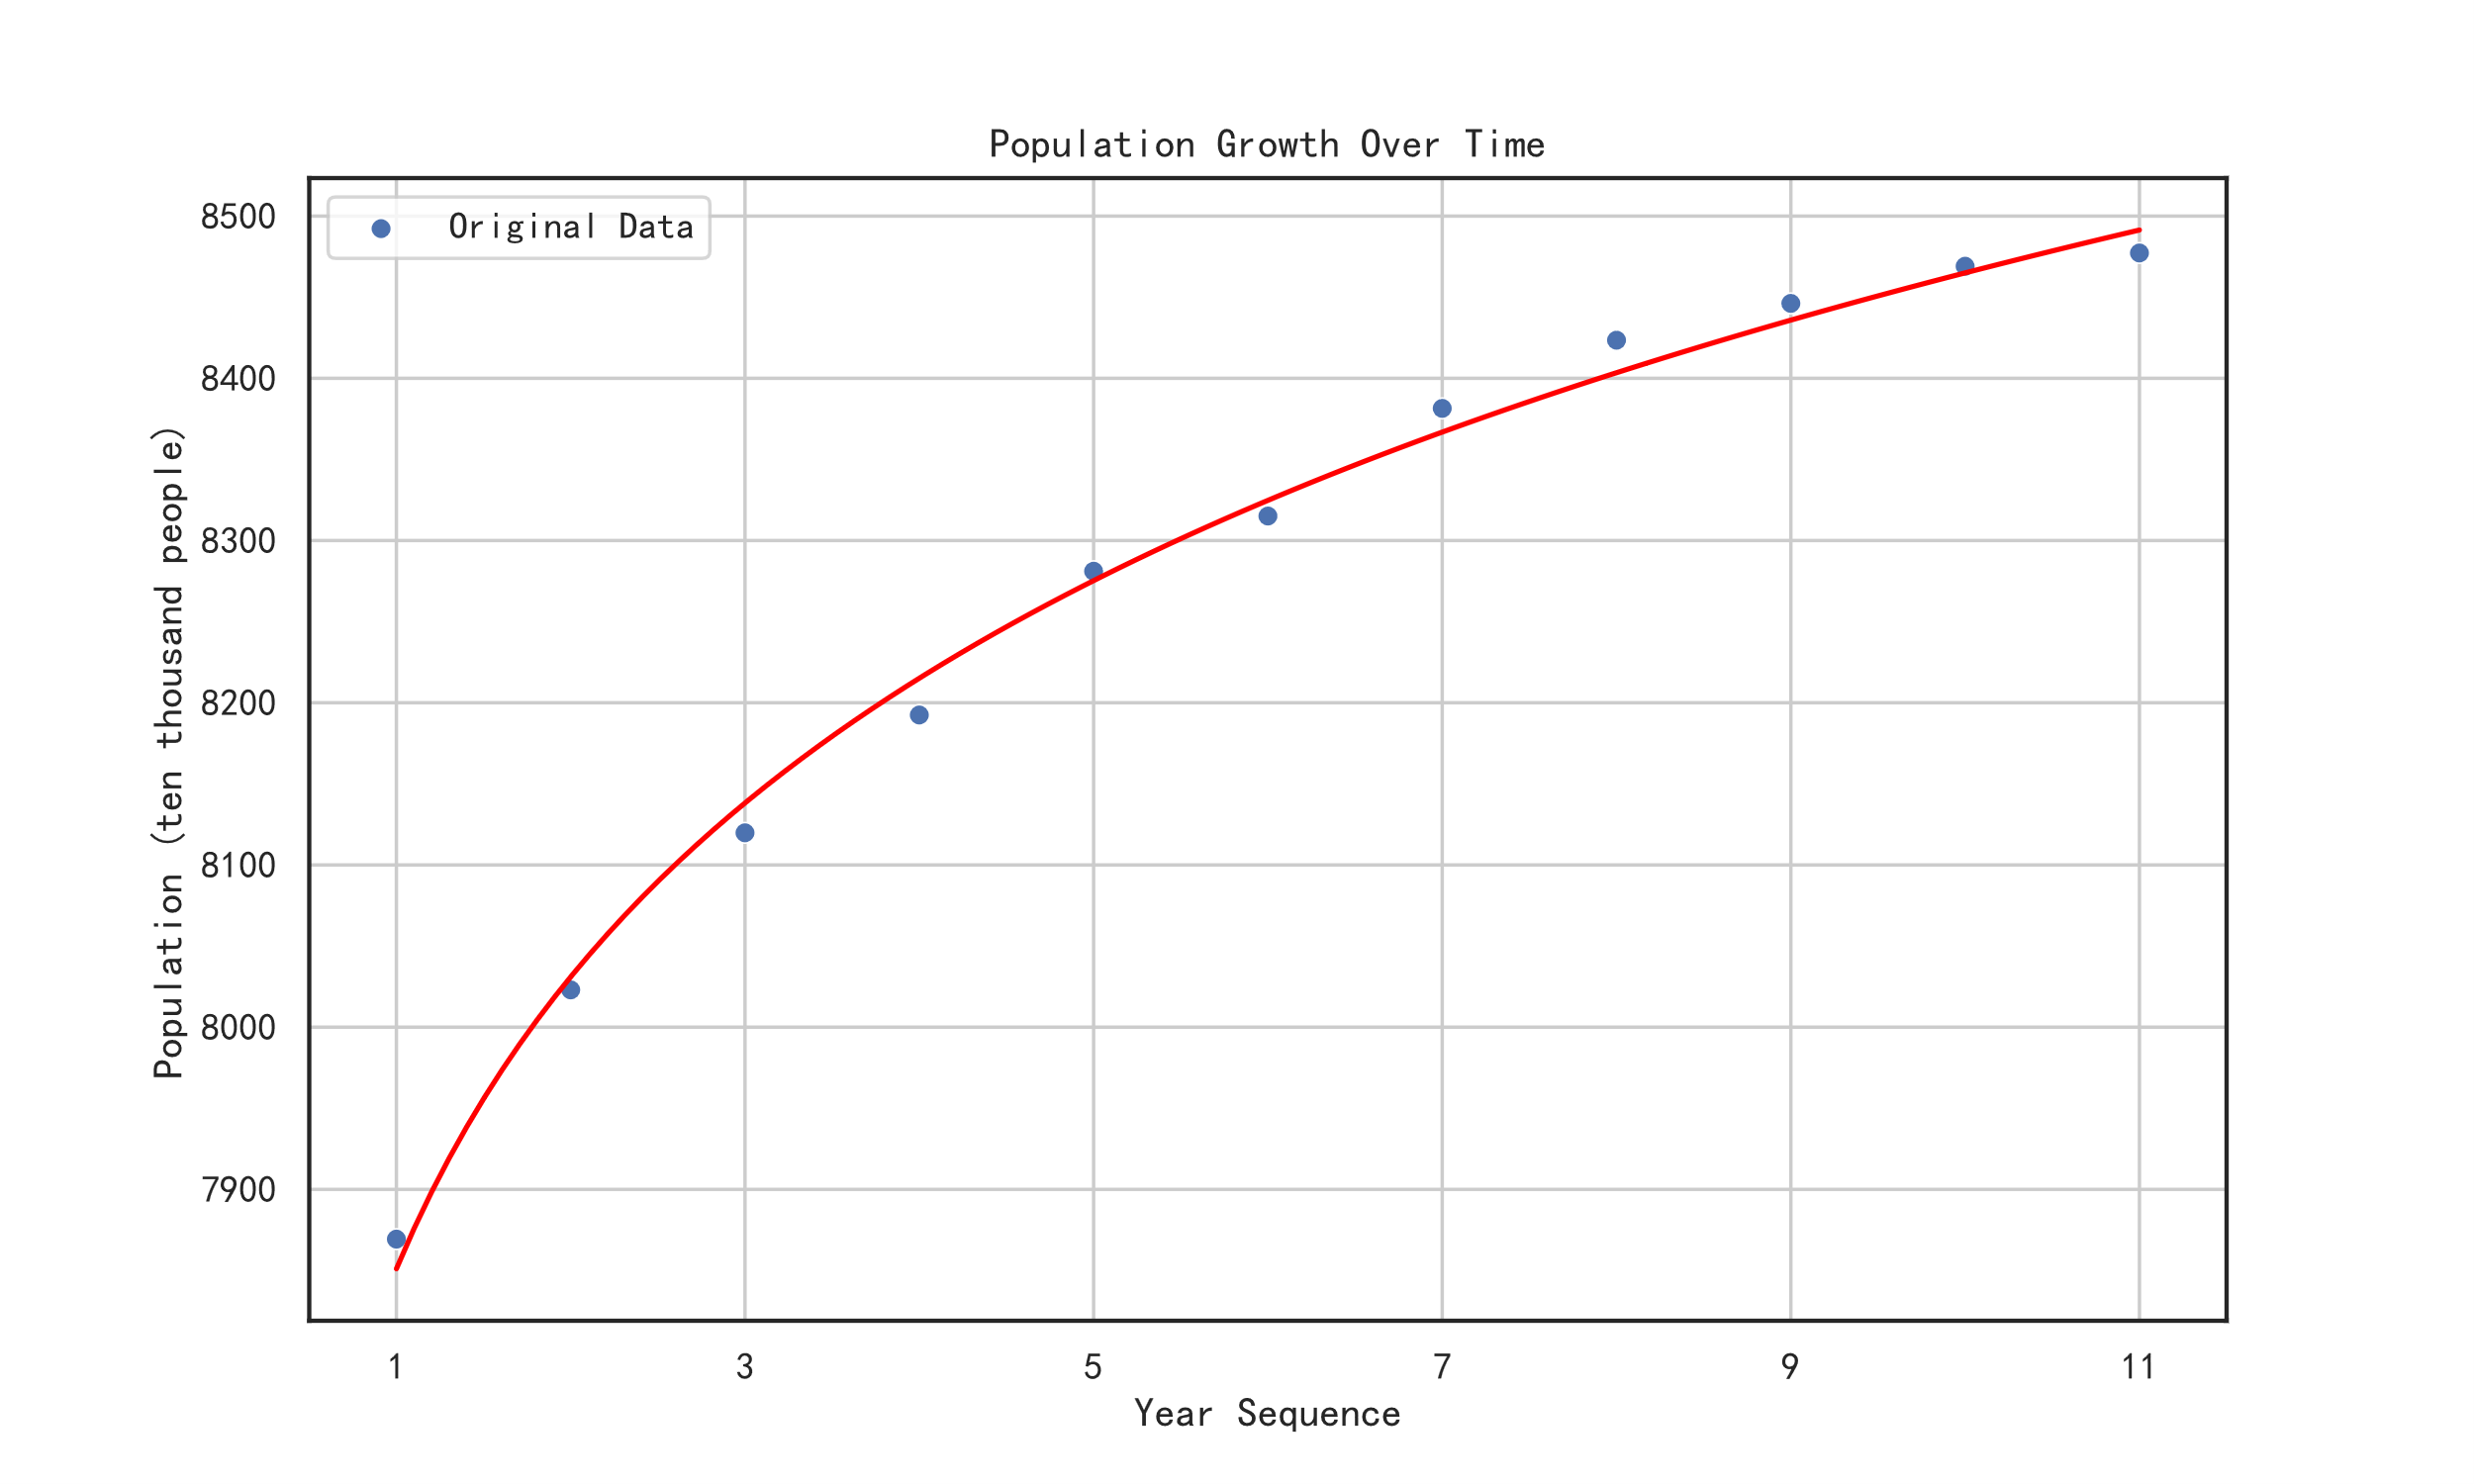
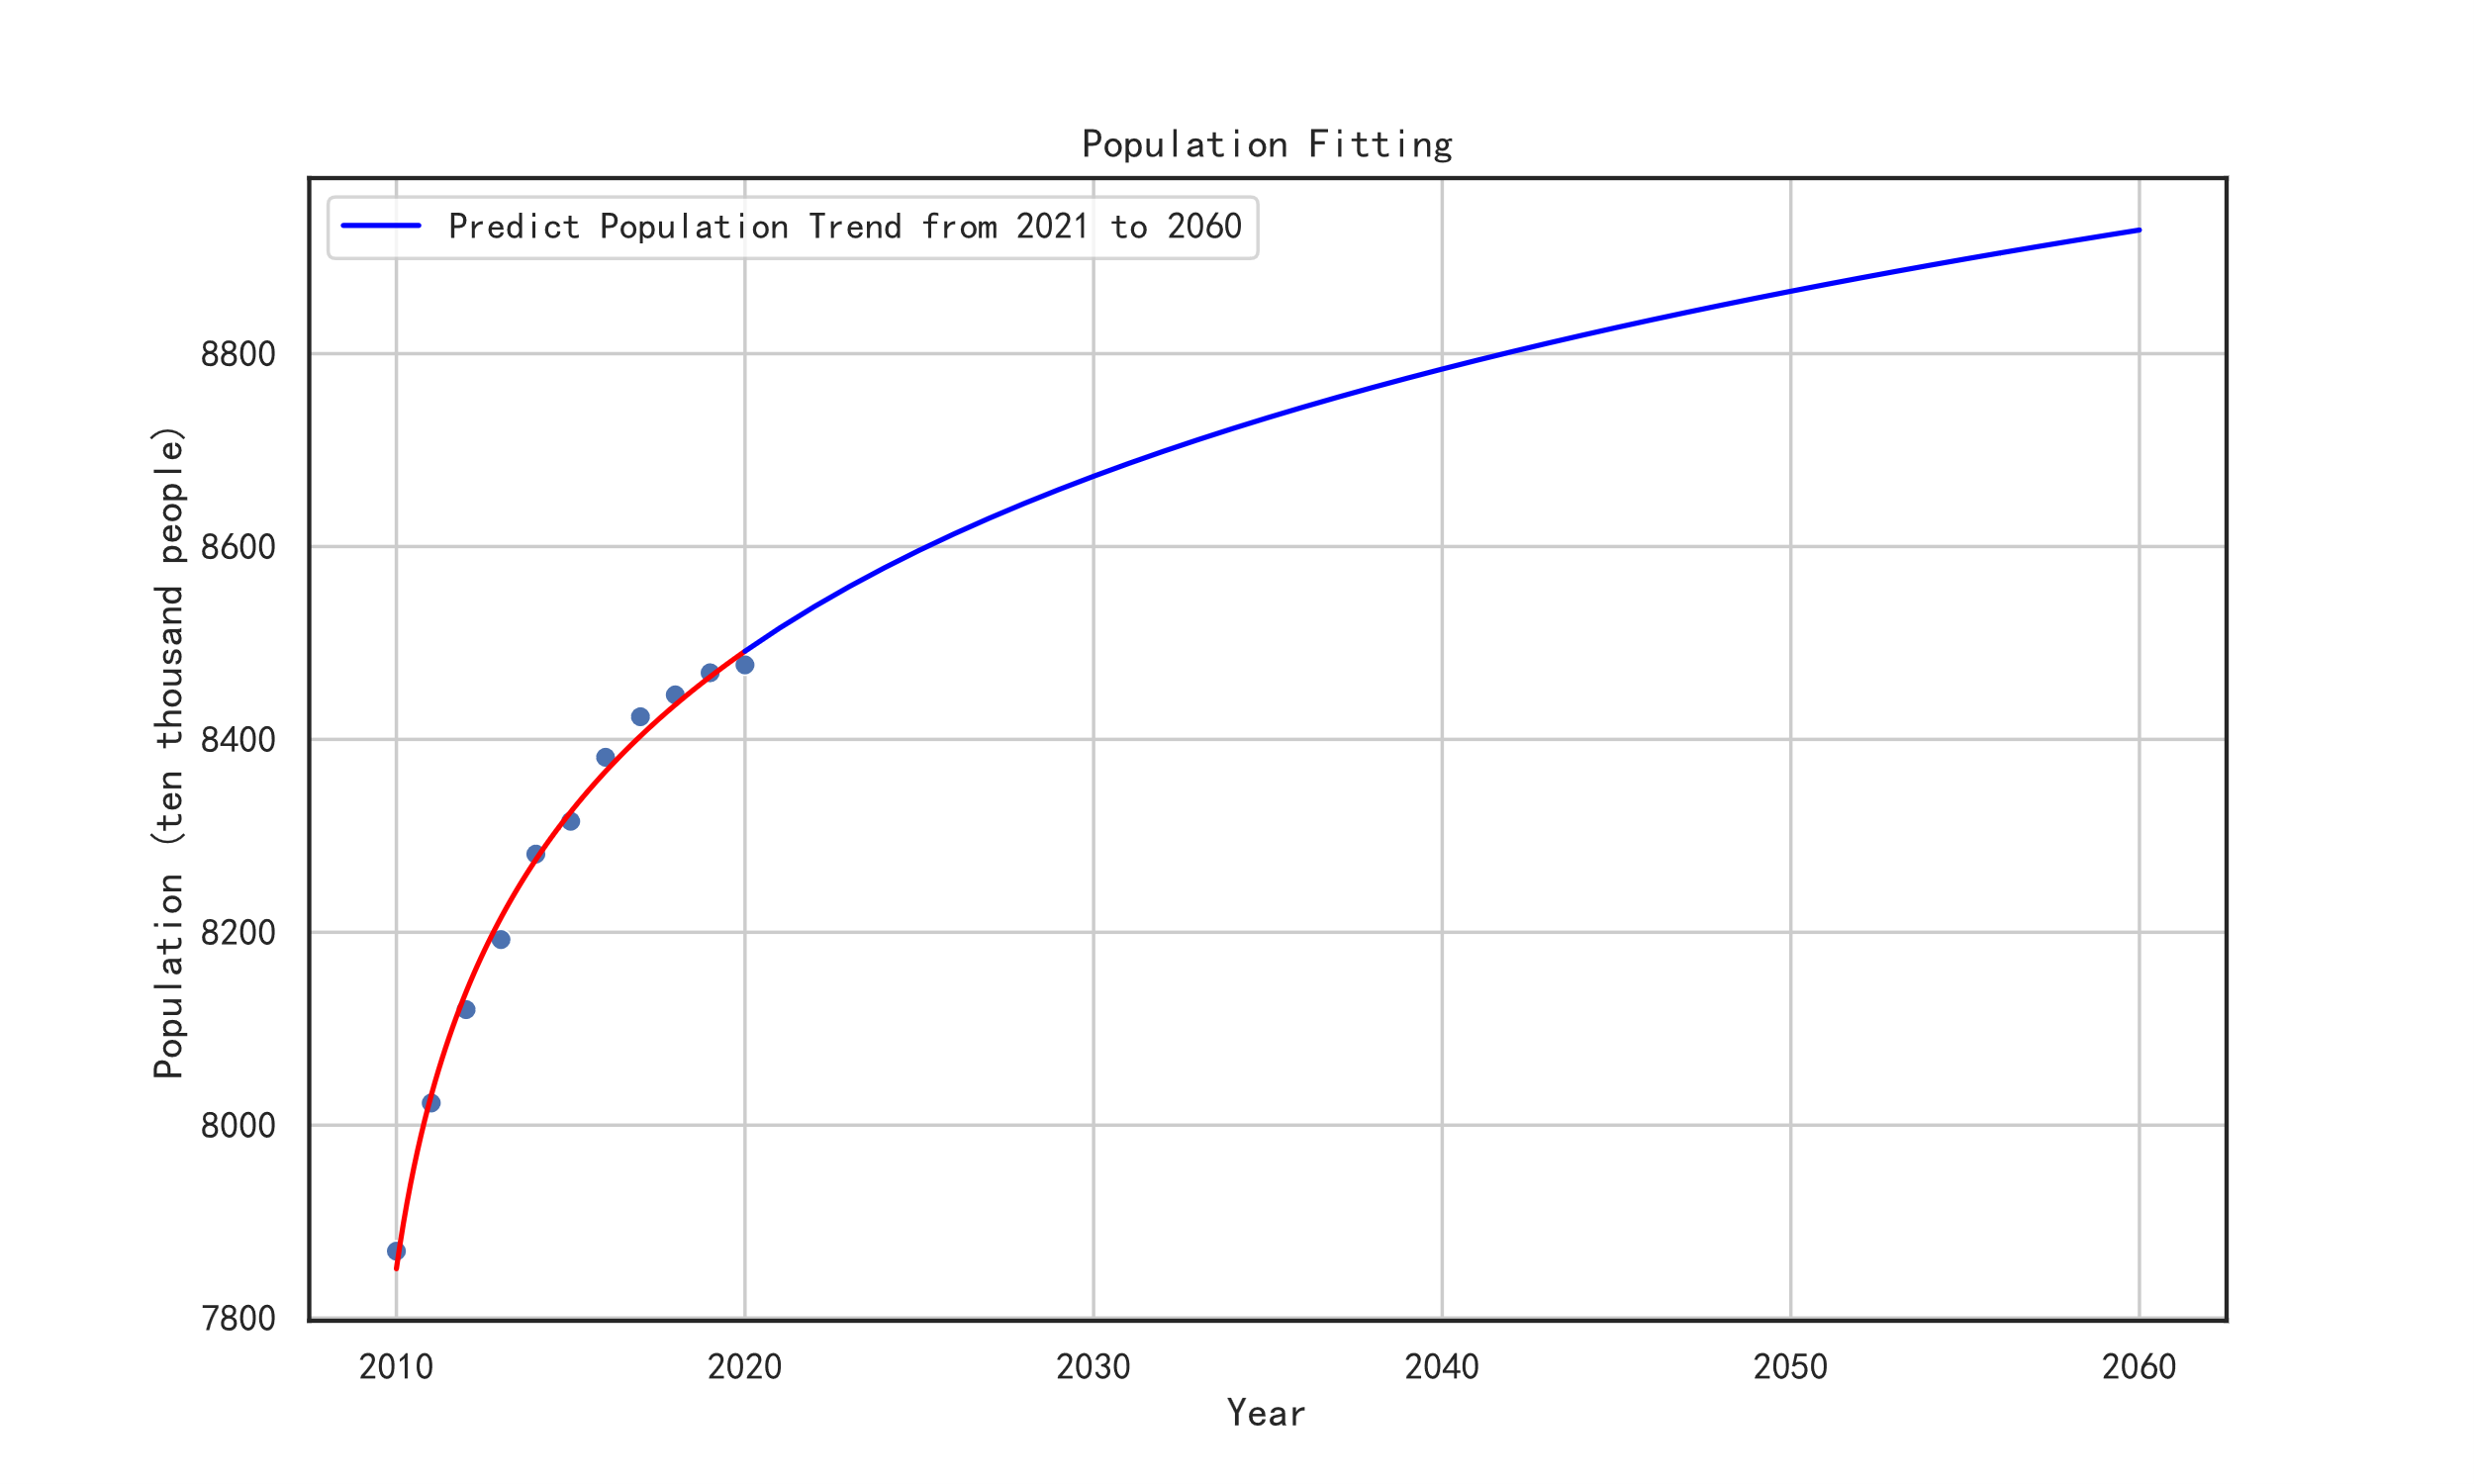
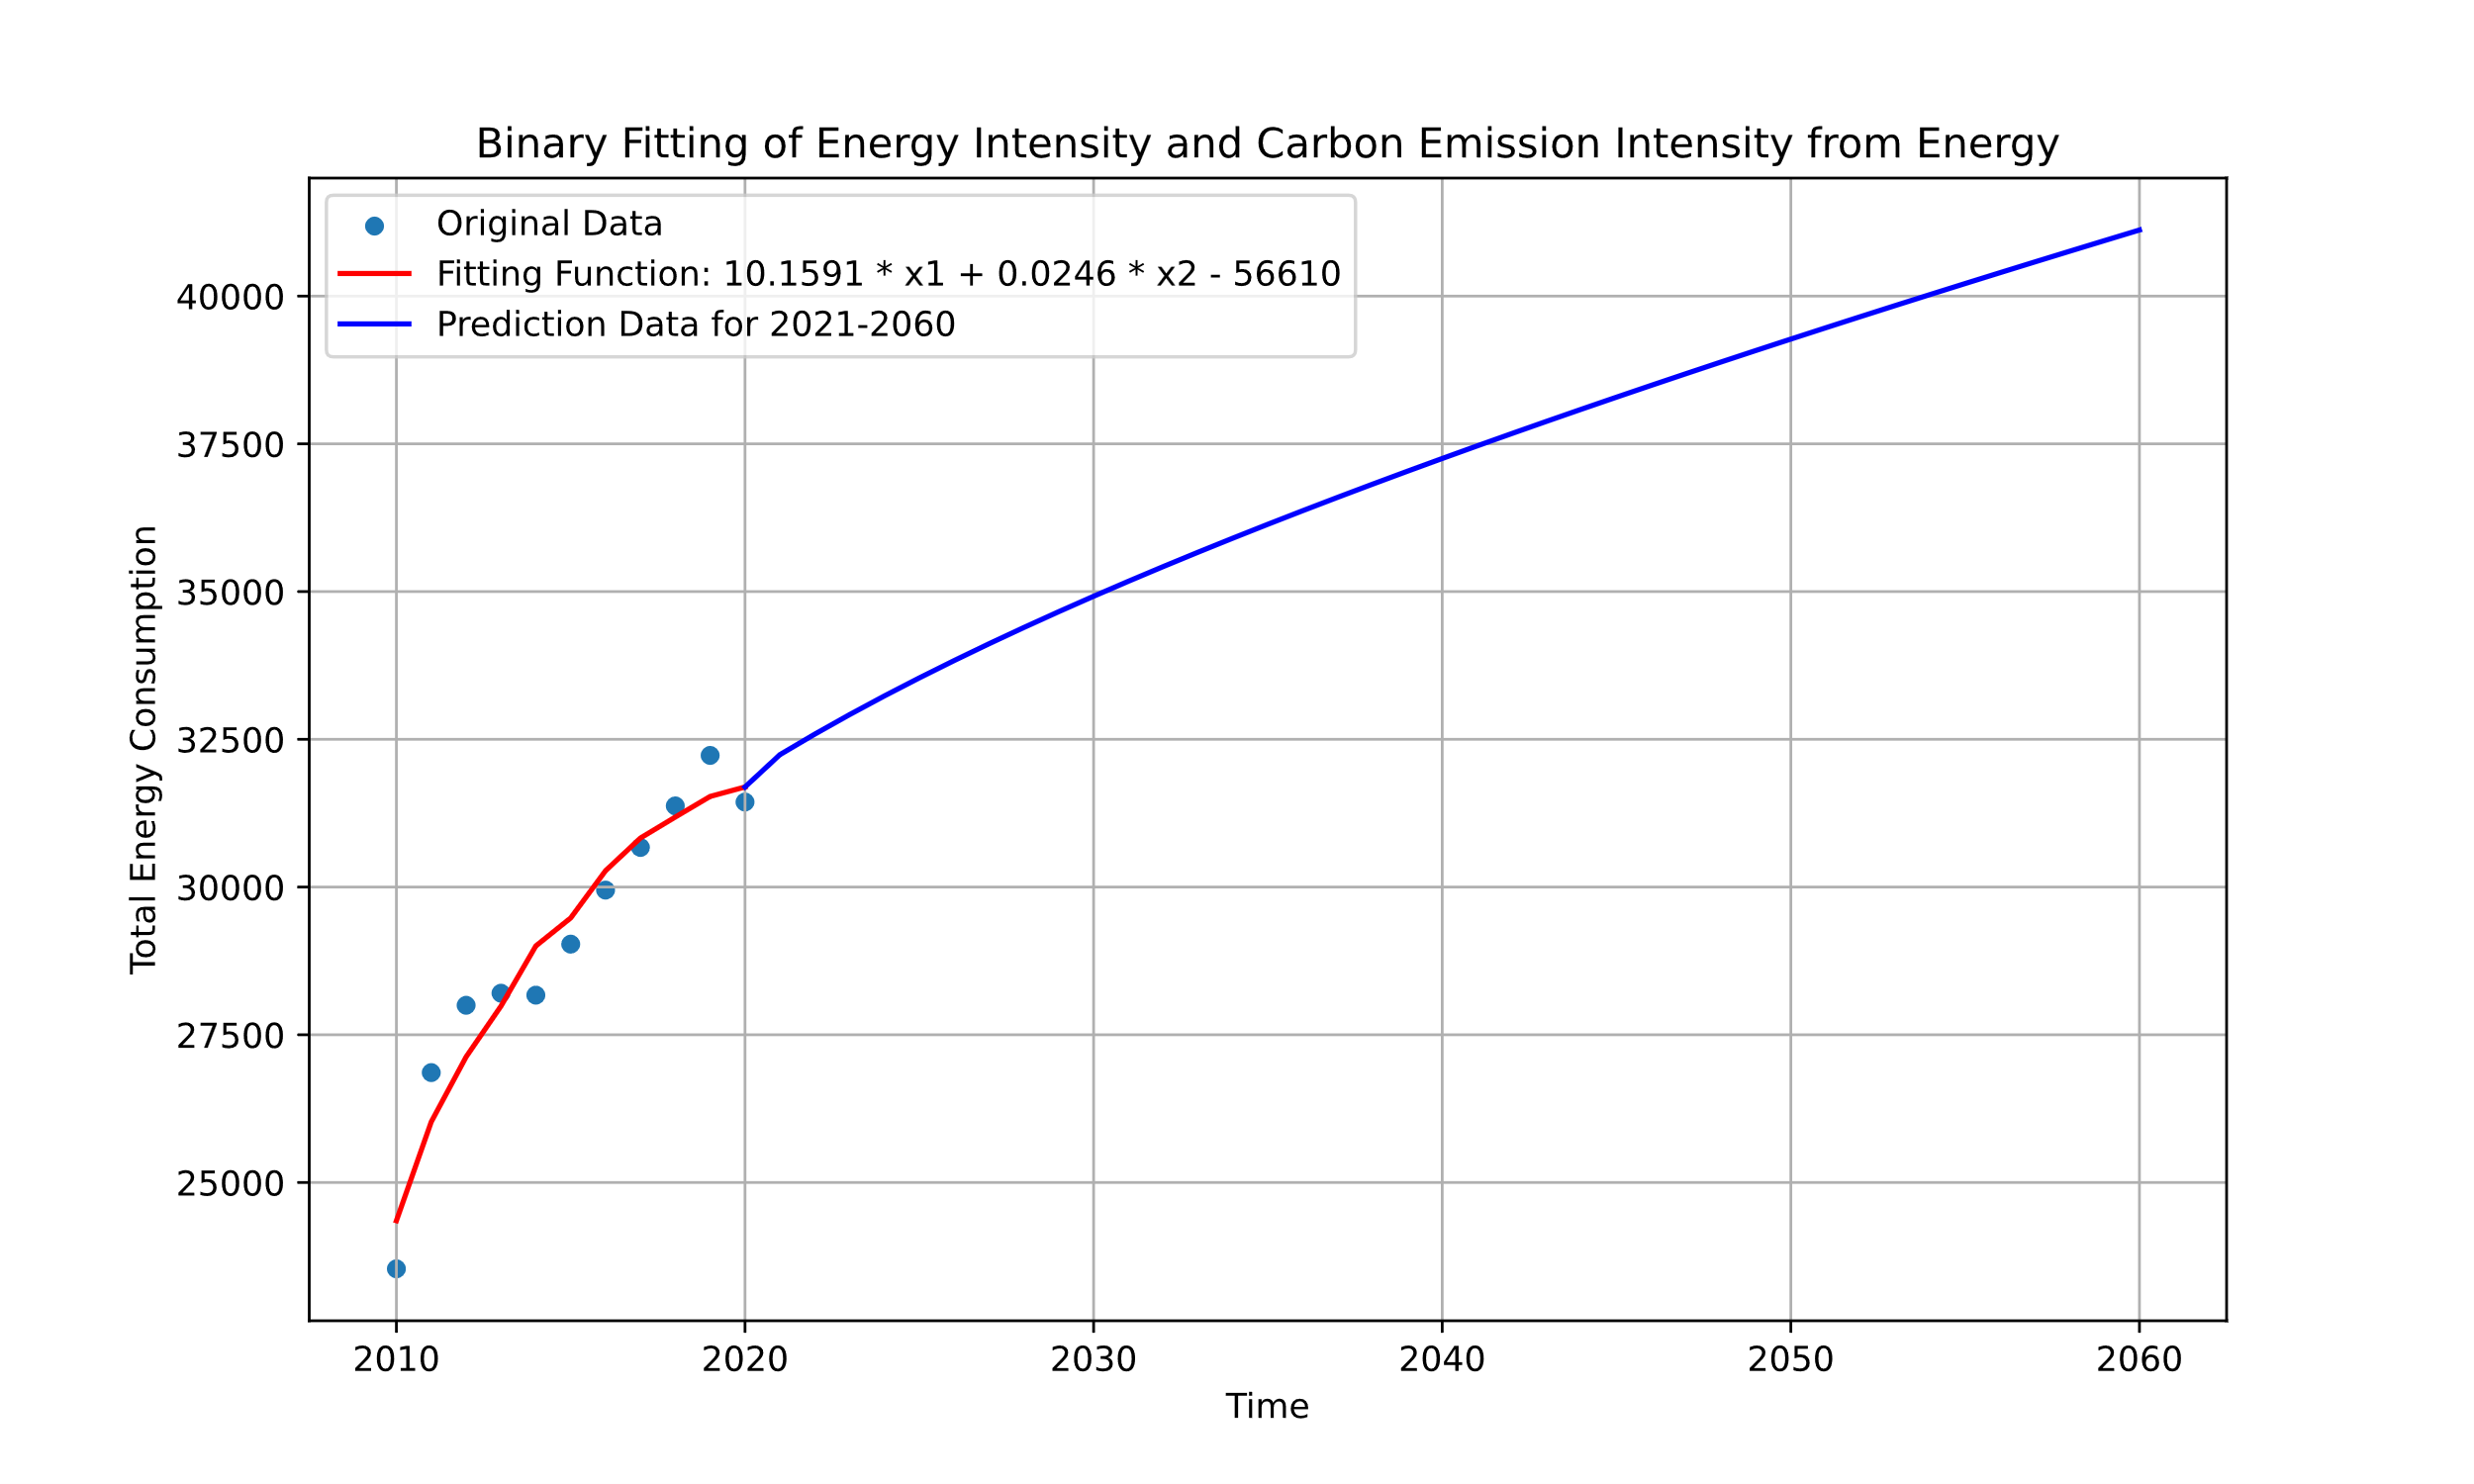
Figure 4. Numerical Fitting Curve of Carbon Emission Factors
4.2.Limitations of the LSTM Model
While numerical fitting offers high goodness of fit, simplicity, intuitiveness, and efficiency, it falls short in addressing nonlinear issues in carbon emission prediction, especially those involving interactions between variables. Based on this limitation, this study attempts to introduce an LSTM (Long Short-Term Memory) regression neural network to explore data prediction.
LSTM is a deep learning model well-suited for time series data analysis. Compared to traditional numerical fitting methods, LSTM captures complex nonlinear relationships and temporal features within time series data more effectively. By incorporating memory cells and gating mechanisms, it efficiently manages long-term dependencies and forgetting processes, giving LSTM an advantage in handling complex variable interactions and forecasting time series trends.
For carbon emission prediction, training the LSTM model on time series data allows it to learn the relationships between past data points and future carbon emission levels. Through LSTM’s memory and gating mechanisms, the model accumulates and utilizes information from past time points, leading to more accurate forecasts of future carbon emissions.
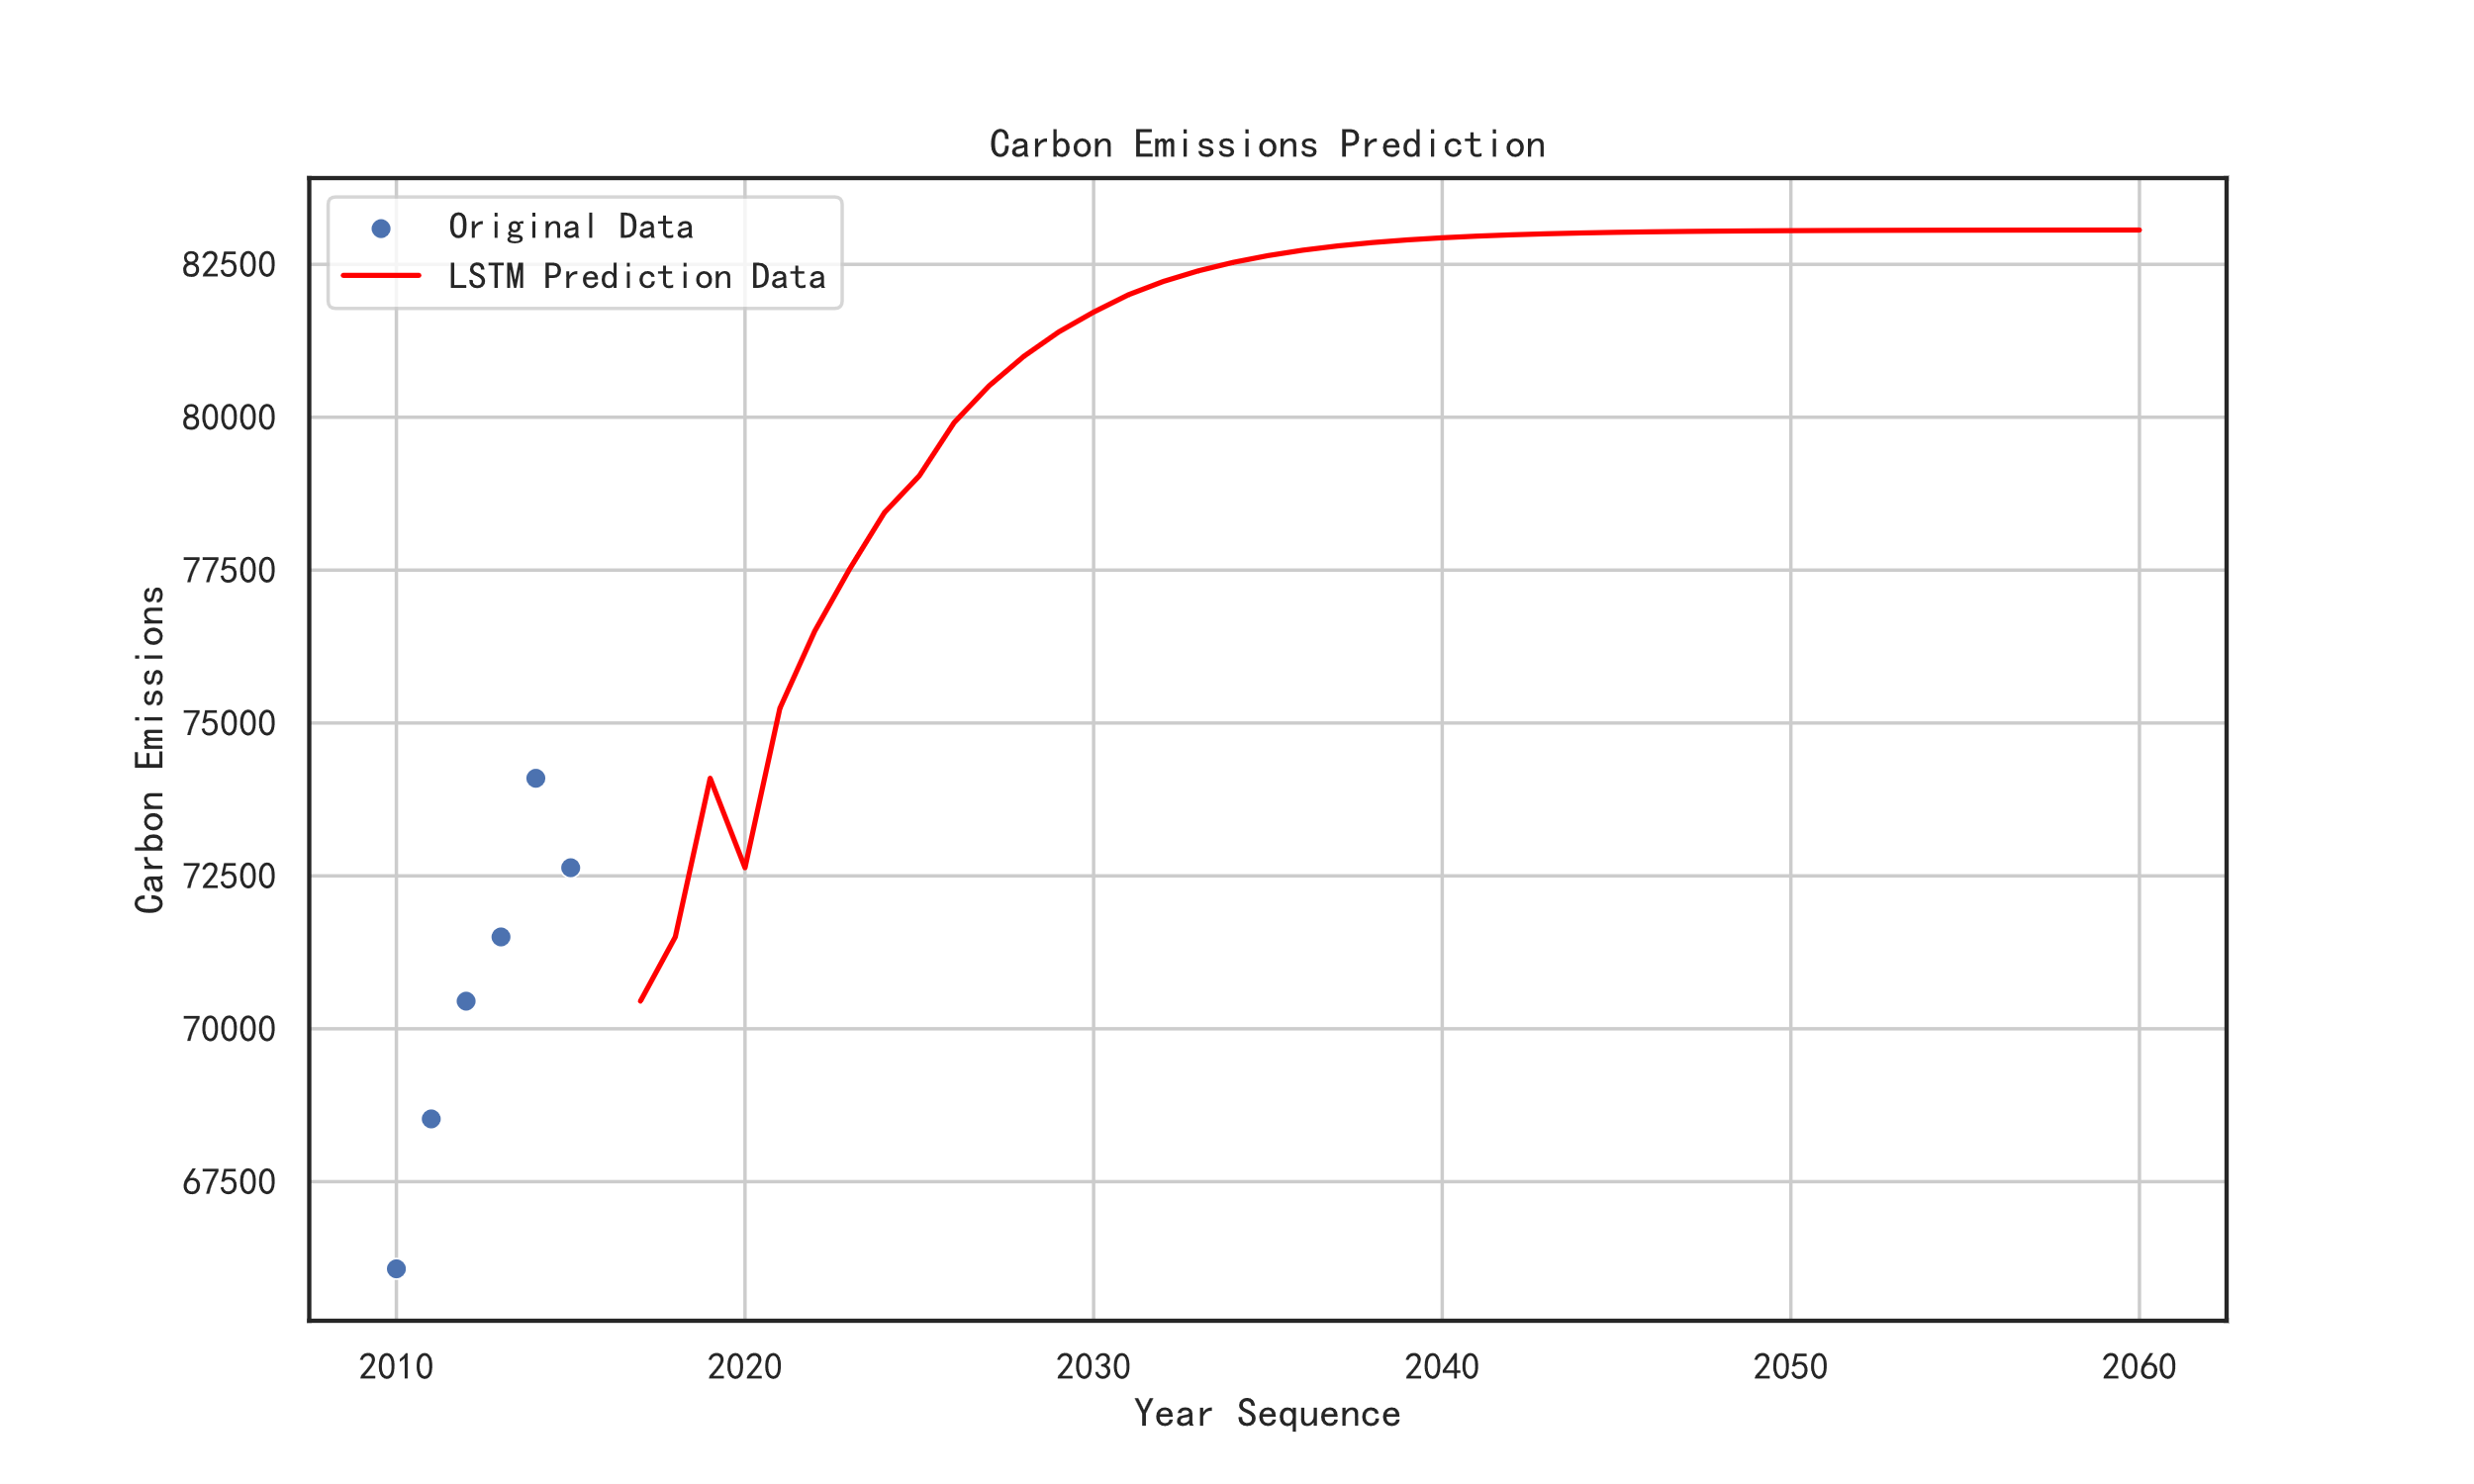
Figure 5. LSTM Prediction of Carbon Emissions in Jiangsu Province from 2021 to 2060
By implementing the LSTM in Python for carbon emission prediction, we observed that the results indicated a small peak in carbon emissions around 2018, and a general stabilization of emissions after 2035. However, this prediction often does not align with the actual changes in carbon emissions, suggesting that the deep learning LSTM model may not be suitable for carbon emission prediction and environmental climate governance. Compared to complex deep learning models, research and forecasting of carbon emissions are better suited to traditional statistical numerical fitting methods, which more accurately capture trends and patterns in carbon emissions, providing more reliable predictive support for environmental climate governance.
In carbon emission prediction, key influencing factors play a critical role. Through comparison, it is evident that LSTM has limitations in carbon emission forecasting, while the penalized Lasso-enhanced Kaya model provides predictions that align more closely with actual conditions.
5.Results and Discussion
5.1.Scenario Description
Scenario simulation involves forecasting the future development of key influencing factors for carbon emissions. Considering the current instability in the international political and economic environment, challenges in global climate governance, and weak economic recovery in the post-pandemic era, it is essential to promote rapid economic growth to mitigate financial and social risks [30].
5.1.1.Scenario Setting
In this study, using 2020 as the baseline year, we assume continued economic growth and forecast Jiangsu Province’s carbon emission trends for 2060 by adjusting parameters such as energy consumption intensity, energy structure, and carbon emission intensity of energy. We focus on three scenarios: the baseline scenario, the low-growth scenario, and the high-growth scenario. Through scenario simulation analysis, we can gain a better understanding of the trends in carbon emissions under different conditions, thereby providing a scientific basis for developing carbon emission control measures.
In the natural scenario, it is assumed that no emission reduction measures are implemented in Jiangsu Province, and future energy consumption remains predominantly based on fossil fuels such as coal. The carbon emission trend in the natural scenario serves as a reference for the other parameter-defined scenarios, mainly considering the developmental trajectory based on current policies and technological levels.
In the steady scenario, we advocate promoting "energy conservation and emission reduction" primarily through energy-saving technologies while balancing economic pressures by reducing the demands for rapid technological innovation in energy conservation. In practice, the development and commercialization of technology often require long cycles and substantial funding. Accelerating the innovation, promotion, and application of energy-saving technologies requires strong policy support from the government and relevant institutions, including significant investments of human, material, and financial resources. Given the current challenges China faces, such as external uncertainties, financial risks, and debt issues, massive investments in energy-saving technology are unrealistic. Therefore, in this scenario, we assume that energy-saving technology for carbon emission reduction will see a moderate annual increase.
In the ambitious scenario, particular emphasis is placed on Jiangsu Province’s energy consumption and carbon emission challenges. Policy measures are designed to aggressively promote energy conservation and emission reduction, driven by the goal of achieving the “dual carbon target” within a short time frame to foster low-carbon economic development. As one of the world’s largest carbon emitters, China faces immense pressure to reduce energy consumption and lower carbon emissions. In this scenario, achieving the “dual carbon target” within a short period serves as the primary motivation, aiming to stabilize emissions of CO₂ and other greenhouse gases through energy-saving and emission-reducing actions. Consequently, in this scenario, we assume that carbon emissions reduction technology is in a state of rapid increase.
5.1.2.Parameter Simulation
Based on policy documents issued by the Jiangsu Provincial Government, including the Implementation Opinions on Promoting High-Quality Development for Carbon Peaking and Carbon Neutrality (2022), 14th Five-Year Plan for Renewable Energy Development (2022), and Implementation Opinions on Accelerating the Establishment of a Green, Low-Carbon, Circular Economic System (2022), Jiangsu has set the following goals for "energy conservation and emission reduction": Efforts will be made to reduce energy carbon emission intensity per unit of GDP, with the aim of reducing this intensity by 30% from 2015 levels by 2030. By 2025, non-fossil fuels are to account for over 20% of primary energy consumption, with a gradual increase towards 2030 to ensure the share of non-fossil fuels in primary energy consumption continues to rise. By 2025, energy consumption per unit of GDP is expected to decrease by more than 18%, with further improvements by 2030. In alignment with these government planning goals, this study sets parameters for three indicators: energy carbon emission intensity, non-fossil energy structure, and energy consumption intensity.
Energy Carbon Emission Intensity: In the steady scenario, the growth rate is reduced by 1% per five-year cycle until it reaches a stable rate post-carbon peak. In the ambitious scenario, the initial reduction rate is set at 3% per five-year cycle, subsequently decreasing by 1% each cycle until it stabilizes post-carbon peak.
Non-Fossil Energy Structure: In the steady scenario, the growth rate starts at 1% and increases by 1% each five-year cycle until it reaches 5%. Thereafter, it transitions to a ten-year cycle with a growth rate increase of 2%. In the ambitious scenario, the growth rate begins at 3% per five-year cycle, with an increase of 1% per cycle until it stabilizes post-carbon peak.
Energy Consumption Intensity: In both the steady and ambitious scenarios, the growth rate is adjusted in five-year cycles. Initially set at 2%, it increases by 1% each cycle until reaching 4%, after which it stabilizes at a growth rate of 3%.
By constructing different economic and social development scenarios, distinct carbon reduction targets for Jiangsu Province (baseline, steady, and ambitious) are clarified, and key factor parameters for each scenario are simulated. Detailed parameters for each scenario are presented in Table 2 below.
Table 2. Variable Growth Rate Settings
|
Indicator |
Scenario 1 (Baseline Scenario) |
Scenario 2 (Steady Scenario) |
Scenario 3 (Ambitious Scenario) |
|
Energy Carbon Emission Intensity |
Follows data trend |
Average annual reduction rate of 1% from 2021-2025 |
Average annual reduction rate of 3% from 2021-2025 |
|
Average annual reduction rate of 2% from 2026-2030 |
Average annual reduction rate of 4% from 2026-2060 |
||
|
Average annual reduction rate of 3% from 2031-2060 |
|||
|
Non-Fossil Energy Structure |
Follows data trend |
Average annual growth rate of 2% from 2021-2025 |
2021-2030 Average annual growth rate of 3% |
|
Average annual growth rate of 3% from 2026-2030 |
|||
|
Average annual growth rate of 4% from 2031-2035 |
Average annual growth rate of 4% from 2031-2060 |
||
|
Average annual growth rate of 5% from 2036-2040 |
|||
|
Average annual growth rate of 7% from 2041-2060 |
|||
|
Energy Consumption Intensity |
Follows data trend |
Average annual growth rate of 2% from 2021-2025 |
Average annual growth rate of 2% from 2021-2025 |
|
Average annual growth rate of 3% from 2026-2030 |
Average annual growth rate of 3% from 2026-2030 |
||
|
Average annual growth rate of 4% from 2031-2035 |
Average annual growth rate of 4% from 2031-2035 |
||
|
Average annual growth rate of 3% from 2036-2060 |
Average annual growth rate of 3% from 2036-2060 |
5.2.Secondary Carbon Emission Prediction
The parameter settings for the scenarios designed above enable predictions of Jiangsu Province’s carbon emissions under different scenario pathways. The prediction results are shown in Table 3 below:
Table 3. Carbon Emission Predictions for Jiangsu Province
|
Carbon Emission Pathway |
Carbon Peak Year |
Carbon Emission Peak (10,000 tce) |
Carbon Emission in 2060 (10,000 tce) |
|
Baseline Scenario |
2060 |
95805.7 |
95805.7 |
|
Steady Scenario |
2030 |
88256.1 |
51670.52 |
|
Ambition Scenario |
2028 |
91207.94 |
35746.59 |
The results in the table indicate that the ambitious scenario achieves the “carbon peak” target earliest, by 2028, followed by the steady scenario, which achieves carbon peaking in 2030. The baseline scenario, following the data trend, is expected to reach the carbon peak by 2060.

Figure 6. Predicted Carbon Emission Results for Jiangsu Province from 2020 to 2060
Based on a comprehensive comparative analysis of the different scenario settings and considerations for the “carbon peak” timeline, this study concludes that the steady scenario is the optimal pathway for achieving “carbon reduction.” In the steady scenario, the advancement rate of energy-saving technology is moderate, achieving energy-saving effects while keeping economic costs relatively low. Compared to the ambitious scenario, the “carbon peak” timeline is delayed by only two years, and in terms of low-carbon efficiency, there is virtually no difference between the two scenarios. From an economic cost perspective, the steady scenario is the most efficient pathway for achieving “carbon reduction.”
To ensure continued economic growth in Jiangsu Province while achieving the “dual carbon” targets, the following constraints must be met: the share of non-fossil energy in the energy structure should increase by 3% by 2030, with annual fluctuations kept within 2%; the carbon emissions per unit of energy consumption should decrease by 3% by 2030, with an annual average reduction rate between 1.5% and 3%; and the growth rate of energy consumption per unit of GDP should not exceed 4%.
This study conducted parameter adjustments for three key indicators—energy carbon emission intensity, non-fossil energy structure, and energy consumption intensity—ultimately defining three specific scenarios (baseline, low-growth, and high-growth). Assuming continuous economic growth from a 2020 baseline, a secondary carbon emission prediction was conducted using the penalized Lasso-enhanced Kaya model, concluding that the steady scenario is the optimal path for achieving “carbon reduction.”
From a statistical perspective, this study innovatively extends the Kaya model using a Lasso-penalized approach, addressing limitations in the traditional model to better reflect real-world problems. By quantifying carbon emissions based on four key factors, the study further expands the practical application of the model.
However, this study has certain limitations. Expanding the model’s applicability for carbon emission prediction remains a direction for future research. Additionally, further analysis is needed on the influence of other factors in the scenario pathways and the internal mechanisms behind parameter adjustments.
6.Conclusion
Using a Lasso-enhanced Kaya model and scenario analysis, this study conducted a simulation analysis of the “carbon reduction” pathway for Jiangsu Province. Based on the results, the following recommendations are provided for Jiangsu’s “carbon peaking” pathway:
1. Increase the Share of Non-Fossil Energy Consumption and Optimize the Energy Structure. This is a critical step for Jiangsu in achieving the “dual carbon” targets. Currently, the industrial energy consumption in Jiangsu relies heavily on coal, which has a high carbon content. Reducing coal dependency is essential. To ensure energy security while lowering coal reliance, Jiangsu could explore the development of a new power system and enhance the application of clean energy in the industrial sector.
2. Reducing Energy Carbon Emission Intensity Remains a Key Focus for Jiangsu’s “Dual Carbon” Efforts. From a carbon sink perspective, Jiangsu faces challenges such as environmental degradation, energy-intensive industries, and high-carbon transportation. To reduce carbon emission intensity, Jiangsu’s efforts should focus on developing low-carbon and smart transportation systems, promoting the application of carbon capture, utilization, and storage (CCUS) technology, and strengthening natural ecological protection.
3. Energy Consumption Intensity Constraint is Key to Jiangsu’s “Dual Carbon” Target. Currently, there are still significant gaps in the regulatory oversight and enforcement strength in environmental governance in Jiangsu, which may lead to non-compliance or even violations by some enterprises or individuals. Additionally, Jiangsu lacks an effective incentive and penalty mechanism for “energy conservation and emission reduction,” resulting in insufficient motivation for companies to adopt energy-saving measures. To address this, the Jiangsu government could collaborate with industry associations, enterprises, and the public to establish a multi-stakeholder governance system for environmental and climate management. The government can work actively with all parties to formulate environmental governance laws, regulations, and practical guidelines that clarify responsibilities and rights, improving the scientific and precise nature of oversight. Additionally, enhancing information disclosure and public participation would increase transparency and fairness in governance.
Authors’ Contributions
Tingting Tian and Fuquan Qiu: Conceptualization, Methodology, Data curation, Writing- Original draft preparation, Visualization, Investigation.
Acknowledgements
This work was supported by "Research on Accurate Identification and Early Warning of 'Students with Learning Difficulties' in Universities Based on Machine Learning Algorithm" (GD20XIY20), college student innovation project of Guangdong Ocean University "Research on Accurate Identification and Learning Early Warning Model of" Students with Learning Difficulties "in colleges and Universities from the perspective of Educational Big Data" (S202310566090).
References
[1]. Nawaz, M. A., Hussain, M. S., Kamran, H. W., et al. (2021). Trilemma association of energy consumption, carbon emission, and economic growth of BRICS and OECD regions: Quantile regression estimation. Environmental Science and Pollution Research, 28(13), 1–15.
[2]. Wang, K., Wu, M., Sun, Y., et al. (2019). Resource abundance, industrial structure, and regional carbon emissions efficiency in China. Resources Policy, 60, 203–214.
[3]. Project Comprehensive Report Writing Group. (2020). Comprehensive report on China’s long-term low-carbon development strategy and transition pathway. China Population, Resources and Environment, 30(11), 1–25.
[4]. Wang, X., Zheng, F., Xu, Y., et al. (2023). Carbon peak prediction in Ningxia under the dual carbon target background. China Environmental Science, 43(S1), 347–356. https://doi.org/10.19674/j.cnki.issn1000-6923.2023.0253
[5]. Zhang, L., & Pan, J. (2021). Prediction of regional carbon peak in China and research on strategies for achieving the “dual carbon” target. China Energy, 43(07), 54–62+80.
[6]. The spatiotemporal patterns and climate impacts of the carbon dynamics in economically developed areas of China during the past 40 years: A case of Jiangsu Province. (2024). Journal of Cleaner Production, 435, Article 140567. https://doi.org/10.1016/j.jclepro.2024.140567
[7]. He, J. (2021). Low-carbon transition of energy and economy under the carbon peaking and carbon neutrality targets. Journal of Environmental Economics, 6(01), 1–9. https://doi.org/10.19511/j.cnki.jee.2021.01.001
[8]. Wang, W., Liu, J., & Zhao, Y. (2022). Carbon neutrality and China’s future. Beijing Normal University Press.
[9]. Project Comprehensive Report Writing Group. (2020). Comprehensive report on China’s long-term low-carbon development strategy and transition pathway. China Population, Resources and Environment, 30(11), 1–25.
[10]. Liu, Y., Ding, S., & Wang, H. (2022). Analysis of regional green development policy efficiency under the “dual carbon” goal: A case study of Qaidam Basin. Special Economic Zone Economy, (08), 62–65.
[11]. Ma, Y., Wang, Q., & Yao, W., et al. (2023). Evolution mechanism and improvement pathway of collaborative governance for pollution reduction and carbon reduction by government and enterprises under the “dual carbon” goal. Journal of China University of Petroleum (Social Science Edition), 39(06), 23–31. https://doi.org/10.13216/j.cnki.upcjess.2023.06.0004
[12]. Wang, H., & Guo, J. (2024). Research on the impact mechanism of multiple environmental regulations on carbon emissions under the perspective of carbon peaking pressure: A case study of China’s coastal regions. Ocean & Coastal Management, 249, Article 106985. https://doi.org/10.1016/j.ocecoaman.2024.106985
[13]. Chen, W. (2023, July 31). Xu Chunming, Academician of the Chinese Academy of Sciences, Dean of Future Technology College of Carbon Neutrality at China University of Petroleum (Beijing), and Director of the National Key Laboratory of Heavy Oil: Adjusting the energy structure is fundamental to achieving the “dual carbon” target. Securities Daily, B02. https://doi.org/10.28096/n.cnki.ncjrb.2023.003966
[14]. Sun, B., Zhang, J., & Han, Y., et al. (2022). Research on the evolution trend and path of China’s energy system balancing energy security and low-carbon transition under the “dual carbon” goal. China Coal, 48(10), 1–15. https://doi.org/10.19880/j.cnki.ccm.2022.10.001
[15]. Jiang, K. (2022). Pathways for energy and economic transformation under multiple objectives. Yuejiang Journal, 14(01), 34–43+172. https://doi.org/10.13878/j.cnki.yjxk.20211210.002
[16]. Cai, L., Guo, J., & Shi, C., et al. (2023). Simulation study of China’s energy supply and demand evolution path planning under the "dual carbon" goal. Progress in Climate Change Research, 19(05), 616–633.
[17]. Liu, S., Jiang, Y., Yu, S., Tan, W., Zhang, T., & Lin, Z. (2022). Electric power supply structure transformation model of China for peaking carbon dioxide emissions and achieving carbon neutrality. Energy Reports, 8(Supplement 15), 541–548. https://doi.org/10.1016/j.egyr.2022.10.085
[18]. He, J. (2013). Analysis of CO₂ emission peak: China’s emission reduction targets and strategies. China Population, Resources and Environment, 23(12), 1–9.
[19]. Chi, Z. (2023). Recommendations for energy conservation and carbon reduction in Zhejiang under the shift from dual energy control to dual carbon control: A study based on an international comparison of the KAYA identity. Statistics Science and Practice, (04), 27–30.
[20]. Qi, Y., & Li, Y. (2024). Factors influencing carbon emissions in China’s logistics industry and development pathways under the “dual carbon” goal: Based on an extended Kaya identity and LMDI decomposition model. Contemporary Economy & Trade, 21(02), 41–45. https://doi.org/10.19463/j.cnki.sdjm.2024.02.001
[21]. Zhang, Q., & Shi, X. (2023). Estimation and prediction of carbon emissions in Jiangsu Province. Cooperative Economy and Science & Technology, (24), 17–19. https://doi.org/10.13665/j.cnki.hzjjykj.2023.24.057
[22]. Xie, Y., & Qin, W. (2023). Carbon peak prediction and scenario analysis for Jiangsu Province: Based on the STIRPAT model. Journal of Nanjing Forestry University (Humanities and Social Sciences Edition), 23(03), 54–62. https://doi.org/10.16397/j.cnki.1671-1165.2023003054
[23]. Liu, H., & Li, X. (2024). Practicing green concepts and integrating technological innovation toward low-carbon goals: An interpretation of Jiangsu Province’s engineering construction standards for green city planning. Standardization of Engineering Construction, (01), 77–82. https://doi.org/10.13924/j.cnki.cecs.2024.01.010
[24]. Chen, J. (2023). Carbon emissions from energy consumption and its influencing factors in Guangdong based on the extended Kaya model. Energy Conservation, 42(11), 53–56.
[25]. Zhao, J., & Wang, T. (2023). Influencing factors and strategies for carbon emissions in Liaoning’s cement industry: Based on the extended Kaya identity. In Proceedings of the 20th Shenyang Science and Academic Conference. https://doi.org/10.26914/c.cnkihy.2023.042961
[26]. Zhang, Y. (2023). Spatial-temporal evolution of industrial carbon emissions and carbon transfer in Jiangsu Province under industrial relocation. Jiangsu Science & Technology Information, 40(24), 64–67.
[27]. Qin, X., Xu, X., & Yang, Q. (2024). Carbon peak prediction and emission reduction pathways of China’s low-carbon pilot cities: A case study of Wuxi city in Jiangsu province. Journal of Cleaner Production, Article 141385. https://doi.org/10.1016/j.jclepro.2024.141385
[28]. Zhu, S., Zhang, C., Fang, X., Yan, Y., Hang, X., Chen, Y., Sun, L., Xie, X., & Li, Y. (2019). Impact of carbon dioxide emission control on GNP growth: Interpretation of proposed scenarios. IPCC Response Strategies Working Group Memorandum.
[29]. Chen, W., & Hou, J. (2010). Discussion on China’s low-carbon economic strategy based on the Kaya model. Value Engineering, 29(22), 3–4. https://doi.org/10.14018/j.cnki.cn13-1085/n.2010.22.145
Cite this article
Tian,T.;Qiu,F.;Zhao,G.;Li,Q.;Zeng,S. (2024). Carbon Peak Prediction and Carbon Reduction Path Simulation under the “Dual Carbon” Target: A Case Study of Jiangsu Province. Journal of Applied Economics and Policy Studies,12,43-52.
Data availability
The datasets used and/or analyzed during the current study will be available from the authors upon reasonable request.
Disclaimer/Publisher's Note
The statements, opinions and data contained in all publications are solely those of the individual author(s) and contributor(s) and not of EWA Publishing and/or the editor(s). EWA Publishing and/or the editor(s) disclaim responsibility for any injury to people or property resulting from any ideas, methods, instructions or products referred to in the content.
About volume
Journal:Journal of Applied Economics and Policy Studies
© 2024 by the author(s). Licensee EWA Publishing, Oxford, UK. This article is an open access article distributed under the terms and
conditions of the Creative Commons Attribution (CC BY) license. Authors who
publish this series agree to the following terms:
1. Authors retain copyright and grant the series right of first publication with the work simultaneously licensed under a Creative Commons
Attribution License that allows others to share the work with an acknowledgment of the work's authorship and initial publication in this
series.
2. Authors are able to enter into separate, additional contractual arrangements for the non-exclusive distribution of the series's published
version of the work (e.g., post it to an institutional repository or publish it in a book), with an acknowledgment of its initial
publication in this series.
3. Authors are permitted and encouraged to post their work online (e.g., in institutional repositories or on their website) prior to and
during the submission process, as it can lead to productive exchanges, as well as earlier and greater citation of published work (See
Open access policy for details).
References
[1]. Nawaz, M. A., Hussain, M. S., Kamran, H. W., et al. (2021). Trilemma association of energy consumption, carbon emission, and economic growth of BRICS and OECD regions: Quantile regression estimation. Environmental Science and Pollution Research, 28(13), 1–15.
[2]. Wang, K., Wu, M., Sun, Y., et al. (2019). Resource abundance, industrial structure, and regional carbon emissions efficiency in China. Resources Policy, 60, 203–214.
[3]. Project Comprehensive Report Writing Group. (2020). Comprehensive report on China’s long-term low-carbon development strategy and transition pathway. China Population, Resources and Environment, 30(11), 1–25.
[4]. Wang, X., Zheng, F., Xu, Y., et al. (2023). Carbon peak prediction in Ningxia under the dual carbon target background. China Environmental Science, 43(S1), 347–356. https://doi.org/10.19674/j.cnki.issn1000-6923.2023.0253
[5]. Zhang, L., & Pan, J. (2021). Prediction of regional carbon peak in China and research on strategies for achieving the “dual carbon” target. China Energy, 43(07), 54–62+80.
[6]. The spatiotemporal patterns and climate impacts of the carbon dynamics in economically developed areas of China during the past 40 years: A case of Jiangsu Province. (2024). Journal of Cleaner Production, 435, Article 140567. https://doi.org/10.1016/j.jclepro.2024.140567
[7]. He, J. (2021). Low-carbon transition of energy and economy under the carbon peaking and carbon neutrality targets. Journal of Environmental Economics, 6(01), 1–9. https://doi.org/10.19511/j.cnki.jee.2021.01.001
[8]. Wang, W., Liu, J., & Zhao, Y. (2022). Carbon neutrality and China’s future. Beijing Normal University Press.
[9]. Project Comprehensive Report Writing Group. (2020). Comprehensive report on China’s long-term low-carbon development strategy and transition pathway. China Population, Resources and Environment, 30(11), 1–25.
[10]. Liu, Y., Ding, S., & Wang, H. (2022). Analysis of regional green development policy efficiency under the “dual carbon” goal: A case study of Qaidam Basin. Special Economic Zone Economy, (08), 62–65.
[11]. Ma, Y., Wang, Q., & Yao, W., et al. (2023). Evolution mechanism and improvement pathway of collaborative governance for pollution reduction and carbon reduction by government and enterprises under the “dual carbon” goal. Journal of China University of Petroleum (Social Science Edition), 39(06), 23–31. https://doi.org/10.13216/j.cnki.upcjess.2023.06.0004
[12]. Wang, H., & Guo, J. (2024). Research on the impact mechanism of multiple environmental regulations on carbon emissions under the perspective of carbon peaking pressure: A case study of China’s coastal regions. Ocean & Coastal Management, 249, Article 106985. https://doi.org/10.1016/j.ocecoaman.2024.106985
[13]. Chen, W. (2023, July 31). Xu Chunming, Academician of the Chinese Academy of Sciences, Dean of Future Technology College of Carbon Neutrality at China University of Petroleum (Beijing), and Director of the National Key Laboratory of Heavy Oil: Adjusting the energy structure is fundamental to achieving the “dual carbon” target. Securities Daily, B02. https://doi.org/10.28096/n.cnki.ncjrb.2023.003966
[14]. Sun, B., Zhang, J., & Han, Y., et al. (2022). Research on the evolution trend and path of China’s energy system balancing energy security and low-carbon transition under the “dual carbon” goal. China Coal, 48(10), 1–15. https://doi.org/10.19880/j.cnki.ccm.2022.10.001
[15]. Jiang, K. (2022). Pathways for energy and economic transformation under multiple objectives. Yuejiang Journal, 14(01), 34–43+172. https://doi.org/10.13878/j.cnki.yjxk.20211210.002
[16]. Cai, L., Guo, J., & Shi, C., et al. (2023). Simulation study of China’s energy supply and demand evolution path planning under the "dual carbon" goal. Progress in Climate Change Research, 19(05), 616–633.
[17]. Liu, S., Jiang, Y., Yu, S., Tan, W., Zhang, T., & Lin, Z. (2022). Electric power supply structure transformation model of China for peaking carbon dioxide emissions and achieving carbon neutrality. Energy Reports, 8(Supplement 15), 541–548. https://doi.org/10.1016/j.egyr.2022.10.085
[18]. He, J. (2013). Analysis of CO₂ emission peak: China’s emission reduction targets and strategies. China Population, Resources and Environment, 23(12), 1–9.
[19]. Chi, Z. (2023). Recommendations for energy conservation and carbon reduction in Zhejiang under the shift from dual energy control to dual carbon control: A study based on an international comparison of the KAYA identity. Statistics Science and Practice, (04), 27–30.
[20]. Qi, Y., & Li, Y. (2024). Factors influencing carbon emissions in China’s logistics industry and development pathways under the “dual carbon” goal: Based on an extended Kaya identity and LMDI decomposition model. Contemporary Economy & Trade, 21(02), 41–45. https://doi.org/10.19463/j.cnki.sdjm.2024.02.001
[21]. Zhang, Q., & Shi, X. (2023). Estimation and prediction of carbon emissions in Jiangsu Province. Cooperative Economy and Science & Technology, (24), 17–19. https://doi.org/10.13665/j.cnki.hzjjykj.2023.24.057
[22]. Xie, Y., & Qin, W. (2023). Carbon peak prediction and scenario analysis for Jiangsu Province: Based on the STIRPAT model. Journal of Nanjing Forestry University (Humanities and Social Sciences Edition), 23(03), 54–62. https://doi.org/10.16397/j.cnki.1671-1165.2023003054
[23]. Liu, H., & Li, X. (2024). Practicing green concepts and integrating technological innovation toward low-carbon goals: An interpretation of Jiangsu Province’s engineering construction standards for green city planning. Standardization of Engineering Construction, (01), 77–82. https://doi.org/10.13924/j.cnki.cecs.2024.01.010
[24]. Chen, J. (2023). Carbon emissions from energy consumption and its influencing factors in Guangdong based on the extended Kaya model. Energy Conservation, 42(11), 53–56.
[25]. Zhao, J., & Wang, T. (2023). Influencing factors and strategies for carbon emissions in Liaoning’s cement industry: Based on the extended Kaya identity. In Proceedings of the 20th Shenyang Science and Academic Conference. https://doi.org/10.26914/c.cnkihy.2023.042961
[26]. Zhang, Y. (2023). Spatial-temporal evolution of industrial carbon emissions and carbon transfer in Jiangsu Province under industrial relocation. Jiangsu Science & Technology Information, 40(24), 64–67.
[27]. Qin, X., Xu, X., & Yang, Q. (2024). Carbon peak prediction and emission reduction pathways of China’s low-carbon pilot cities: A case study of Wuxi city in Jiangsu province. Journal of Cleaner Production, Article 141385. https://doi.org/10.1016/j.jclepro.2024.141385
[28]. Zhu, S., Zhang, C., Fang, X., Yan, Y., Hang, X., Chen, Y., Sun, L., Xie, X., & Li, Y. (2019). Impact of carbon dioxide emission control on GNP growth: Interpretation of proposed scenarios. IPCC Response Strategies Working Group Memorandum.
[29]. Chen, W., & Hou, J. (2010). Discussion on China’s low-carbon economic strategy based on the Kaya model. Value Engineering, 29(22), 3–4. https://doi.org/10.14018/j.cnki.cn13-1085/n.2010.22.145