


1. Introduction
Canada faces serious challenges in population growth and skill/labour shortages. The decline in fertility rates and the aging of the resident population have resulted in a continuously declining natural population growth since 1961 [1]. In Ontario and Quebec, the labour forces are predicted to experience a shortfall of 325,000 and 292,000 workers respectively, by 2025 [2]. In order to boost population growth and address the growing needs of the skilled labour, Canada has a strong motivation to expand their share of the skilled immigrants. International students are valued both as potential skilled immigrants and as economic assets who will be well-prepared to contribute to the knowledge-based economy. Therefore, it is necessary to identify important factors that influence international students’ decisions to receive education in Canada.
Within Canada, some provinces have higher proportions of international students than others. The percentage of international students’ enrollment rate in British Columbia and Ontario were statistically higher than in Prince Edward Island and Newfoundland and Labrador during the period of 2006 to 2016. In order to explore the determinants of international students’ geographic distribution in Canada, this essay focuses on analyzing the determinants of international students’ choice of province in which to study in Canada. Using the migration model for international students with panel data, the regression results showed that international students tend to choose a province with lower tuition fees to complete their education. Moreover, the implementation of relevant federal and provincial immigration policies also has a positive impact of attracting international students in Canada.
The article is organized as follows. First, section 2 introduces the background information, including an overview of Canada’s demographic statistics, advantages and barriers of international students’ recruitment, and the relevant immigration policies. Next, section 3 presents a brief review of the literature on international student recruitment. Section 4 discusses the methodology employed, the data analysis, and the estimation and results, including the most important findings. The last section provides the conclusion and suggestions for improving recruitment of international students in Canada.
2. Background
2.1. Demographic Challenges in Canada
Over the past decades, Canada has been experiencing demographic challenges such as a decline in fertility rates as well as an overall aging population. People aged 15 to 64 constitute the majority of the labour force in the Canadian labour market, and people aged 55 to 64 are often close to retirement. However, as shown in figure 1, the annual growth rate of the population aged 15 to 64 decreased significantly from 1.1% in 2006-2011 to only 0.4% in 2011-2016, which was the lowest growth rate since 1851 [3]. In 2016, people aged 55 and over accounted for 36% of the working-age population, which was the highest proportion since 1976, and people aged 15 to 24 (4.3 million) were fewer than people aged 55 to 64 (4.9 million) in Canada [4]. Therefore, Canada requires more skilled immigrants to fill job vacancies and address the demographic challenges.
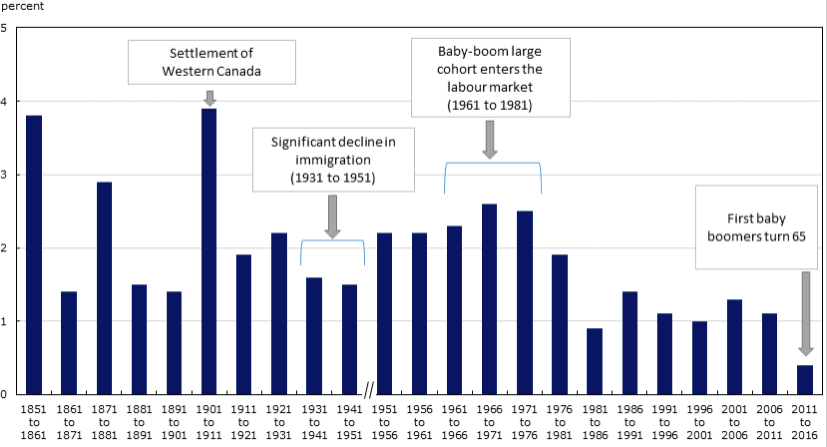
Figure 1. Annualized intercensal growth (percentage) of population aged 15 to 64, Canada, 1851 to 2016
Source: Statistics Canada, Census of Population, 1851-2016
2.2. Trends of International Students in Canada
Since international students are increasingly regarded as an important group of young and well-educated people that can be transitioned into potential skilled immigrants in Canada, in recent years, Canada has significantly increased its effort to recruit international students. Canada admitted nearly 572,000 international students in 2018, which is more than triple the number in the 1990s at 158,000 [5]. However, the diversity of international student populations has declined during this period. China and India have become the two top source countries with over 55% of international students in Canada in 2018 [6]. In terms of the geographic distribution of international students within Canada, in 2016, the majority of international students resided in Ontario (42%), British Columbia (19.1%), and Quebec (19.5%), whereas only 6.8% of international students resided in Atlantic Canada [6].
2.3. Benefits of International Students’ Recruitment
Internationalization has changed the educational landscape in many countries and increased the mobility of students who are seeking quality education outside their country of origin [7]. Canada is one of the host countries where international students have made valuable contributions to the diversity and the prosperity of educational institutions. Canadian universities accept international students for a number of reasons, such as to enhance their global contacts and reputation, to increase enrollment, and to generate revenue from tuition fees [8]. From 2000 to 2011, international students grew over 99% in Canada, from 89,532 to 178,491, which was two times more than the domestic student’s growth rates at 37% [9]. Over this period, tuition fees for international students have increased and have continuously contributed to the revenue of public universities. Figure 2 outlines the changing revenue streams of Canadian universities between 2000 and 2012. Figure 3 also demonstrates that international students’ tuition fees contribute a considerable portion to the increasing tuition revenues, with international undergraduate students’ annual tuition costs averaging $18,462 in 2012–2013 compared to $5,646 for their Canadian peers. International graduate student tuition costs were also considerably higher, at $13,299 compared to $5,979 for Canadian students. The combined evidence demonstrates that international students represent an important source of income for Canadian universities. Apart from that, Canada has benefited significantly from international students’ expenditures, including rental expenditures, transportation, and other living costs [10].
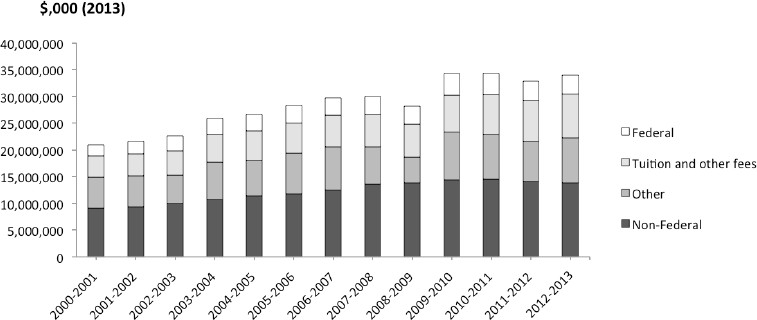
Figure 2. Annual revenues by type of funds of universities and degree-granting colleges (2013 dollars x1,000)
Source: Statistics Canada, table 477-0058
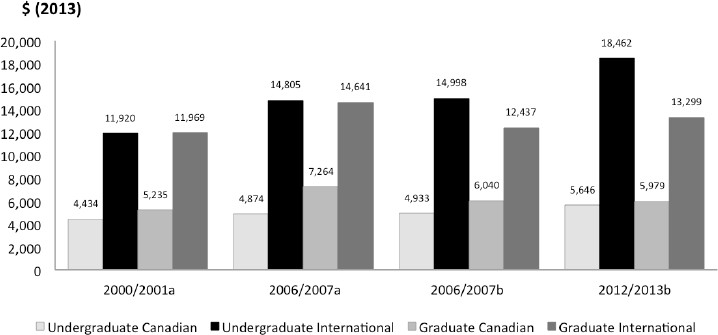
Figure 3. Canadian tuition fees, 2000/2001 to 2012/2013 (2013 dollars)
Source: Statistics Canada, Post-secondary Student Information System, Custom table 8E and 9E
Moreover, domestic students also benefit from international students’ recruitment. International student tuition fees are a major contributor to university funding, and this contribution enables domestic students’ tuition fees to be kept reasonably low [11]. Studying in an international environment enhances domestic students’ ability to adjust to different cultures and improve their productivity and future incomes, which also generates for the Canadian government tax revenue in the future [12]. International students also contribute to Canada’s diverse culture and strengthen local links to the global market [10].
2.4. Barriers to International Students’ Recruitment
Even though international students are more familiar with the receiving country’s society and culture than other skilled immigrants, they still encounter many obstacles as compared with domestic counterparts, such as language difficulties, pressure to succeed, cultural differences, and financial issues [8]. Language poses a barrier for international students, which makes their studies more demanding and time-consuming than domestic students. As a consequence, international students need to spend more time on their academic work and less time on extracurricular activities, which makes them feel isolated during the studying process [7]. Even after studying three to four years in Canada, international students still face challenges in building social connections and establishing social networks [13]. A lack of social networks and limited language proficiency in comparison with local students create low levels of self-confidence and fear of discrimination from employers among international students [14]. In addition, international students’ career choices were affected more by their parents’ opinions or consideration of the employment market than personal preferences, which reduces their studying motivation [10].
2.5. Policies for Recruiting International Students
The Canadian governments has been actively making efforts to issue policies to attract international students, including the implementation of the Provincial Nominee Program (PNP) aimed at international students, the elimination of the Off-Campus Work Permit (OCWP), the extension of the Post-Graduate Work Permit (PGWP), the implementation of the Express Entry (EE) system and the Canadian Experience Class (CEC), the introduction of tuition fee rebate programs, and the introduction of the Student Partners Program (SPP) and the Student Direct Stream (SDS). The implementation of these immigration policies might have a positive impact of facilitating the entry of international students in Canada.
2.5.1. Provincial Nominee Program Aimed at International Students
The Provincial Nominee Program is a "provincially operated immigration program, which allows a province to nominate a foreign national for Canadian permanent residence" [15]. Each province and territory has its own streams and criteria for their Provincial Nominee Programs. These policies are available to international students who have completed studies within Canada, some of which will benefit students depending on the province they study in.
2.5.2. The Removal of the Off-Campus Work Permit
As of June 1, 2014, international students who are studying full-time at public post- secondary institutions are eligible to work off-campus without a work permit. They can work part time for up to 20 hours a week during a regular academic session and full time during regularly scheduled breaks between academic sessions [16].
2.5.3. Post-Graduate Work Permit Program
After graduating from an eligible Canadian designated learning institutions, international students become permitted to apply for a Post-Graduate Work Permit. Students are required to apply for this work permit within 180 days of their graduation, and this work permit is valid for up to a maximum of three years [15]. This work permit allows international students to work on a full-time basis with little restriction on the type of employment or location, and to gain valuable Canadian work experience.
2.5.4. The Canadian Experience Class and the Express Entry system
The Canadian Experience Class was introduced in 2008 to provide "a pathway for international students, recent graduates, and temporary foreign workers with Canadian work experience to transition to permanent residence (PR)" [2]. In 2015, the Canadian Experience Class became to a category of Express Entry. The Express Entry system manages PR applications from economic classes of immigrants which include graduated international students on a post-graduation work permit, and ensures timely processing of PR applications [2]. Citizenship and Immigration Canada (CIC) assesses candidates’ applications based on human capital and demographic factors such as age, education, work experience, language ability, and details on job offers. Eligible candidates will be invited to apply for PR based on their Comprehensive Ranking System scores [17].
2.5.5. Tuition Fee Rebate Programs
Tuition fee rebate programs provide new graduates with a rebate of up to 60% on their eligible tuition fees in order to reduce new graduates’ provincial income taxes. New Brunswick, Manitoba, Saskatchewan, and Nova Scotia have offered generous tuition tax rebates for new graduates regardless of the field of study in order to retain them over a number of years [18]. These programs provide an extra financial incentive for international students to stay in Canada after graduation.
2.5.6. Student Partners Program and Student Direct Stream
In 2009, the Student Partners Program was created as a pilot program between the Association of Canadian Community Colleges (ACCC), the Government of Canada and the Canadian High Commission in order to increase the number of studies permits and to simplify the student visa process for India and China [2]. In 2018, Refugees and Citizenship Canada (IRCC) have further improved the student partners program to the Student Direct Stream. International students who are from China, India, Vietnam and the Philippines can get their study permits within twenty calendar days by using the Student Direct Stream [19].
3. Literature Review
Many researchers have made significant contributions on studying the impact of recruiting international students on economic growth. They claim that recruiting international students not only generates revenue to Canada, but also relieves stresses for the Canadian labour market and contributes to the cultural diversity of the Canadian society. Due to limited research about international students’ geographic distribution in Canada, this study focuses on contributing factors that influence the recruitment of international students in Canada.
International students consider the Canadian post-secondary education as a “buffer” for them to gain time and opportunities to adapt to the Canadian culture and society [20]. The Canadian post-secondary education is a part of their local experience, which they expect to add more credibility to their overall skills and knowledge, as well as to improve their competitiveness in the Canadian job market [20]. The Canadian universities are one of the key contributors in enhancing international students’ employability. Arthur and Flynn argue that universities provide international students with campus services such as career counseling to help them explore new identities and integrate into the country where they pursue employment and permanent residency [21]. Moreover, universities increase off-campus work opportunities in career-related fields for international students, which develops their self-confidence, professional language, and communication proficiency. International students are exposed to Canadian norms and values in the workplace, which provides better prospects of labour market integration for them after graduation [13].
The reputation of the Canadian post-secondary education, opportunities for employment after graduation, and future permanent resident status are key factors that incentivize international students to study in Canada [14]. Moreover, low tuition fees and a low cost of living have attracted international students to study in Atlantic Canada, especially those who are more financially vulnerable [22]. International students are also attracted by immigration policies that allow them to work during and after their studies [22].
4. Empirical Analysis
4.1. Methodology
In order to identify the determinants of international students’ choice of province in which to study in Canada, I estimate the determining factors in equation (1). This equation captures students’ main motivations for studying in Canada as well as the implied migration costs. These motivations include quality of education, available grants and bursaries, and provincial immigration policies. The costs of migration include tuition fees and the cost of living. The model specification is set as below:
\( {F_{ij}}={β_{0}}+{β_{1}}ln{({tuition_{ij}})}+{β_{2}}({rank_{ij}})+{β_{3}}({grant_{ij}})+{β_{4}}ln{({livingcost_{ij}})}+{β_{5}}({PNP_{1}}*{Y_{1}})+{β_{6}}({PNP_{2}}*{Y_{1}}) \)
\( +{β_{7}}(Rebate*{Y_{2}})+{ϵ_{ij}} \) (1)
Where Fij is the dependent variable and represents the percentage of international students who choose to study in province j in each year. tuitionij, rankij, grantij, livingcostij, PNP1∗Y1, PNP2∗Y1, and Rebate∗Y2 are the independent variables. βs are the coefficients of these independent variables. β0 indicates the constant term. tuitionij denotes average tuition fees in province j in each year. rankij denotes the number of institutions in "Canada’s Top School by Reputation" in Maclean’s National Reputational Ranking in province j in each year. University ranking indicates the quality of education. livingcostij impacts the affordability of education in that it increases the total amount of money required to complete each year of study. grantij subsidizes the education costs. PNPs and Rebate are dummy variables. Ys represents the length of policy implementation. In order to estimate the impact of time on immigration policies, each dummy variable is multiplied by the length of policy implementation Ys to become an interactive term.
PNP1 represents employment requirement of the provincial nominee program. International students can apply for the PNP without a job offer in British Columbia, Ontario, and Quebec, whereas in the remaining seven provinces in Canada, the PNP’s candidates are required to demonstrate a job offer that is related to their studies to ensure that their immigration responds to labour market needs. Therefore, I assigned PNP1=1 in British Columbia, Ontario, and Quebec, and PNP1=0 in Prince Edward Island, Nova Scotia, New Brunswick, Newfoundland and Labrador, Saskatchewa, Manitoba, and Alberta. I multiplied PNP1 by the length of PNP implementation Y1 to get the interactive term PNP1∗Y1. PNP2 represents education requirement of the provincial nominee program. International students who have graduated from an institution in a province other than their resident province and have a full-time indeterminate length job offer in the resident province can apply for the resident province’s PNP in British Columbia, Ontario, Manitoba, Saskatchewan, and Newfoundland and Labrador, whereas in the remaining five provinces in Canada, international students must have graduated from the resident province in order to be eligible to apply to the resident province’s PNP. Therefore, I assigned PNP2=1 in British Columbia, Ontario, Manitoba, Saskatchewan, and Newfoundland and Labrador, and assigned PNP2=0 in Prince Edward Island, Nova Scotia, New Brunswick, Quebec and Alberta. I multiplied PNP2 by the length of PNP implementation Y1 to get the interactive term PNP2∗Y1. Rebate represents tuition fee rebate programs. International students are eligible to receive generous tuition tax rebates regardless of field of study if they reside and work in New Brunswick, Manitoba, Saskatchewan, or Nova Scotia, whereas in the remaining six provinces in Canada, international students receive only a small portion of credit in their eligible tuition fees. Therefore, I assigned Rebate=1 in New Brunswick, Manitoba, Saskatchewan, and Nova Scotia, and assigned Rebate=0 in Prince Edward Island, Newfoundland and Labrador, British Columbia, Ontario, Quebec and Alberta. I multiplied Rebate by the length of tuition fee rebate programs implementation Y2 to get the interactive term Rebate∗Y2. The last variable ϵij is an error term.
Since provinces with a larger population have more institutions to attract more international students and are able to provide more grants and bursaries than other provinces, I have adjusted the measurement of some variables below:
1. Fij : the percentage of international students studied in province j in each year in every 100 people
\( {F_{ij}}=\frac{Post-secondary international students in province j in each year}{Total population in province j in each year ({Pop_{ij}})/100}*100\% \)
2. grantij : average grants in province j in each year
\( {grant_{ij}}=\frac{Total grants of all institutions in province j in each year}{ Total post-secondary students in province j in each year} \)
4.2. Data Source
In order to estimate the international students’ migration model, I used panel data from Statistics Canada between 2006 and 2016 to conduct the regression analysis. Information on the percentage of international students studied in each province in each year in every 100 people is taken from “Statistics Canada, CANSIM, table 477-0031 and table 17-10-0134-01”. Information on international student average tuition fees is taken from “Statistics Canada, CANSIM, table 477-0023 and 477-0024”. Information on universities’ rankings is taken from Maclean’s National Reputational Ranking [23]. Information on average grants is taken from “Statistics Canada, CANSIM, table 477-0059”. Information on the cost of living is taken from “Statistics Canada, CANSIM, table 384-0038”. Information on the region’s immigration policies is taken from “Citizenship and Immigration Canada”.
Due to the absence of statistical information on some explanatory variables, the observation years are from 2006 to 2016. After merging raw datasets, the final dataset contains 110 observations. Each observation corresponds to the percentage of international students who studied in each province in each year in every 100 people, average tuition fees, the number of institution(s) in "Canada’s Top School by Reputation", the cost of living, average grants in each province in each year, and the region’s immigration policies.
4.3. Estimation and Results
4.3.1. Descriptive Statistics
Table 1 and table 2 show that the means and standard deviations of the dependent variable and the independent variables that were used in the estimations. These tables make a clear comparison between the means and standard deviations of each variable in each province and in each year between 2006 and 2016. Each year contains 10 observations and each province contains 11 observations, equaling 110 observations in total.
As shown in table 1, the percentage of international students studied in Canada steadily increased from 2006 to 2016. Average tuition fees, average grants, and the cost of living in Canada also slightly increased between 2006 to 2016.
Table 1. Descriptive Summary of Data by Year
Variable’s name Year | Fij | ln(tuitionij) | grantij | ln(livingcostij) | ||||
Mean | Std. | Mean | Std. | Mean | Std. | Mean | Std. | |
2006 | 31.137 | 10.894 | 9.195 | 0.289 | 0.670 | 0.305 | 10.492 | 1.420 |
2007 | 32.186 | 11.295 | 9.240 | 0.325 | 0.690 | 0.209 | 10.555 | 1.419 |
2008 | 35.656 | 15.786 | 9.228 | 0.343 | 0.764 | 0.207 | 10.605 | 1.414 |
2009 | 35.802 | 11.095 | 9.346 | 0.302 | 0.758 | 0.198 | 10.617 | 1.406 |
2010 | 39.247 | 11.902 | 9.386 | 0.313 | 0.805 | 0.213 | 10.667 | 1.405 |
2011 | 43.827 | 13.057 | 9.425 | 0.327 | 0.860 | 0.220 | 10.713 | 1.403 |
2012 | 47.270 | 13.871 | 9.437 | 0.328 | 0.900 | 0.212 | 10.748 | 1.402 |
2013 | 50.901 | 15.274 | 9.465 | 0.342 | 0.926 | 0.219 | 10.788 | 1.404 |
2014 | 55.891 | 16.514 | 9.496 | 0.355 | 0.976 | 0.237 | 10.830 | 1.410 |
2015 | 58.444 | 17.498 | 9.538 | 0.360 | 1.022 | 0.217 | 10.854 | 1.416 |
2016 | 63.344 | 20.570 | 9.577 | 0.371 | 1.078 | 0.234 | 10.879 | 1.419 |
Total | 44.833 | 17.564 | 9.394 | 0.341 | 0.859 | 0.251 | 10.704 | 1.350 |
As shown in table 2, Newfoundland and Labrador had the lowest percentage of international students during 2006 to 2016, whereas British Columbia had the highest percentage of international students during this period. Newfoundland and Labrador had the lowest tuition fees in Canada from 2006 to 2016, and Nova Scotia had the highest average grants in the country during this period. The four Atlantic provinces had the lowest cost of living in the country between 2006 and 2016, while Ontario and Quebec had the highest cost of living in Canada during this period. Ontario has the largest number of reputational institutions in Canada.
Table 2. Descriptive Summary of Data by Province
Variable’s name Province | Fij | ln(tuitionij) | grantij | ln(livingcostij) | rankij | |||||
Mean | Std. | Mean | Std. | Mean | Std. | Mean | Std. | Mean | Std. | |
NL | 31.677 | 10.558 | 8.731 | 0.039 | 0.910 | 0.152 | 9.528 | 0.149 | 1 | 0 |
PEI | 46.705 | 12.802 | 9.477 | 0.358 | 0.762 | 0.135 | 8.212 | 0.118 | 1 | 0 |
NS | 61.718 | 17.418 | 9.571 | 0.075 | 1.225 | 0.163 | 10.154 | 0.106 | 5.909 | 1.044 |
NB | 43.248 | 5.565 | 9.287 | 0.080 | 0.659 | 0.166 | 9.873 | 0.109 | 4 | 0 |
QC | 41.450 | 8.770 | 9.586 | 0.154 | 0.605 | 0.101 | 12.204 | 0.108 | 6.272 | 1.009 |
ON | 50.750 | 13.748 | 9.839 | 0.183 | 0.982 | 0.118 | 12.830 | 0.118 | 18.363 | 0.809 |
MB | 38.187 | 13.901 | 9.225 | 0.122 | 0.762 | 0.235 | 10.384 | 0.131 | 3 | 0 |
SK | 30.441 | 12.710 | 9.114 | 0.237 | 1.114 | 0.169 | 10.308 | 0.161 | 2 | 0 |
AB | 33.849 | 7.201 | 9.508 | 0.096 | 0.960 | 0.153 | 11.7231 | 0.146 | 3 | 0 |
BC | 70.307 | 19.887 | 9.601 | 0.109 | 0.619 | 0.091 | 11.829 | 0.132 | 4 | 0 |
Total | 44.833 | 17.564 | 9.394 | 0.341 | 0.859 | 0.251 | 10.704 | 1.350 | 4.854 | 4.862 |
4.3.2. Pearson Correlation Coefficient and Variance Inflation Factors
The existence of multicollinearity results in imprecise estimates of coefficient values and invalid regression results of individual predictors. In order to test whether multicollinearity exists among selected variables, the Pearson correlation coefficient and the Variance Inflation Factor are used for estimations. The Pearson correlation coefficient measures the linear correlation between two variables. As represented in table 3, no highly correlated selected variable exists in this model.
Table 3. Estimation Results of the Pearson Correlation Coefficient
Fij | ln(tuitionij) | rankij | grantij | ln(livingcostij) | PNP1 ∗ Y1 | PNP2 ∗ Y1 | rebate ∗ Y2 | |
Fij | 1.000 | |||||||
ln(tuitionij) | 0.557*** | 1.000 | ||||||
rankij | 0.224** | 0.590*** | 1.000 | |||||
grantij | 0.213** | 0.119** | 0.127** | 1.000 | ||||
ln(livingcostij) | 0.206** | 0.538*** | 0.677*** | -0.019 | 1.000 | |||
PNP1 ∗ Y1 | 0.301*** | 0.415*** | 0.276*** | -0.379*** | 0.596*** | 1.000 | ||
PNP2 ∗ Y1 | 0.095 | -0.365*** | -0.153 | 0.131 | 0.015 | -0.071 | 1.000 | |
Reabte ∗ Y2 | 0.032 | -0.123 | -0.182* | 0.174* | -0.189** | -0.297*** | 0.280*** | 1.000 |
* p < 0.1, ** p < 0.05, *** p < 0.01
The Variance Inflation Factor provides an index that measures how much the variance of an estimated regression coefficient is increased because of collinearity. Table 4 shows that the mean variance inflation factor has an acceptable value at 2.02. Based on the results in table 3 and table 4, no multicollinearity exists in the international students’ migration model.
Table 4. Estimation Results of Variance Inflation Factor
Variable | VIF | 1/VIF |
ln(tuitionij) | 2.28 | 0.439 |
rankij | 2.38 | 0.419 |
ln(livingcostij) | 3.01 | 0.332 |
grantij | 1.43 | 0.698 |
PNP1∗Y1 | 2.36 | 0.424 |
PNP2 ∗ Y1 | 1.46 | 0.686 |
Rebate ∗ Y2 | 1.23 | 0.811 |
Mean VIF | 2.02 | |
4.3.3. The Estimation Results
Table 5 shows that the estimation results of the fixed effects model, the random effects model, and the pooled regression model. In this study, the Breusch and Pagan Lagrange multiplier (LM) test and the Hausman test were employed to choose among the regression results of the fixed effects model, the random effects model, and the pooled regression model. The results of the Pagan Lagrange multiplier test are shown in table 6, and the results of the Hausman test are represented in table 7.
Table 5. Regression Results of the International Students’ Migration Model
(1) FE | (2) RE | (3) POLS | |
Fij | Fij | Fij | |
ln(tuitionij) | -17.058*** | -6.582 | 38.742*** |
(-3.68) | (-1.29) | (7.18) | |
rankij | -7.077*** | -4.842*** | -0.071 |
(-5.80) | (-4.43) | (-0.19) | |
grantij | 4.447 | 25.580*** | 13.271** |
(0.70) | (4.23) | (2.29) | |
ln(livingcostij) | 60.551*** | 15.190*** | -4.894*** |
(5.63) | (2.90) | (-3.13) | |
PNP1 ∗ Y1 | 3.098*** | 2.654*** | 0.805*** |
(7.05) | (5.80) | (3.00) | |
PNP2 ∗ Y1 | 0.925** | 1.556*** | 1.053*** |
(2.48) | (4.07) | (4.40) | |
Rebate ∗ Y2 | 0.567 | 0.629 | 0.053 |
(1.60) | (1.49) | (0.11) | |
_cons | -429.819*** | -73.459 | -286.436*** |
(-4.32) | (-1.19) | (-5.84) | |
N | 110 | 110 | 110 |
R-squared | 0.8521 | 0.8121 | 0.4756 |
t statistics in parentheses
* p < 0.1, ** p < 0.05, *** p < 0.01
The null hypothesis in the Breusch and Pagan Lagrange multiplier test is that variance across entities is zero. That is, there is no significant difference across units and no panel effect exists. As represented in table 6, the result of the Pagan Lagrange multiplier test is Prob > chibar2 = 0.0000, which rejects the null hypothesis at 1% significance level and concludes that the random effects model is more appropriate than the pooled regression model.
Table 6. Estimated Results of the Breusch and Pagan Lagrange Multiplier Test
Var | sd=squrt(Var) | |
Fij | 308.4963 | 17.56404 |
e | 26.68874 | 5.166115 |
u | 305.1987 | 17.46994 |
Test: Var(u) = 0 | chibar2(01) =95.07 | Prob > chibar2 = 0.0000 |
The null hypothesis in the Hausman test is that the difference in coefficients is not systematic. That is, the unique errors are not correlated with the regressors. As shown in table 7, the result of the Hausman test is Prob > chi2 = 0.0000, which rejects the null hypothesis at 1% significance level and concludes that the fixed effects model is more appropriate than the random effects model.
Table 7. Results of the Hausman Test
fe | re | Difference | S.E. | |
ln(tuitionij) | -17.50816 | -6.582273 | -10.47589 | . |
rankij | -7.077869 | -4.84268 | -2.235189 | 0.5425338 |
grantij | 4.447315 | 25.58044 | -21.13313 | 1.94443 |
ln(livingcostij) | 60.55164 | 15.19031 | 45.36133 | 9.400776 |
PNP1 ∗ Y1 | 3.09826 | 2.654188 | 0.4440724 | . |
PNP2 ∗ Y1 | 0.9257501 | 1.556825 | -0.6310752 | . |
Rebate ∗ Y2 | 0.5673305 | 0.6291861 | -0.0618556 | . |
chi2(7) =136.37 | Prob >chi2 = 0.0000 | |||
Based on the Breusch and Pagan Lagrange multiplier test and the Hausman test results, the regression results of the fixed effects model are used in the international students’ migration model. The result of the regression model is set as equation (2):
\( {F_{ij}}=429.819-17.058ln{({tuition_{ij}})}-7.077({rank_{ij}})+4.447({grant_{ij}})+60.551ln{({livingcost_{ij}})}+3.098({PNP_{1}}*{Y_{1}}) \)
\( +0.925({PNP_{2}}*{Y_{1}})+0.567(Rebate*{Y_{2}})+{ϵ_{ij}} \) (2)
Table 5 shows that tuitionij, rankij, livingcostij, and PNP1∗Y1 are significant at 1% significance level, PNP2∗Y1 is significant at 5% significance level in the international students’ migration model. The R-squared is 0.8521, which denotes that 85.21 percent of samples could be explained by the independent variables.
The coefficient of variable ln(tuitionij) is negative, which denotes that a 1% increases in international students’ average tuition fees decreases 0.170% of international students’ enrollments in every 100 people. The coefficient of rankij is negative, which denotes that the percentage of international students in every 100 people decreases by 7.077% for every additional increase of the number of the reputational institution. The negative coefficient of rankij might be because top institutions usually charge more tuition fees and admissions are more competitive than other institutions for international students. grantij is insignificant, which denotes that international students’ post-secondary enrollments in Canada were not directly associated with average grants. The coefficient of ln(livingcostij) is positive, which denotes that a 1% increase in the cost of living increases 0.605% of international students’ enrollments in every 100 people. The positive coefficient of ln(livingcostij) might be rationalized by the fact that the majority of post-secondary institutions are located in Ontario, which had the highest cost of living in Canada during 2006 to 2016. The coefficient of PNP1∗Y1 is positive, which denotes that the percentage of international students in every 100 people increases by 3.098% for every additional year of PNP1 implementation. The coefficient of PNP2∗Y1 is positive, which denotes that the percentage of international students in every 100 people increases by 0.925% for every additional year of PNP2 implementation. The coefficient of Rebate∗Y2 has been insignificant in all three models, which indicate that the implementation of tuition fee rebate programs did not have a significant impact on attracting international students to study in Canada. This might be rationalized by the fact that tuition fee rebate programs do not require candidates received Canadian post-secondary education.
In order to identify the effects of both provincial and federal immigration policies on international students’ choice of province in which to study in Canada, I estimate the determining factors in a pooled regression model. The model specification is set as equation (3) below:
\( {F_{ij}}={β_{0}}+{β_{1}}ln{({tuition_{ij}})}+{β_{2}}({rank_{ij}})+{β_{3}}({grant_{ij}})+{β_{4}}ln{({livingcost_{ij}})}+{β_{5}}({PNP_{1}})+{β_{6}}({PNP_{2}})+{β_{7}}Rebate) \)
\( +{β_{8}}(OCWP)+{β_{9}}(PGWP)+{β_{10}}(EE)+{β_{11}}(SPP)+{ϵ_{ij}} \) (3)
Where immigration policies are dummy variables. PNP1 represents the boarder of employment requirement in certain provinces under the PNP. PNP2 represents the boarder of education requirement in certain provinces under the PNP. Rebate represents tuition fee rebate programs. OCWP represents the removal of the Off-Campus Work Permit, PGWP represents the extension of the Post-Graduate Work Permit, EE represents the Express Entry, and SPP represents the Student Partners Program. I assigned policys=0 if policies were not implemented, and policys=1 if policies were implemented. The estimation results of the pooled regression model is shown in table 8.
Table 8. Regression Results of the Migration Model with Policies Variables
Fij | |
ln(tuitionij) | 20.899*** |
(3.45) | |
rankij | -0.692* |
(-1.72) | |
grantij | 16.919** |
(2.34) | |
ln(livingcostij) | -5.596*** |
(-3.69) | |
PNP1 | 27.700*** |
(4.41) | |
PNP2 | 0.366 |
(0.12) | |
Rebate | 5.647* |
(1.86) | |
OCWP | 9.944** |
(2.34) | |
PGWP | 2.037 |
(0.43) | |
EE | 2.945 |
(0.63) | |
SPP | 2.436 |
(0.56) | |
_cons | -119.698** |
(-2.14) | |
N | 110 |
R-squared | 0.5365 |
t statistics in parentheses
* p< 0.1, ** p< 0.05, *** p< 0.01
In order to test whether multicollinearity exists among selected variables, the Variance Inflation Factor is used for estimations. Table 9 shows that the mean variance inflation factor has an acceptable value at 2.93. Therefore, no multicollinearity exists in the pooled regression model.
Table 9. Estimation Results of Variance Inflation Factor
Variable | VIF | 1/VIF |
ln(tuitionij) | 3.26 | 0.307 |
rankij | 2.92 | 0.342 |
ln(livingcostij) | 3.19 | 0.313 |
grantij | 2.53 | 0.395 |
PNP1 | 6.37 | 0.157 |
PNP2 | 1.82 | 0.550 |
Rebate | 1.52 | 0.658 |
OCWP | 2.75 | 0.363 |
PGWP | 2.53 | 0.395 |
EE | 2.49 | 0.400 |
SPP | 2.84 | 0.351 |
Mean VIF | 2.93 | |
Based on table 8, the result of the international students’ migration model with policies variables is set as equation (4):
\( {F_{ij}}=119.698+20.899ln{({tuition_{ij}})}-0.692({rank_{ij}})+16.919({grant_{ij}})-5.596ln{({livingcost_{ij}})}+27.700({PNP_{1}}) \)
\( +0.366({PNP_{2}})+5.647Rebate)+9.944(OCWP)+2.037(PGWP)+2.945(EE)+2.436(SPP)+{ϵ_{ij}} \) (4)
According to table 8, ln(tuitionij), ln(livingcostij), and PNP1 are significant at 1% significance level, grantij and OCWP are significant at 5% significance level, and Rebate and rankij are significant at 10% significance level in the pooled regression model. The R-squared is 0.5365, which denotes that 53.65 percent of samples could be explained by the independent variables.
The coefficient of PNP1 is positive, which denotes that the boarder of employment requirement in certain provinces under the PNP increases 27.700% of international students’ enrollments in every 100 people. The coefficient of Rebate is positive, which denotes that the implementation of tuition fee rebate programs increases 5.647% of international students’ enrollments in every 100 people. The coefficient of OCWP is positive, which denotes that the removal of the Off-Campus Work Permit increases 9.944% of international students’ enrollments in every 100 people. PNP2, PGWP, EE, and SPP have been insignificant, which denotes that the boarder of education requirement in certain provinces under the PNP, the extension of the Post-Graduate Work Permit, the implementation of the Express Entry, and the introduction of the Student Partners Program did not have a significant impact on attracting international students to study in Canada during 2006 to 2016.
Since ln(tuitionij) and ln(livingcostij) have different direction of coefficients between equation (2) and equation (4), F-test was employed to explore reasons behind the different direction of coefficients. The null hypothesis in the F-test is that the observed and unobserved fixed effects ui are equal to zero, and the results of F-test are F(9, 93) = 58.37 and Prob > F = 0.0000, which rejects the null hypothesis at 1% significance level and concludes that the fixed effects are non-zero and the regression results of the new pooled regression model is biased. Therefore, regression results of the fixed effects model are more appropriate for main variables’ explanation, and regression results of the pooled regression model are used to identify the effects of immigration policies on international students’ enrollments in Canada.
5. Conclusions and Suggestions
Using panel data for the period from 2006 to 2016 covering 10 provinces of Canada, this paper analyzes the determinants of international student recruitment in Canada. The above research and analysis of the international students’ migration model state that low tuition fees, high cost of living, low institution ranking, and the implementation of provincial nominee programs are positively associated with international students’ post-secondary enrollments in Canada. This study also finds that immigration policies play an important role in the recruitment of international students. The boarder employment requirement in certain provinces under the provincial nominee program, the implementation of tuition fee rebate programs, and the removal of the Off-Campus Work Permit increased international students’ post-secondary enrollments, whereas the boarder education requirement in certain provinces under the provincial nominee program, the extension of the Post-Graduate Work Permit, the implementation of the Express Entry, and the introduction of the Student Partners Program did not have a significant impact on international students’ recruitment in Canada during 2006 to 2016. Furthermore, the length of the provincial nominee program implementation is positively associated with the percentage of international students in Canada.
Canada requires more young and skilled international students to boost economic growth. Therefore, governments and local communities should make efforts to expand the share of international students in Canada. Universities can provide supports for internationals students, such as language training, academic counselling, career services, and immigration services included support with study permits applications. These supports not only address international students’ social and academic needs, but also help them integrate quickly and smoothly in the Canadian community.
References
[1]. Anderson, T. (2015). Seeking internationalization: the state of Canadian higher education. Canadian Journal of Higher Education, 45(4), 166–187.
[2]. Arthur, N., & Flynn, S. (2011). Career development influences of international students who pursue permanent immigration to Canada. International Journal for Educational and Vocational Guidance, 11(3), 221–237.
[3]. Calder, M. J., Richter, S., Mao, Y., Kovacs Burns, K., Mogale, R. S., & Danko, M. (2016). International students attending Canadian universities: their experiences with housing, finances, and other issues. Canadian Journal of Higher Education, 46(2), 92–110.
[4]. Chira, S. (2013). Dreaming big, coming up short: The challenging realities of international students and graduates in Atlantic Canada. Working paper (Atlantic Metropolis Centre); No. 47 2013. Halifax, N.S.: Atlantic Metropolis Centre.
[5]. Citizenship and Immigration Canada. (2018a). Provincial Nominee Program. Retrieved June 26, 2018, from https://www.canada.ca/en/immigration-refugees-citizenship/services/immigrate-canada/provincial-nominees/eligibility.html
[6]. Citizenship and Immigration Canada. (2018b). The Express Entry Programs. Retrieved June 26, 2018, from https://www.canada.ca/en/immigration-refugees-citizenship/services/immigrate-canada/express-entry/eligibility.html
[7]. Citizenship and Immigration Canada. (2019a). Work off-campus as an international student. Retrieved February 28, 2019, from https://www.canada.ca/en/immigration-refugees-citizenship/services/study-canada/work/work-off-campus.html
[8]. Citizenship and Immigration Canada. (2019b). Get a study permit faster through the Student Direct Stream. Retrieved May 1, 2019, from https://www.canada.ca/en/immigration-refugees-citizenship/services/study-canada/study-permit/student-direct-stream.html
[9]. El Masri, A. (2016). The global competition for international students as future immigrants: The role of Ontario universities in translating government policy into institutional practice. desLibris. Documents collection.
[10]. Feng, H., & Yuqian, L. (2015). Insights on Canadian society: international students who become permanent residents in Canada. Retrieved December 10, 2015, from https://www150.statcan.gc.ca/n1/pub/75-006-x/2015001/article/14299-eng.htm
[11]. James, C. E. (2004). Assimilation to accommodation: Immigrants and the changing patterns of schooling. Education Canada, 44(4), 43–45.
[12]. Macleans. (2018). Maclean’s National Reputational Ranking. Retrieved November 5, 2018, from https://www.macleans.ca/education/national-reputational-ranking-2016/
[13]. Mitchell, J. (2018). New grads: tuition fee rebates across Canada. Retrieved July 9, 2018, from http://www.debt101.ca/content/tuition-fee-rebates-across-canada
[14]. Siddiq, F., Nethercote, W., Lye, J., & Baroni, J. (2012). The economic impact of international students in Atlantic Canada. International Advances in Economic Research, 18(2), 239–240.
[15]. Scott, C., Safdar, S., Trilokekar, R., & El Masri, A. (2015). International students as "ideal immigrants" in Canada: A disconnect between policy makers’ assumptions and the voices of international students. Comparative and International Education, 43(3), 1–16.
[16]. Statistics Canada. (2017a). Recent trends for the population aged 15 to 64 in Canada. Retrieved May 3, 2017, from https://www12.statcan.gc.ca/census-recensement/2016/as-sa/98-200-x/2016003/98-200-x2016003-eng.cfm
[17]. Statistics Canada. (2017b). The impact of aging on labour market participation rates. Retrieved June 17, 2017, from https://www150.statcan.gc.ca/n1/pub/75-006-x/2017001/article/14826-eng.html
[18]. Statistics Canada. (2018). Population growth: migratory increase overtakes natural increase. Retrieved May 17, 2018, from https://www150.statcan.gc.ca/n1/pub/11-630-x/11-630-x2014001-eng.htm
[19]. Statistics Canada. (2019). Education indicators in Canada: An international perspective, 2018. Retrieved February 1, 2019, from https://www150.statcan.gc.ca/n1/pub/81-604-x/81-604-x2018001-eng.htm
[20]. Tremblay, K. (2005). Academic mobility and immigration. Journal of Studies in International Education, 9(3), 196–228.
[21]. Wang, C. (2018). Immigration gridlock: Assessing whether Canada’s Express Entry is an effective immigration system for international students’ transition into permanent residency? Journal of International Students, 8(2), 1059–1078.
[22]. Wang, F. (2016). The lived experiences of Canadian-born and foreign-born Chinese Canadian post-secondary students in Northern Ontario. Journal of International Students, 6(2), 451–477.
[23]. Williams, K. (2016). International students in Ontario’s postsecondary education system, 2000-2012: An evaluation of changing policies, populations and labour market entry processes. desLibris. Documents collection.
Cite this article
Chen,X. (2025). Determinants of International Student Recruitment in Canada. Journal of Applied Economics and Policy Studies,17,11-22.
Data availability
The datasets used and/or analyzed during the current study will be available from the authors upon reasonable request.
Disclaimer/Publisher's Note
The statements, opinions and data contained in all publications are solely those of the individual author(s) and contributor(s) and not of EWA Publishing and/or the editor(s). EWA Publishing and/or the editor(s) disclaim responsibility for any injury to people or property resulting from any ideas, methods, instructions or products referred to in the content.
About volume
Journal:Journal of Applied Economics and Policy Studies
© 2024 by the author(s). Licensee EWA Publishing, Oxford, UK. This article is an open access article distributed under the terms and
conditions of the Creative Commons Attribution (CC BY) license. Authors who
publish this series agree to the following terms:
1. Authors retain copyright and grant the series right of first publication with the work simultaneously licensed under a Creative Commons
Attribution License that allows others to share the work with an acknowledgment of the work's authorship and initial publication in this
series.
2. Authors are able to enter into separate, additional contractual arrangements for the non-exclusive distribution of the series's published
version of the work (e.g., post it to an institutional repository or publish it in a book), with an acknowledgment of its initial
publication in this series.
3. Authors are permitted and encouraged to post their work online (e.g., in institutional repositories or on their website) prior to and
during the submission process, as it can lead to productive exchanges, as well as earlier and greater citation of published work (See
Open access policy for details).
References
[1]. Anderson, T. (2015). Seeking internationalization: the state of Canadian higher education. Canadian Journal of Higher Education, 45(4), 166–187.
[2]. Arthur, N., & Flynn, S. (2011). Career development influences of international students who pursue permanent immigration to Canada. International Journal for Educational and Vocational Guidance, 11(3), 221–237.
[3]. Calder, M. J., Richter, S., Mao, Y., Kovacs Burns, K., Mogale, R. S., & Danko, M. (2016). International students attending Canadian universities: their experiences with housing, finances, and other issues. Canadian Journal of Higher Education, 46(2), 92–110.
[4]. Chira, S. (2013). Dreaming big, coming up short: The challenging realities of international students and graduates in Atlantic Canada. Working paper (Atlantic Metropolis Centre); No. 47 2013. Halifax, N.S.: Atlantic Metropolis Centre.
[5]. Citizenship and Immigration Canada. (2018a). Provincial Nominee Program. Retrieved June 26, 2018, from https://www.canada.ca/en/immigration-refugees-citizenship/services/immigrate-canada/provincial-nominees/eligibility.html
[6]. Citizenship and Immigration Canada. (2018b). The Express Entry Programs. Retrieved June 26, 2018, from https://www.canada.ca/en/immigration-refugees-citizenship/services/immigrate-canada/express-entry/eligibility.html
[7]. Citizenship and Immigration Canada. (2019a). Work off-campus as an international student. Retrieved February 28, 2019, from https://www.canada.ca/en/immigration-refugees-citizenship/services/study-canada/work/work-off-campus.html
[8]. Citizenship and Immigration Canada. (2019b). Get a study permit faster through the Student Direct Stream. Retrieved May 1, 2019, from https://www.canada.ca/en/immigration-refugees-citizenship/services/study-canada/study-permit/student-direct-stream.html
[9]. El Masri, A. (2016). The global competition for international students as future immigrants: The role of Ontario universities in translating government policy into institutional practice. desLibris. Documents collection.
[10]. Feng, H., & Yuqian, L. (2015). Insights on Canadian society: international students who become permanent residents in Canada. Retrieved December 10, 2015, from https://www150.statcan.gc.ca/n1/pub/75-006-x/2015001/article/14299-eng.htm
[11]. James, C. E. (2004). Assimilation to accommodation: Immigrants and the changing patterns of schooling. Education Canada, 44(4), 43–45.
[12]. Macleans. (2018). Maclean’s National Reputational Ranking. Retrieved November 5, 2018, from https://www.macleans.ca/education/national-reputational-ranking-2016/
[13]. Mitchell, J. (2018). New grads: tuition fee rebates across Canada. Retrieved July 9, 2018, from http://www.debt101.ca/content/tuition-fee-rebates-across-canada
[14]. Siddiq, F., Nethercote, W., Lye, J., & Baroni, J. (2012). The economic impact of international students in Atlantic Canada. International Advances in Economic Research, 18(2), 239–240.
[15]. Scott, C., Safdar, S., Trilokekar, R., & El Masri, A. (2015). International students as "ideal immigrants" in Canada: A disconnect between policy makers’ assumptions and the voices of international students. Comparative and International Education, 43(3), 1–16.
[16]. Statistics Canada. (2017a). Recent trends for the population aged 15 to 64 in Canada. Retrieved May 3, 2017, from https://www12.statcan.gc.ca/census-recensement/2016/as-sa/98-200-x/2016003/98-200-x2016003-eng.cfm
[17]. Statistics Canada. (2017b). The impact of aging on labour market participation rates. Retrieved June 17, 2017, from https://www150.statcan.gc.ca/n1/pub/75-006-x/2017001/article/14826-eng.html
[18]. Statistics Canada. (2018). Population growth: migratory increase overtakes natural increase. Retrieved May 17, 2018, from https://www150.statcan.gc.ca/n1/pub/11-630-x/11-630-x2014001-eng.htm
[19]. Statistics Canada. (2019). Education indicators in Canada: An international perspective, 2018. Retrieved February 1, 2019, from https://www150.statcan.gc.ca/n1/pub/81-604-x/81-604-x2018001-eng.htm
[20]. Tremblay, K. (2005). Academic mobility and immigration. Journal of Studies in International Education, 9(3), 196–228.
[21]. Wang, C. (2018). Immigration gridlock: Assessing whether Canada’s Express Entry is an effective immigration system for international students’ transition into permanent residency? Journal of International Students, 8(2), 1059–1078.
[22]. Wang, F. (2016). The lived experiences of Canadian-born and foreign-born Chinese Canadian post-secondary students in Northern Ontario. Journal of International Students, 6(2), 451–477.
[23]. Williams, K. (2016). International students in Ontario’s postsecondary education system, 2000-2012: An evaluation of changing policies, populations and labour market entry processes. desLibris. Documents collection.