


1. Introduction
Canada faces serious challenges in population growth and skill/labour shortages. The decline in fertility rates and the aging of the resident population have resulted in a continuously declining natural population growth since 1961 [1]. International students become an increasingly crucial contributor to the labour market in Canada. Their advanced English-language skills, local educational credentials, and high level of sociocultural adaptation skills make them ideal candidates of permanent immigration in Canada. Therefore, it is necessary to identify important factors that influence international students’ decisions to stay in Canada after graduation.
In order to explore the determinants of international students’ geographic distribution in Canada, this essay focuses on analyzing the determinants of international students’ choice of province in which they reside in Canada after graduation. Using the retention model for international graduates with panel data, the regression results showed that international students tend to choose a province with higher average hourly wage rate and lower unemployment rate to reside. Moreover, the implementation of relevant federal and provincial immigration policies also have a positive impact of retaining international students in Canada.
The article is organized as follows. First, section 2 introduces the background information, including an overview of Canada’s demographic statistics, advantages and barriers of international student retention, and the relevant immigration policies. Next, section 3 presents a brief review of the literature on international students’ retention. Section 4 discusses the methodology employed, the data analysis, and the estimation and results, including the most important findings. The last section provides the conclusion and suggestions for improving retention of international students in Canada.
2. Background
2.1. Demographic Challenges in Canada
The four Atlantic provinces have been facing the most serious demographic challenges within Canada. In 2016, the four Atlantic provinces had the lowest percentage of population growth (-0.5% in New Brunswick, +0.2% in Nova Scotia, +1.0% in Newfoundland and Labrador, and +1.9% in Prince Edward Island) and the highest proportions of its population between 55 and 64 years in the country (24.7% in Newfoundland and Labrador, 24.6% in New Brunswick, 24.2% in Nova Scotia, and 23.8% in Prince Edward Island) [2]. Immigration retention rates in the four Atlantic provinces are also much lower than in the other provinces. Fewer than half of economic immigrants file taxes in the region five years after landing [3]. During the period of 2011 to 2015, the immigrant retention rate in Nova Scotia was 72%, in Newfoundland and Labrador was 56%, in New Brunswick was 52%, and in Prince Edward Island was just 18%, while no province outside Atlantic Canada had a retention rate below 80% [4]. Furthermore, the problem of immigrant regionalization causes the regional imbalances of population in Canada [5]. As shown in figure 1, in 2016, the percentage of new immigrants living in the Atlantic provinces was only 2.3%, compared to the highest number of recent immigrants in Ontario at 39.0% [6]. Regional imbalances of population decreases the local economic activities in smaller regions, since their demands for goods and services rely on the population size of the region [5]. For instance, some areas in Cape Breton are suffering from labour shortages in tourism, hospitality, and the fisheries [4]. It is vital to retain skilled immigrants in Atlantic Canada and the Prairie Provinces to address economic challenges.
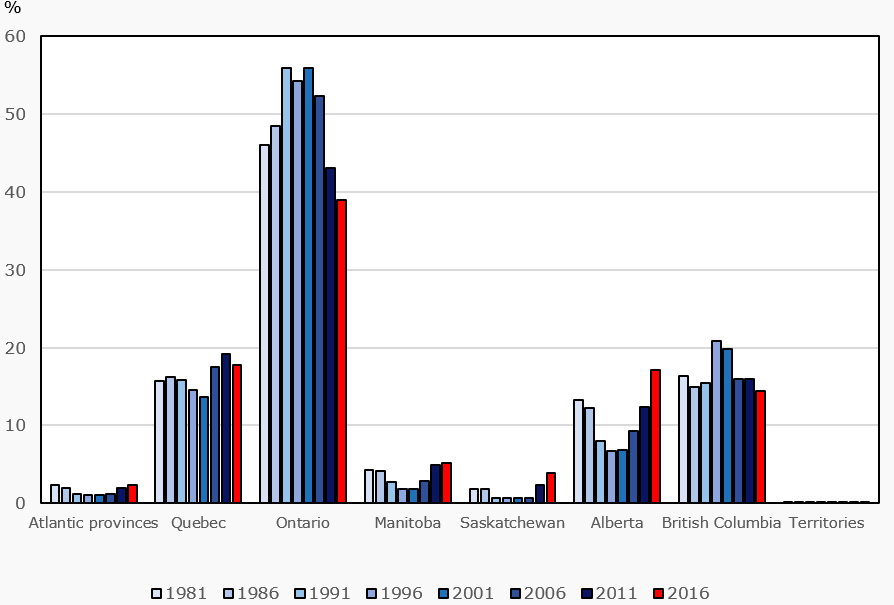
Figure 1. Distribution (in percentage) of recent immigrants in Canada by provinces and territories, 1981 to 2016
Source: Statistics Canada, Census of Population, 1981 to 2006, 2016; 2011 National Household Survey
2.2. Benefits of International Students’ Retention
International students are the most desirable source of skilled immigrants for receiving countries [7]. As compared to other immigrants, international students are more familiar with the receiving country’s governmental systems, employment practices, job routines, and lifestyles, which limits the cost and time for them to enter the labour market [8]. Their valuable skills, high language proficiency, recognized credentials, country-specific experience, and social connections greatly contribute to their integration into the receiving country’s society [9]. Canada benefits from retaining international students since they have already partially integrated into local societies and have continuously contributed to the Canadian economy and society.
2.3. Barriers to International Students’ Retention
After graduating from a Canadian institution, international students usually have a hard time finding a suitable position in Canada. Most international students only emphasize their technical qualifications, and lack cultural awareness during the hiring process, and they are unfamiliar with the “unwritten rules” of Canadian work culture and expected workplace behaviours. As a consequence, international students face difficulties in retaining jobs and succeeding in their careers [10]. Moreover, some employers value work experience acquired in Canada much more than education acquired in Canada, some employers hesitate to hire foreign students because of their status, and some employers are confused about the regulations of hiring non-Canadian students [11]. Racism represents an additional barrier to the retention and integration of international students in Canada [12]. International students also feel rejected in the Canadian labour market during the hiring process due to their lack of citizenship [13]. These barriers to entering the labour market have a negative impact on international students’ sense of belonging and their decisions to continue their stay in Canada.
2.4. Policies for Retaining International Students
The Canadian governments has been actively making efforts to issue policies to retain international students permanently after graduation, including the implementation of the Provincial Nominee Program (PNP) aimed at international students, the elimination of the Off-Campus Work Permit (OCWP), the extension of the Post-Graduate Work Permit (PGWP), the implementation of the Express Entry (EE) system and the Canadian Experience Class (CEC), the introduction of tuition fee rebate programs, and the introduction of the Student Partners Program (SPP) and the Student Direct Stream (SDS). The implementation of these immigration policies on international students might have a positive impact of retaining potential skilled labour in Canada.
2.4.1. Provincial Nominee Program Aimed at International Students
The Provincial Nominee Program is a "provincially operated immigration program, which allows a province to nominate a foreign national for Canadian permanent residence" [14]. Each province and territory has its own streams and criteria for their Provincial Nominee Programs. These policies are available to international students who have completed studies within Canada, some of which will benefit students depending on the province they study in.
2.4.2. The Removal of the Off-Campus Work Permit
As of June 1, 2014, international students who are studying full-time at public post- secondary institutions are eligible to work off-campus without a work permit. They can work part time for up to 20 hours a week during a regular academic session and full time during regularly scheduled breaks between academic sessions [15].
2.4.3. Post-Graduate Work Permit Program
After graduating from an eligible Canadian designated learning institutions, international students become permitted to apply for a Post-Graduate Work Permit. Students are required to apply for this work permit within 180 days of their graduation, and this work permit is valid for up to a maximum of three years [14]. This work permit allows international students to work on a full-time basis with little restriction on the type of employment or location, and to gain valuable Canadian work experience.
2.4.4. The Canadian Experience Class and the Express Entry system
The Canadian Experience Class was introduced in 2008 to provide "a pathway for international students, recent graduates, and temporary foreign workers with Canadian work experience to transition to permanent residence (PR)" [16]. In 2015, the Canadian Experience Class became to a category of Express Entry. The Express Entry system manages PR applications from economic classes of immigrants which include graduated international students on a post-graduation work permit, and ensures timely processing of PR applications [16]. Citizenship and Immigration Canada (CIC) assesses candidates’ applications based on human capital and demographic factors such as age, education, work experience, language ability, and details on job offers. Eligible candidates will be invited to apply for PR based on their Comprehensive Ranking System scores [17].
2.4.5. Tuition Fee Rebate Programs
Tuition fee rebate programs provide new graduates with a rebate of up to 60% on their eligible tuition fees in order to reduce new graduates’ provincial income taxes. New Brunswick, Manitoba, Saskatchewan, and Nova Scotia have offered generous tuition tax rebates for new graduates regardless of the field of study in order to retain them over a number of years [18]. These programs provide an extra financial incentive for international students to stay in Canada after graduation.
2.4.6. Student Partners Program and Student Direct Stream
In 2009, the Student Partners Program was created as a pilot program between the Association of Canadian Community Colleges (ACCC), the Government of Canada and the Canadian High Commission in order to increase the number of study permits and to simplify the student visa process for India and China (Williams, 2016). In 2018, Refugees and Citizenship Canada (IRCC) have further improved the student partners program to the Student Direct Stream. International students who are from China, India, Vietnam and the Philippines can get their study permits within twenty calendar days by using the Student Direct Stream [19].
3. Literature Review
Many researchers have made significant contributions on studying the impact of retaining international students on the local labour market. They pointed out barriers to retaining and attracting international students and given suggestions as how to integrate international students across the country. Due to limited research about international students’ geographic distribution in Canada, this study focuses on contributing factors that influence the retention of international students in Canada.
Enhanced job opportunities and high standard of living motivate international students to settle in Canada; however, international students encounter obstacles after graduation, such as a lack of employment networks and being discriminated against because of race and accents [20]. The fear of employment instability, cultural differences, and language difficulties with social isolation and limited availability and quality of jobs affect international students’ future decisions about staying in Canada [21]. Language is one of the serious barriers for international students to find employment in Canada. In recent years, the Canadian government has funded a variety of programs for non-native speakers to improve their language ability and soft skills on workplace communication, including "Occupation-Specific Language Training (OSLT)", "Employment-related language training" in Refugees and Citizenship Canada, and "language training both for the workplace and in the workplace” in Ontario’s Ministry of Citizenship and Immigration [10]. The lengthy processing times is another barrier to making a greater use of international students in the Canadian labour market. Although the Express Entry applications are being processed within six months, the provincial nominee applications take sixteen months to be processed by the federal government, which is a challenge for employers who want to hire workers quickly [3]. The federal government needs to ensure that they have sufficient resources to process all economic applications in a timely manner [3]. Moreover, the local immigration partnership dedicate itself to improving international students’ integration across the country, and treat issues of employment, language, housing, and social inclusion as main priorities to tackle, thereby addressing the growing need for a skilled labour force in local communities [4].
International graduates face challenges to finding suitable employment after graduation because of the gap between the supply and demand of skills in the Canadian labour market. Employers usually assess employees’ ability based on mainstream cultural norms, which results in the exclusion of international graduates in the labour market [22]. Moreover, international graduates often have difficulty in finding the necessary information about employment opportunities in the Canadian labour market, which poses a negative impact on the development of local labour markets and Canada’s economic growth [23]. Furthermore, employers’ hiring strategies and technologies are largely based on existing Canadian social-culture networks; therefore, international graduates are often passed over during the recruitment process and miss opportunities in acquiring valuable work experience [22]. However, technological companies tend to need international graduates who are nationally and globally competitive, and banks are demanding people who can speak multiple languages in order to reach out to newcomers [24]. Employers need to change their hiring processes in response to a more diverse Canadian society [22]. Non-profit sectors should play an important role in delivering information and services to international graduates in order to reduce information barriers in the job search process [23]. In addition, governments must take action to maintain flexible immigration systems and meet the specific needs of international graduates in order to attract and retain international graduates in Canada [23].
4. Empirical Analysis
4.1. Methodology
In order to identify the determinants of international students’ choice of province in which to reside in Canada after graduation, I estimated the determining factors in equation 1. This equation contains the main factors which influence international graduates’ residence decisions, such as the cost of living, wage levels, and employment security in each province. These factors affect the disposable income and the standard of living of international graduates. Provincial immigration policies might also play a major role in retaining international graduates in Canada. The model specification is set as below:
\( {N_{ij}}={β_{0}}+{β_{1}}({wage_{ij}})+{β_{2}}({unemployment_{ij}})+{β_{3}}ln{({livingcost_{ij}})}+{β_{4}}({PNP_{1}}*{Y_{1}})+{β_{5}}({PNP_{2}}*{Y_{1}}) \)
\( +{β_{6}}(Rebate*{Y_{2}})+{ϵ_{ij}} \) (1)
Where Nij is the dependent variable and represents the percentage of international graduates residing in province j in each year. wageij, unemploymentij, livingcostij, PNP1∗Y1, PNP2∗Y1, and Rebate∗Y2 are the independent variables. βs are the coefficients of these independent variables. β0 indicates the constant term. wageij denotes average hourly wage rate in province j in each year. unemploymentij denotes the unemployment rate in province j in each year. The province’s labour force characteristics, job security, and employment prospects indeed affect international graduates’ choices of residency. livingcostij denotes the cost of living to reside in province j in each year. A high cost of living increases the financial pressure on inter- national graduates. PNPs and Rebate are dummy variables. Ys represents the length of policy implementation. In order to estimate the impact of time on immigration policies, each dummy variable is multiplied by the length of policy implementation Ys to become an interactive term.
PNP1 represents employment requirement of the provincial nominee program. International students can apply for the PNP without a job offer in British Columbia, Ontario, and Quebec, whereas in the remaining seven provinces in Canada, the PNP’s candidates are required to demonstrate a job offer that is related to their studies to ensure that their immigration responds to labour market needs. Therefore, I assigned PNP1=1 in British Columbia, Ontario, and Quebec, and PNP1=0 in Prince Edward Island, Nova Scotia, New Brunswick, Newfoundland and Labrador, Saskatchewa, Manitoba, and Alberta. I multiplied PNP1 by the length of PNP implementation Y1 to get the interactive term PNP1∗Y1. PNP2 represents education requirement of the provincial nominee program. International students who have graduated from an institution in a province other than their resident province and have a full-time indeterminate length job offer in the resident province can apply for the resident province’s PNP in British Columbia, Ontario, Manitoba, Saskatchewan, and Newfoundland and Labrador, whereas in the remaining five provinces in Canada, international students must have graduated from the resident province in order to be eligible to apply to the resident province’s PNP. Therefore, I assigned PNP2=1 in British Columbia, Ontario, Manitoba, Saskatchewan, and Newfoundland and Labrador, and assigned PNP2=0 in Prince Edward Island, Nova Scotia, New Brunswick, Quebec and Alberta. I multiplied PNP2 by the length of PNP implementation Y1 to get the interactive term PNP2∗Y1. Rebate represents tuition fee rebate programs. International students are eligible to receive generous tuition tax rebates regardless of field of study if they reside and work in New Brunswick, Manitoba, Saskatchewan, or Nova Scotia, whereas in the remaining six provinces in Canada, international students receive only a small portion of credit in their eligible tuition fees. Therefore, I assigned Rebate =1 in New Brunswick, Manitoba, Saskatchewan, and Nova Scotia, and assigned Rebate =0 in Prince Edward Island, Newfoundland and Labrador, British Columbia, Ontario, Quebec and Alberta. I multiplied Rebate by the length of tuition fee rebate programs implementation Y2 to get the interactive term Rebate∗Y2. The last variable ϵij is an error term.
Since provinces with a larger population have the capacity to host more international graduates than other provinces, in order to make a proper empirical analysis, I have adjusted the measurement of some variables below:
Nij: the percentage of international graduates residing in province j in each year in every 100 people
\( {N_{ij}}=\frac{The number of international graduates residing in province j in each year}{Total population in province j in each year ({Pop_{ij}})/100}*100\% \)
4.2. Data Source
In order to estimate the model, I used panel data from Statistics Canada between 2006 and 2016 to conduct the regression analysis. Information on the percentage of international graduates residing in each province in each year in every 100 people is taken from “Statistics Canada, CAN- SIM, table 43-10-0012-01 and table 17-10-0134-01”. Information on average hourly wage rate in each province in each year is taken from “Statistics Canada, CANSIM, table 14-10-0340-01”. Information on the unemployment rate in each province in each year is taken from “Statistics Canada, CANSIM, table 282-0123”. Information on the cost of living in each province is taken from “Statistics Canada, CANSIM, table 384-0038”. Information on the region’s immigration policies is taken from “Citizenship and Immigration Canada”.
Due to the absence of statistical information on some explanatory variables, the observation years are from 2006 to 2016. After merging raw datasets, the final dataset contains 110 observations. Each observation corresponds to the percentage of international graduates residing in each province in each year in every 100 people, the average hourly wage rate in each province in each year, the unemployment rate in each province in each year, the cost of living in each province in each year, and the region’s immigration policies.
4.3. Estimation and Results
4.3.1. Descriptive Statistics
Table 1 and table 2 show that the means and standard deviations of the dependent variable and the independent variables that were used in the estimations. These tables make a clear comparison between the means and standard deviations of each variable in each province and in each year between 2006 and 2016. Each year contains 10 observations and each province contains 11 observations, equaling 110 observation in total.
As shown in table 1, the percentage of international students residing in Canada increased from 2006 to 2016. The average hourly wage rate in Canada steadily increased from 2006 to 2016, and the cost of living in Canada slightly increased during this period. The trend of unemployment rate in Canada was unstable between 2006 and 2016.
Table 1. Descriptive Summary of Data by Year
Variable’s name Year | Nij | ln(livingcostij) | wageij | unemploymentij | ||||
Mean | Std. | Mean | Std. | Mean | Std. | Mean | Std. | |
2006 | 3.242 | 1.553 | 10.049 | 1.420 | 18.126 | 1.943 | 7.420 | 3.511 |
2007 | 3.173 | 1.452 | 10.555 | 1.419 | 18.894 | 2.025 | 6.930 | 3.132 |
2008 | 3.720 | 1.486 | 10.605 | 1.414 | 19.838 | 2.090 | 7.050 | 3.194 |
2009 | 3.499 | 1.706 | 10.617 | 1.406 | 20.646 | 2.102 | 8.730 | 3.152 |
2010 | 3.421 | 1.403 | 10.667 | 1.405 | 21.268 | 1.998 | 8.640 | 2.858 |
2011 | 3.144 | 1.405 | 10.713 | 1.403 | 21.760 | 2.026 | 8.120 | 2.497 |
2012 | 4.296 | 2.186 | 10.748 | 1.402 | 22.511 | 2.173 | 7.980 | 2.709 |
2013 | 5.752 | 4.239 | 10.788 | 1.404 | 23.068 | 2.339 | 7.850 | 2.748 |
2014 | 6.258 | 4.314 | 10.830 | 1.410 | 23.574 | 2.350 | 7.640 | 2.682 |
2015 | 5.869 | 3.755 | 10.854 | 1.416 | 24.095 | 2.459 | 7.880 | 2.491 |
2016 | 6.016 | 2.573 | 10.879 | 1.418 | 24.561 | 2.518 | 8.200 | 2.403 |
Total | 4.399 | 2.789 | 10.704 | 1.350 | 21.667 | 2.920 | 7.858 | 2.793 |
As shown in table 2, Prince Edward Island, Nova Scotia, New Brunswick, and Newfoundland and Labrador had the lowest percentage of international graduates in the country during 2006 to 2016, whereas British Columbia had the highest percentage of international graduates during this period. Ontario and Quebec had the highest cost of living in the country between 2006 and 2016, and Alberta and Ontario had the highest average hourly wage rate in Canada during this period. The four Atlantic provinces had the highest unemployment rate in the country between 2006 and 2016.
Table 2. Descriptive Summary of Data by Province
Variable’s name Province | Nij | ln(livingcostij) | wageij | unemploymentij | ||||
Mean | Std. | Mean | Std. | Mean | Std. | Mean | Std. | |
NL | 1.497 | 0.269 | 9.528 | 0.149 | 21.350 | 2.950 | 13.309 | 1.252 |
PEI | 2.733 | 1.268 | 8.212 | 0.118 | 18.714 | 1.912 | 11.000 | 0.513 |
NS | 2.882 | 0.882 | 10.154 | 0.106 | 19.984 | 1.992 | 8.672 | 0.637 |
NB | 2.062 | 0.282 | 9.873 | 0.109 | 19.340 | 1.821 | 9.254 | 0.841 |
QC | 4.096 | 0.741 | 12.204 | 0.108 | 21.515 | 1.740 | 7.709 | 0.434 |
ON | 5.610 | 0.938 | 12.830 | 0.118 | 23.488 | 1.753 | 7.373 | 0.956 |
MB | 5.128 | 1.855 | 10.384 | 0.131 | 20.775 | 1.887 | 5.163 | 0.602 |
SK | 6.812 | 5.374 | 10.308 | 0.161 | 22.810 | 2.846 | 4.709 | 0.699 |
AB | 6.082 | 2.330 | 11.723 | 0.146 | 25.763 | 2.734 | 5.191 | 1.484 |
BC | 7.090 | 1.565 | 11.829 | 0.132 | 22.930 | 1.759 | 6.200 | 1.208 |
Total | 4.399 | 2.789 | 10.704 | 1.350 | 21.667 | 2.920 | 7.858 | 2.793 |
4.3.2. Pearson Correlation Coefficient and Variance Inflation Factors
The existence of multicollinearity results in imprecise estimates of coefficient values and invalid regression results of individual predictors. In order to test whether multicollinearity exists among selected variables, the Pearson correlation coefficient and the Variance Inflation Factor are used for estimations. The Pearson correlation coefficient measures the linear correlation between two variables. As represented in table 3, no highly correlated selected variable exists in this model.
Table 3. Estimation Results of the Pearson Correlation Coefficient
Nij | wageij | unemploymentij | ln(livingcostij) | PNP1 ∗ Y1 | PNP2 ∗ Y1 | rebate ∗ Y2 | |
Nij | 1.000 | ||||||
wageij | 0.468*** | 1.000 | |||||
unemploymentij | 0.645*** | 0.567*** | 1.000 | ||||
ln(livingcostij) | -0.577*** | -0.518*** | -0.330*** | 1.000 | |||
PNP1 ∗ Y1 | 0.190** | 0.569*** | 0.176* | -0.118 | 1.000 | ||
PNP2 ∗ Y1 | 0.337*** | 0.015 | 0.299*** | -0.014 | -0.071 | 1.000 | |
Reabte ∗ Y2 | 0.164* | -0.197** | 0.045 | -0.146 | -0.301*** | 0.237*** | 1.000 |
* p < 0.1, ** p < 0.05, *** p < 0.01
The Variance Inflation Factor provides an index that measures how much the variance of an estimated regression coefficient is increased because of collinearity. Table 4 shows that the mean variance inflation factor has an acceptable value at 1.83. Based on the results in table 3 and table 4, no multicollinearity exists in the international graduates’ retention model.
Table 4. Estimation Results of Variance Inflation Factor
Variable | VIF | 1/VIF |
wageij | 3.33 | 0.299 |
unemploymentij | 1.80 | 0.556 |
ln(livingcostij) | 1.59 | 0.628 |
PNP1 ∗ Y1 | 1.82 | 0.549 |
PNP2 ∗ Y1 | 1.19 | 0.839 |
Rebate ∗ Y2 | 1.24 | 0.806 |
Mean VIF | 1.83 | |
4.3.3. The Estimation Results
Table 5 shows that the estimation results of the fixed effects model, the random effects model, and the pooled regression model. In order to choose among the regression results of the fixed effects model, the random effects model, and the pooled regression model, the Breusch and Pagan Lagrange multiplier test and the Hausman test were employed for estimations. The results of the Pagan Lagrange multiplier test are shown in table 6, and the results of the Hausman test are represented in table 7.
Table 5. Regression Results of the International Graduates’ Retention Model
(1) FE | (2) RE | (3) POLS | |
Nij | Nij | Nij | |
wageij | -0.754 | 0.440*** | 0.475*** |
(0.483) | (0.092) | (5.98) | |
unemploymentij | -0.182 | -0.375*** | -0.430*** |
(-0.90) | (-3.41) | (-5.49) | |
ln(livingcostij) | 21.490** | -0.050 | -0.239 |
(2.38) | (-0.15) | (-1.02) | |
PNP1 ∗ Y1 | -0.219 | 0.045 | 0.060* |
(-1.61) | (0.92) | (1.80) | |
PNP2 ∗ Y1 | 0.138 | 0.070 | 0.063* |
(1.49) | (4.07) | (2.06) | |
Rebate ∗ Y2 | 0.085 | 0.147* | 0.064 |
(0.65) | (1.80) | (0.98) | |
_cons | -207.603** | -2.443 | -0.620 |
(-2.40) | (-0.68) | (-0.25) | |
N | 110 | 110 | 110 |
R-squared | 0.4231 | 0.3735 | 0.5790 |
t statistics in parentheses
* p < 0.1, ** p < 0.05, *** p < 0.01
The null hypothesis in the Breusch and Pagan Lagrange multiplier test is that variance across entities is zero. That is, there is no significant difference across units and no panel effect exists. As represented in table 6, the result of the Pagan Lagrange multiplier test is Prob > chibar2 = 0.0613, which rejects the null hypothesis at 10% significance level and concludes that the random effects model is more appropriate than the pooled regression model.
Table 6. Estimated Results of the Breusch and Pagan Lagrange Multiplier Test
Var | sd=squrt(Var) | |
Nij | 7.782322 | 2.789681 |
e | 2.711406 | 1.646635 |
u | 0.5216949 | 0.7222845 |
Test: Var(u) = 0 | chibar2(01) =2.38 | Prob > chibar2 = 0.0613 |
The null hypothesis in the Hausman test is that the difference in coefficients is not systematic. That is, the unique errors are not correlated with the regressors. As shown in table 7, the result of the Hausman test is Prob > chi2 = 0.1990, which fails to reject the null hypothesis and concludes that the random effects model is more appropriate than the fixed effects model.
Table 7. Results of the Hausman Test
fe | re | Difference | S.E. | |
wageij | 21.4609 | -0.0507486 | 21.51164 | 9.0244 |
unemploymentij | -0.7548913 | 0.440647 | -1.195538 | 0.4744715 |
ln(livingcostij) | -0.1829543 | -0.3754673 | 0.1925131 | 0.1713285 |
PNP1 ∗ Y1 | -0.219894 | 0.0459361 | -0.2658301 | 0.1274113 |
PNP2 ∗ Y1 | 0.1386543 | 0.0709695 | 0.0676848 | 0.1042668 |
Rebate ∗ Y2 | 0.0859252 | 0.1476859 | -0.0617608 | 0.1024098 |
chi2(7) =136.37 | Prob >chi2 = 0.1990 | |||
Based on the Breusch and Pagan Lagrange multiplier test and the Hausman test results, the regression results of the random effects model are used in the international graduates’ retention model. The result of the regression model is set as equation 2:
\( {N_{ij}}=-2.443+0.440({wage_{ij}})-0.375({unemployment_{ij}})-0.0050ln{({livingcost_{ij}})}+0.045({PNP_{1}}*{Y_{1}}) \)
\( +0.070({PNP_{2}}*{Y_{1}})+0.147(Rebate*{Y_{2}})+{ϵ_{ij}} \) (2)
Table 5 shows that wageij and unemploymentij are significant at 1% significance level, and Rebate ∗ Y2 is significance at 10% significant level in the international graduates’ retention model. The R-squared is 0.3735, which denotes that 37.35 percent of samples could be explained by the independent variables.
The coefficient of variable wageij is s positive, which denotes that the percentage of international graduates in every 100 people increases by 0.440% for every additional increase of average hourly wage rate. The coefficient of unemploymentij is negative, which denotes that the percentage of international graduates in every 100 people decreases by 0.375% for every additional increase of unemployment rate. The coefficient of Rebate∗Y2 is positive, which denotes that the percentage of international graduates in every 100 people increases by 0.147% for every additional year of Rebate implementation. The coefficient of ln(livingcostij), PNP1∗Y1, and PNP2∗Y1 are insignificant, which denotes that the cost of living and the provincial nominee program did not have a significant impact on retaining international graduates in Canada. The reason that these variables have been insignificant could be attributed to the sample size.
In order to identify the effects of both provincial and federal immigration policies on international students’ choice of province in which to reside in Canada after graduation, I estimate the determining factors in a pooled regression model. The model specification is set as equation (3) below:
\( {N_{ij}}={β_{0}}+{β_{1}}({wage_{ij}})+{β_{2}}({unemployment_{ij}})+{β_{3}}ln{({livingcost_{ij}})}+{β_{4}}({PNP_{1}})+{β_{5}}({PNP_{2}})+{β_{6}}(Rebate) \)
\( +{β_{7}}(OCWP)+{β_{8}}(PGWP)+{β_{9}}(EE)+{β_{10}}(SPP)+{ϵ_{ij}} \) (3)
Where immigration policies are dummy variables. PNP1 represents the boarder of employment requirement in certain provinces under the PNP. PNP2 represents the boarder of education requirement in certain provinces under the PNP. Rebate represents tuition fee rebate programs. OCWP represents the removal of the Off-Campus Work Permit, PGWP represents the extension of the Post-Graduate Work Permit, EE represents the Express Entry, and SPP represents the Student Partners Program. I assigned policys=0 if policies were not implemented, and policys=1 if policies were implemented. The estimation results of the pooled regression model is shown in table 8.
Table 8. Regression Results of the Retention Model with Policies Variables
Nij | |
wageij | 0.779*** |
(5.02) | |
unemploymentij | -0.457*** |
(-5.06) | |
ln(livingcostij) | -1.296*** |
(-3.68) | |
PNP1 | 3.453*** |
(4.04) | |
PNP2 | 0.210 |
(0.56) | |
Rebate | 0.979* |
(1.80) | |
OCWP | 0.864 |
(1.38) | |
PGWP | -0.620 |
(-0.88) | |
EE | -0.672 |
(-1.00) | |
SPP | -0.675 |
(-0.96) | |
_cons | 4.429 |
(1.44) | |
N | 110 |
R-squared | 0.6245 |
t statistics in parentheses
* p< 0.1, ** p< 0.05, *** p< 0.01
In order to test whether multicollinearity exists among selected variables, the Variance Inflation Factor is used for estimations. Table 9 shows that the mean variance inflation factor has an acceptable value at 3.99. Therefore, no multicollinearity exists in the pooled regression model.
Table 9. Estimation Results of Variance Inflation Factor
Variable | VIF | 1/VIF |
wageij | 7.65 | 0.130 |
unemploymentij | 2.38 | 0.419 |
ln(livingcostij) | 8.47 | 0.118 |
PNP1 | 5.77 | 0.173 |
PNP2 | 1.31 | 0.761 |
Rebate | 2.43 | 0.411 |
OCWP | 2.92 | 0.342 |
PGWP | 2.78 | 0.360 |
EE | 2.54 | 0.393 |
SPP | 3.70 | 0.269 |
Mean VIF | 3.99 | |
Based on table 8, the result of the international students’ migration model with policies variables is set as equation (4):
\( {N_{ij}}=4.429+0.779({wage_{ij}})-0.547({unemployment_{ij}})-1.296ln{({livingcost_{ij}})}+3.453({PNP_{1}})+0.210({PNP_{2}}) \)
\( +0.979(Rebate)+0.864(OCWP)-0.620(PGWP)-0.672(EE)-0.675(SPP)+{ϵ_{ij}} \) (4)
According to table 8, wageij, unemploymentij, ln(livingcostij), and PNP1 are significant at 1% significance level, and Rebate are significant at 10% significance level in the pooled regression model. The R-squared is 0.6245, which denotes that 62.45 percent of samples could be explained by the independent variables. The reason that other variables have been insignificant could be attributed to the sample size.
The coefficient of variable wageij is positive, which denotes that the percentage of international graduates in every 100 people increases by 0.779% for every additional increase of average hourly wage rate. The coefficient of unemploymentij is negative, which denotes that the percentage of international graduates in every 100 people decreases by 0.457% for every additional increase of unemployment rate. The coefficient of ln(livingcostij) is negative, which denotes that a 1% increase in the cost of living decreases 1.296% of international graduates in every 100 people. The coefficient of PNP1 is positive, which denotes that the boarder of employment requirement in certain provinces under the provincial nominee program increases 3.453% of international graduates in every 100 people. The coefficient of Rebate is positive, which denotes that the implementation of tuition fee rebate programs increases 0.979% of international graduates in every 100 people. PNP2, OCWP, PGWP, EE and SPP have been insignificant, which denotes that the boarder of education requirement in certain provinces under the provincial nominee program, the removal of the Off-Campus Work Permit, the extension of the Post-Graduate Work Permit, the implementation of the Express Entry, and the introduction of the Student Partners Program did not have a significant impact on retaining international graduates to reside in Canada during 2006 to 2016.
In sum, the regression results of the new pooled regression model in equation (4) reinforce the results of the previous model in equation (2). High average hourly wage rate, low unemployment rate, low cost of living, the implementation of tuition fee rebate programs and the boarder of employment requirement in certain provinces under the PNP have positively influenced international students’ retention in Canada. The boarder of education requirement in certain provinces under the PNP, the removal of the Off-Campus Work Permit, the extension of the Post-Graduate Work Permit, the implementation of the Express Entry, and the introduction of the Student Partners Program did not retain more international graduates in Canada.
5. Conclusions and Suggestions
Using panel data for the period from 2006 to 2016 covering 10 provinces of Canada, this paper analyzes the determinants of international student retention in Canada. The above research and analysis of the international graduates’ retention model state that high average hourly wage rate, low unemployment rate, and the implementation of tuition fee rebate programs have positively influenced international students’ retention in Canada. This study also finds that immigration policies play an important role in the retention of international students. The boarder employment requirement in certain provinces under the provincial nominee program and the implementation of tuition fee rebate programs positively influenced the retention of international graduates, whereas the boarder education requirement in certain provinces under the provincial nominee program, the removal of the Off-Campus Work Permit, the extension of the Post-Graduate Work Permit, the implementation of the Express Entry, and the introduction of the Student Partners Program did not have a significant impact on retaining international graduates to reside in Canada during 2006 to 2016. Furthermore, the length of tuition fee rebate programs implementation are positively associated with the percentage of international graduates in Canada.
Due to the challenges in population growth and skill/labour shortages, Canada requires more young and skilled international students to fill job vacancies. In order to expand the share of international students in Canada, governments and local communities must consider the barriers they face in integrating into Canadian society and making efforts to introduce policies. Governments should show international students that Canada is an attractive country with a career future and multiculturalism, and build a more acceptable and welcoming community to retain more international students in Canada.
References
[1]. Akbari, A. (2011). Labor market performance of immigrants in smaller regions of western countries: Some evidence from Atlantic Canada. Journal of International Migration and Integration, 12(2), 133–154.
[2]. Arthur, N., & Flynn, S. (2011). Career development influences of international students who pursue permanent immigration to Canada. International Journal for Educational and Vocational Guidance, 11(3), 221–237.
[3]. Bartel, J. (2018). Teaching soft skills for employability. TESL Canada Journal, 35(1), 78–92.
[4]. Bond, S., Areepattamannil, S., Brathwaite-Sturgeon, G., Hayle, E., & Malekan, M. (2007). Northern lights: international graduates of Canadian institutions and the national workforce. Canadian Bureau for International Education (CBIE).
[5]. Chira, S. (2013). Dreaming big, coming up short: The challenging realities of international students and graduates in Atlantic Canada. Working paper (Atlantic Metropolis Centre); No. 47 2013. Halifax, N.S.: Atlantic Metropolis Centre.
[6]. Citizenship and Immigration Canada. (2018a). Provincial Nominee Program. Retrieved June 26, 2018, from https://www.canada.ca/en/immigration-refugees-citizenship/services/immigrate-canada/provincial-nominees/eligibility.html
[7]. Citizenship and Immigration Canada. (2018b). The Express Entry Programs. Retrieved June 26, 2018, from https://www.canada.ca/en/immigration-refugees-citizenship/services/immigrate-canada/express-entry/eligibility.html
[8]. Citizenship and Immigration Canada. (2019a). Work off-campus as an international student. Retrieved February 28, 2019, from https://www.canada.ca/en/immigration-refugees-citizenship/services/study-canada/work/work-off-campus.html
[9]. Citizenship and Immigration Canada. (2019b). Get a study permit faster through the Student Direct Stream. Retrieved May 1, 2019, from https://www.canada.ca/en/immigration-refugees-citizenship/services/study-canada/study-permit/student-direct-stream.html
[10]. Drolet, J. (2014). The role of employers in bridging newcomers’ absorption and integration in the Canadian labour market: A knowledge synthesis project. desLibris. Documents collection.
[11]. El Masri, A. (2016). The global competition for international students as future immigrants: The role of Ontario universities in translating government policy into institutional practice. desLibris. Documents collection.
[12]. Giwa, S. (2018). Newfoundland needs immigrants and anti-racism action now. The Canadian Press.
[13]. Liu, E. (2007). A descriptive study of employers’ attitudes and practices in hiring newcomer job seekers: The study in brief. CERIS policy matters; No. 31, Nov. 2007. Toronto, Ont.: CERIS.
[14]. Mitchell, J. (2018). New grads: tuition fee rebates across Canada. Retrieved July 9, 2018, from http://www.debt101.ca/content/tuition-fee-rebates-across-canada
[15]. Rai, V. (2013). Labour market information for employers and economic immigrants in Canada: A country study. CSLS research report; 2013-01. Ottawa, Ont.: Centre for the Study of Living Standards.
[16]. Raghuram, P. (2013). Theorizing the spaces of student migration. Population, Space and Place, 19(2), 138–154.
[17]. Shannon, C. (2018). Figuring out what makes C.B. attractive to immigrants. Chronicle-Herald.
[18]. Statistics Canada. (2017a). Infographic: Population growth in Canada, 2016 Census of Population. Retrieved February 8, 2017, from https://www150.statcan.gc.ca/n1/pub/11-627-m/11-627-m2017005-eng.htm
[19]. Statistics Canada. (2017b). Immigration and ethnocultural diversity: Key results from the 2016 Census. Retrieved October 25, 2017, from https://www150.statcan.gc.ca/n1/daily-quotidien/171025/dq171025b-eng.htm
[20]. Statistics Canada. (2018). Population growth: Migratory increase overtakes natural increase. Retrieved May 17, 2018, from https://www150.statcan.gc.ca/n1/pub/11-630-x/11-630-x2014001-eng.htm
[21]. Thomson, A. (2017). More immigrants coming to Atlantic Canada, but retention rates low: Report. The Canadian Press.
[22]. Tremblay, K. (2005). Academic mobility and immigration. Journal of Studies in International Education, 9(3), 196–228.
[23]. Wang, C. (2018). Immigration gridlock: Assessing whether Canada’s Express Entry is an effective immigration system for international students’ transition into permanent residency? Journal of International Students, 8(2), 1059–1078.
[24]. Williams, K. (2016). International students in Ontario’s postsecondary education system, 2000-2012: An evaluation of changing policies, populations and labour market entry processes. desLibris. Documents collection.
Cite this article
Chen,X. (2025). Determinants of International Student Retention in Canada. Journal of Applied Economics and Policy Studies,17,23-32.
Data availability
The datasets used and/or analyzed during the current study will be available from the authors upon reasonable request.
Disclaimer/Publisher's Note
The statements, opinions and data contained in all publications are solely those of the individual author(s) and contributor(s) and not of EWA Publishing and/or the editor(s). EWA Publishing and/or the editor(s) disclaim responsibility for any injury to people or property resulting from any ideas, methods, instructions or products referred to in the content.
About volume
Journal:Journal of Applied Economics and Policy Studies
© 2024 by the author(s). Licensee EWA Publishing, Oxford, UK. This article is an open access article distributed under the terms and
conditions of the Creative Commons Attribution (CC BY) license. Authors who
publish this series agree to the following terms:
1. Authors retain copyright and grant the series right of first publication with the work simultaneously licensed under a Creative Commons
Attribution License that allows others to share the work with an acknowledgment of the work's authorship and initial publication in this
series.
2. Authors are able to enter into separate, additional contractual arrangements for the non-exclusive distribution of the series's published
version of the work (e.g., post it to an institutional repository or publish it in a book), with an acknowledgment of its initial
publication in this series.
3. Authors are permitted and encouraged to post their work online (e.g., in institutional repositories or on their website) prior to and
during the submission process, as it can lead to productive exchanges, as well as earlier and greater citation of published work (See
Open access policy for details).
References
[1]. Akbari, A. (2011). Labor market performance of immigrants in smaller regions of western countries: Some evidence from Atlantic Canada. Journal of International Migration and Integration, 12(2), 133–154.
[2]. Arthur, N., & Flynn, S. (2011). Career development influences of international students who pursue permanent immigration to Canada. International Journal for Educational and Vocational Guidance, 11(3), 221–237.
[3]. Bartel, J. (2018). Teaching soft skills for employability. TESL Canada Journal, 35(1), 78–92.
[4]. Bond, S., Areepattamannil, S., Brathwaite-Sturgeon, G., Hayle, E., & Malekan, M. (2007). Northern lights: international graduates of Canadian institutions and the national workforce. Canadian Bureau for International Education (CBIE).
[5]. Chira, S. (2013). Dreaming big, coming up short: The challenging realities of international students and graduates in Atlantic Canada. Working paper (Atlantic Metropolis Centre); No. 47 2013. Halifax, N.S.: Atlantic Metropolis Centre.
[6]. Citizenship and Immigration Canada. (2018a). Provincial Nominee Program. Retrieved June 26, 2018, from https://www.canada.ca/en/immigration-refugees-citizenship/services/immigrate-canada/provincial-nominees/eligibility.html
[7]. Citizenship and Immigration Canada. (2018b). The Express Entry Programs. Retrieved June 26, 2018, from https://www.canada.ca/en/immigration-refugees-citizenship/services/immigrate-canada/express-entry/eligibility.html
[8]. Citizenship and Immigration Canada. (2019a). Work off-campus as an international student. Retrieved February 28, 2019, from https://www.canada.ca/en/immigration-refugees-citizenship/services/study-canada/work/work-off-campus.html
[9]. Citizenship and Immigration Canada. (2019b). Get a study permit faster through the Student Direct Stream. Retrieved May 1, 2019, from https://www.canada.ca/en/immigration-refugees-citizenship/services/study-canada/study-permit/student-direct-stream.html
[10]. Drolet, J. (2014). The role of employers in bridging newcomers’ absorption and integration in the Canadian labour market: A knowledge synthesis project. desLibris. Documents collection.
[11]. El Masri, A. (2016). The global competition for international students as future immigrants: The role of Ontario universities in translating government policy into institutional practice. desLibris. Documents collection.
[12]. Giwa, S. (2018). Newfoundland needs immigrants and anti-racism action now. The Canadian Press.
[13]. Liu, E. (2007). A descriptive study of employers’ attitudes and practices in hiring newcomer job seekers: The study in brief. CERIS policy matters; No. 31, Nov. 2007. Toronto, Ont.: CERIS.
[14]. Mitchell, J. (2018). New grads: tuition fee rebates across Canada. Retrieved July 9, 2018, from http://www.debt101.ca/content/tuition-fee-rebates-across-canada
[15]. Rai, V. (2013). Labour market information for employers and economic immigrants in Canada: A country study. CSLS research report; 2013-01. Ottawa, Ont.: Centre for the Study of Living Standards.
[16]. Raghuram, P. (2013). Theorizing the spaces of student migration. Population, Space and Place, 19(2), 138–154.
[17]. Shannon, C. (2018). Figuring out what makes C.B. attractive to immigrants. Chronicle-Herald.
[18]. Statistics Canada. (2017a). Infographic: Population growth in Canada, 2016 Census of Population. Retrieved February 8, 2017, from https://www150.statcan.gc.ca/n1/pub/11-627-m/11-627-m2017005-eng.htm
[19]. Statistics Canada. (2017b). Immigration and ethnocultural diversity: Key results from the 2016 Census. Retrieved October 25, 2017, from https://www150.statcan.gc.ca/n1/daily-quotidien/171025/dq171025b-eng.htm
[20]. Statistics Canada. (2018). Population growth: Migratory increase overtakes natural increase. Retrieved May 17, 2018, from https://www150.statcan.gc.ca/n1/pub/11-630-x/11-630-x2014001-eng.htm
[21]. Thomson, A. (2017). More immigrants coming to Atlantic Canada, but retention rates low: Report. The Canadian Press.
[22]. Tremblay, K. (2005). Academic mobility and immigration. Journal of Studies in International Education, 9(3), 196–228.
[23]. Wang, C. (2018). Immigration gridlock: Assessing whether Canada’s Express Entry is an effective immigration system for international students’ transition into permanent residency? Journal of International Students, 8(2), 1059–1078.
[24]. Williams, K. (2016). International students in Ontario’s postsecondary education system, 2000-2012: An evaluation of changing policies, populations and labour market entry processes. desLibris. Documents collection.