


1. Introduction
Over the past four decades of reform and opening-up, China’s economic development has made historic strides. Gross Domestic Product (GDP) soared from 451.78 billion yuan in 1980 to 141 trillion yuan in 2024, making China the world’s second-largest economy and the primary engine of global economic recovery with a contribution rate exceeding 30% for many years. However, the traditional development model driven by factor inputs such as capital and labor now faces dual constraints: tightening environmental regulations and increasing regional imbalances. Against this backdrop, building a synergistic mechanism that balances economic development with ecological protection—and promoting regional coordination through innovation—has become central to achieving high-quality development. As an institutional innovation that breaks through the constraints of traditional development paths, green innovation integrates eco-friendly concepts with technological innovation systems, stimulating both technological and institutional innovation as well as the coordination of economic and environmental development. It is increasingly becoming a key pathway to sustainable development.
Green innovation is a critical driver of high-quality economic growth. It possesses dual positive externalities—promoting both technological progress and economic benefits while significantly improving environmental quality. Achieving high-quality regional green development is inseparable from improving green innovation efficiency. Specifically, it requires strengthening regional innovation capacity, forming new patterns of rational allocation of innovation resources and orderly flow of production factors, and advancing the industrialization and scaling-up of green technologies. The goal is to achieve a low input-output ratio with minimal environmental cost, thereby narrowing regional economic gaps and providing continuous momentum for sustainable economic development. However, several questions remain unresolved: What is the current state of green innovation efficiency in Chinese cities? Are there regional disparities? Is there evidence of convergence? In-depth exploration of these issues and the formulation of localized and effective policy measures are of great significance for promoting China’s high-quality development.
Green innovation efficiency refers to the maximum innovation output achievable with a given set of innovation resource inputs in a specific region [1]. It is the core driver of green innovation [2]. Scholars have conducted extensive research in this area, focusing mainly on the measurement methods of green innovation efficiency, spatial characteristics, and influencing factors. In terms of measurement, the methodology has shifted from traditional indicator systems and stochastic frontier analysis to non-parametric Data Envelopment Analysis (DEA) methods [3-5]. Regarding spatial characteristics, Lü employed Moran’s I and convergence models \( β \) to empirically reveal the spatiotemporal evolution and convergence of regional green innovation efficiency in China [6]. Hu and others investigated the effects of industrial coupling and spatial agglomeration on green innovation from the perspectives of industrial synergy and spatial co-location [7]. In terms of influencing factors, existing research suggests that environmental regulation, technological advancement, factor mobility, digital inclusive finance, energy consumption, and financial support significantly affect green innovation efficiency [8-12].
In summary, existing literature provides a solid theoretical foundation by addressing the measurement, spatial characteristics, and influencing factors of green innovation efficiency. However, there remain areas for further exploration: First, in terms of indicator selection, most studies focus on the “innovation-driven” aspect of green innovation efficiency, with limited attention to the “green development” dimension. Second, regarding research content, there is insufficient investigation into the spatial convergence characteristics of green innovation efficiency at the city level, and the spatial spillover effects have not been adequately considered. Given the geographical connections among cities, spatial interactions in green innovation are likely. Third, concerning research scale, most studies focus on the national, provincial, or urban agglomeration level, with few studies targeting the municipal level—an essential scale for observing spatial heterogeneity in green innovation efficiency. These macro-level results often lack demonstrative and practical guidance.
Based on these gaps, this paper systematically reviews the concept of green innovation and, from the perspectives of eco-friendliness and innovation-driven development, constructs an evaluation index system for green innovation efficiency. Using panel data from 277 prefecture-level and above cities in China between 2011 and 2021, the super-efficiency SBM-DEA model is employed to measure green innovation efficiency. Furthermore, the Kernel density estimation method and the Dagum Gini coefficient are used to analyze its dynamic evolution and regional disparities. Finally, spatial β convergence models—both absolute and conditional—are introduced to examine convergence characteristics and propose policy recommendations for coordinated development of urban green innovation efficiency.
2. Construction of the indicator system, data sources, and research methods
(1) Construction of the urban green innovation efficiency evaluation index system
As a development strategy that organically integrates environmental protection with economic growth, green innovation is a key approach to addressing the current challenges facing urban development. It combines innovation theory with ecological principles, emphasizing environmental protection throughout the innovation process while aiming to maximize resource conservation and pollution reduction. In terms of innovation inputs, it is essential to systematically include urban investments in labor, capital, and energy to comprehensively reflect resource allocation capacity and the level of long-term accumulation. Innovation outputs should reflect the effectiveness of innovation, economic performance, and environmental benefits, while also accounting for the environmental costs generated in green innovation activities. Based on these considerations, this paper constructs an input–output indicator system for evaluating urban green innovation efficiency in China, as shown in Table 1.
To address the limitations of traditional DEA models, this study adopts an improved super-efficiency SBM-DEA model. This approach overcomes three major drawbacks of conventional DEA by introducing a non-radial and non-angular treatment to capture slack variables in inputs and outputs, and by setting an independent weight vector (λ) to achieve more precise efficiency measurements for each Decision-Making Unit (DMU).
Table 1. Construction of the evaluation index system for urban green innovation efficiency
Indicator Type | Primary Indicator | Secondary Indicator |
Input | Labor Input | Number of R&D personnel in industrial enterprises above designated size |
Capital Input | Internal R&D expenditure of industrial enterprises above designated size | |
Environmental Governance Input | ||
Energy Input | Total electricity consumption across society | |
Desired Output | Economic Benefit | GDP per capita |
Innovation Output | Number of authorized patents | |
Green Development | Green coverage rate of built-up areas | |
Undesired Output | Environmental Pollution | Volume of industrial wastewater discharge |
Volume of industrial sulfur dioxide emissions | ||
Volume of industrial smoke and dust emissions |
(2) Data sources and notes
Due to the absence of some indicators in certain cities, this paper selects panel data from 277 prefecture-level cities in China from 2012 to 2021, based on the availability of relevant data. Data are primarily sourced from the statistical yearbooks of each city for the years 2011 to 2021. Missing values are supplemented using linear interpolation.
(3) Research methods
This study employs a non-parametric Kernel density estimation method, treating the green innovation efficiency of each city as a continuous probability distribution to depict spatial distribution patterns and polarization characteristics. To further assess regional disparities in green innovation efficiency, the Dagum Gini coefficient is utilized for decomposing and analyzing spatial inequality. Furthermore, by combining σ convergence and \( β \) convergence models, the temporal evolution and convergence trends of green innovation efficiency are systematically examined. To better capture spatial dependencies and interactions between regions, spatial convergence models are constructed, which improve the explanatory power of regional disparities and convergence mechanisms in green innovation efficiency. This study constructs a Spatial Lag Model and a Spatial Error Model to analyze spatial convergence. The forms of the absolute β-convergence Spatial Lag Model and Spatial Error Model are as follows:
\( ln{(}EF{F_{it+1}}/EF{F_{it}})=α+βln{E}F{F_{it}}+ρW(ln{(}EF{F_{it+1}}/EF{F_{it}}))+{ε_{it}} \) (1)
\( ln{(}EF{F_{it+1}}/EF{F_{it}})=α+βln{E}F{F_{it}}+(I-λW{)^{-1}}{μ_{it}} \) (2)
Where: \( W \) is an \( n×n \) spatial weight matrix, \( ρ \) is the spatial lag coefficient, \( {ε_{it}} \) is the random error term, \( λ \) is the spatial error coefficient, and \( {μ_{it}} \) is a normally distributed random error term.
3. Analysis of the dynamic evolution and regional disparities of green innovation efficiency
3.1. Analysis of the dynamic evolution characteristics of green innovation efficiency
Based on data from prefecture-level cities and three major regions in China, this study calculates green innovation efficiency from 2011 to 2021. Figure 1 illustrates the changes in the national average of green innovation efficiency during this period.
At the national level, green innovation efficiency showed a fluctuating upward trend from 2011 to 2020. The national average rose from 0.667 in 2011 to 0.764 in 2020, reflecting a 14.54% increase. The year-on-year growth rates for the eastern, central, and western regions were 27.05%, 0.21%, and 17.22%, respectively. A temporary decline was observed from 2015 to 2017, likely influenced by national policy developments. Specifically, the introduction of the "Five Major Development Concepts" and the implementation of the new Environmental Protection Law in 2015 marked the beginning of a new era of environmental governance in China. This new law mandated that governments at all levels strengthen environmental protection, uphold citizens’ environmental rights, and impose stricter penalties for environmental violations. While stringent environmental regulations may have temporarily suppressed green innovation efficiency in the short term, they contributed to long-term improvements.
At the regional level, the average green innovation efficiency scores for the eastern, central, and western regions were 0.8462, 0.6482, and 0.7494, respectively, with the national average at 0.7483. This suggests that the eastern region had the highest efficiency, followed by the western region, while the central region lagged behind. Further analysis indicates that the disparity between the eastern and central regions is significantly larger than that between the central and western regions. In the western region, a mismatch between technological advancement and economic development hindered the effective transformation of innovation into growth. In contrast, the eastern region demonstrated superior resource allocation and operational efficiency, which stimulated innovation and boosted regional vitality. This underscores the need for the central and western regions to further enhance the coordination between technology and economic development to improve efficiency. In terms of trend changes, green innovation efficiency improved in both the eastern and western regions after the implementation of the new Environmental Protection Law between 2018 and 2020. However, the central region experienced relatively slow growth. This can be attributed to its economic structure, which is dominated by high-energy-consuming, high-pollution, and low-efficiency industries, as well as its lagging pace of industrial transformation and upgrading. Overall, most Chinese cities still need to improve their input–output efficiency, highlighting the importance of optimizing resource allocation and avoiding inefficient investments to effectively enhance green innovation efficiency.
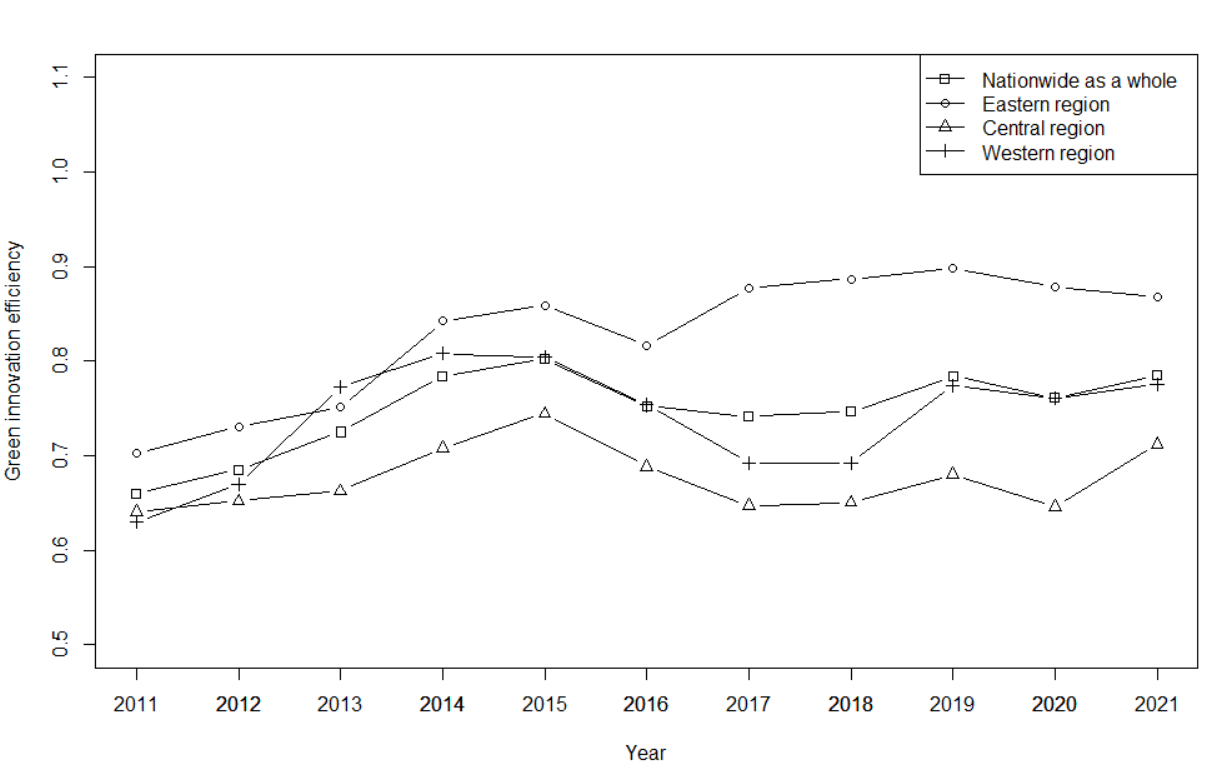
Figure 1. Changes in the average green innovation efficiency in China (2011–2021)
3.2. Analysis of the spatial pattern characteristics of green innovation efficiency
Based on the calculated levels of green innovation efficiency, this paper plots Kernel density estimation curves for China as a whole and its three major regions from 2011 to 2021, in order to analyze the spatial distribution patterns and temporal trends of green innovation efficiency. These are shown in Figure 2.
At the national level, the Kernel density curves demonstrate the dynamic distribution of green innovation efficiency across China. Except for 2016, when the curve’s center shifted slightly to the left compared with the baseline year, the centers in other years moved rightward, indicating a general trend of first increasing, then decreasing, and then increasing again in green innovation efficiency. This suggests that disparities initially widened but subsequently narrowed and continued to improve. Regarding curve shape, the height of the peak follows an inverted U-shaped pattern and gradually transitions from a multi-peaked to a single-peaked distribution, indicating a weakening of the multi-polar differentiation in green innovation efficiency across regions. At the same time, the tails of the distribution curves narrowed, peaks flattened, and widths shrank over time. These patterns reflect a rightward shift in the Kernel density curves and imply the presence of dynamic convergence in green innovation efficiency.
At the regional level, the eastern region’s curve centers clearly shifted to the right over time, whereas those for the central and western regions shifted leftward. Meanwhile, the central and western regions saw increasingly prominent peaks, suggesting that although significant disparities persisted in those regions, the situation improved year by year, reflecting positive outcomes from China’s development strategies and regulatory frameworks. From the perspective of distribution width and peak height, the curves for all three regions narrowed while their peaks increased, signaling regional convergence trends that are consistent with the national pattern. However, the central region exhibited a long and persistent left tail and a leftward-shifting peak, indicating a stepwise distribution and pronounced polarization. The variation in resource endowments across provinces contributed to uneven improvements in green innovation efficiency, resulting in short-term expansion of absolute regional disparities. In contrast, the eastern region showed a clear transition from a bimodal to a unimodal distribution, with a weakening left tail over time. This demonstrates that eastern cities have taken local conditions and development environments into full account when advancing green innovation, successfully coordinating regional development and achieving notable progress. In summary, the analysis of the dynamic evolution and spatial distribution of green innovation efficiency indicates that China’s policies and practical efforts in green innovation have yielded substantial achievements. Moving forward, it is essential to continue optimizing development strategies, further narrow regional gaps, and enhance green innovation across the board.
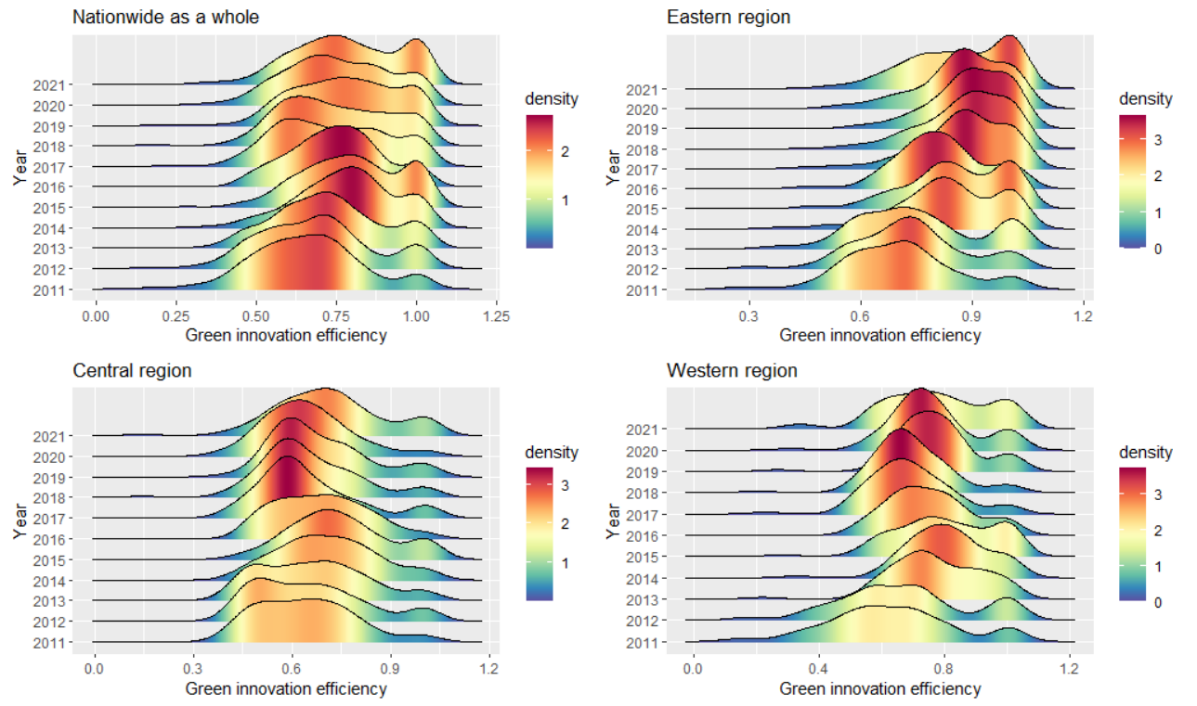
Figure 2. Kernel density estimation curves of green innovation efficiency in China and its major regions (2011–2021)
3.3. Regional disparities and sources of green innovation efficiency
The Dagum Gini coefficient is a powerful tool for analyzing both regional disparities in efficiency and the sources of such disparities. To clarify the regional differences and their origins in China’s green innovation efficiency, this study presents figures and tables showing intra- and inter-regional disparities across the nation and its three major regions from 2011 to 2021, as well as the decomposition and contribution rates of the Gini coefficient (see Table 2 and Table 3).
(i) Overall disparities
Table 2 reports that during the observation period, the national Gini coefficient for green innovation efficiency exhibited a fluctuating, inverted U-shaped trend. By 2016, the overall Gini coefficient had decreased steadily, followed by a two-year plateau and then an upward trend. This pattern suggests that spatial imbalance persists in the development of green innovation efficiency in China, with overall progress being slow and complex. Hence, it is urgent to optimize resource allocation and improve coordination between market mechanisms and government regulation to enhance efficiency.
(ii) Intra-regional disparities
From Table 2, the average intra-regional Gini coefficients for the country, eastern, central, and western regions are 0.12151, 0.1352, 0.1136, and 0.1244, respectively. Notably, the central and western regions' average Gini coefficients are lower than the national average, suggesting that intra-regional disparities are more pronounced than inter-regional ones in driving the overall gap in green innovation efficiency. This reflects how region-specific innovation strategies are foundational to progress, while cross-region integration plays a supporting role. Specifically, intra-regional disparities in the eastern and western regions increased notably, exacerbating internal gaps. In contrast, disparities in the central region declined by about 17.59%, largely due to national strategies such as the “Rise of Central China,” which bolstered manufacturing bases, revitalized old industrial zones, and transformed resource-dependent cities—thereby strengthening innovation activity among central cities.
(iii) Inter-regional disparities
According to Table 2, the average inter-regional Gini coefficients between eastern–central, eastern–western, and central–western regions are 0.0379, 0.0582, and 0.0619, respectively. This indicates that gaps between the western region and the other two remain significant, due to its weaker infrastructure and higher costs. Strengthening the western region by addressing its shortcomings is essential for elevating national green innovation efficiency. Additionally, the reductions in Gini coefficients between eastern–central, eastern–western, and central–western regions were 79.14%, 53.86%, and 56.38%, respectively, suggesting the central region plays a pivotal role in China’s spatial strategy and national development frameworks. Its development enhances coordination among the eastern, central, and western regions, narrowing inter-regional disparities.
Table 2. Dagum Gini coefficient results (2011–2021)
Year | National Gini | Intra-Regional Disparities | Inter-Regional Disparities | ||||
Eastern Region | Central Region | Western Region | East-Central | East-West | Central-West | ||
2011 | 0.1428 | 0.1434 | 0.1383 | 0.1455 | 0.0278 | 0.0776 | 0.1066 |
2012 | 0.1462 | 0.1522 | 0.1373 | 0.1466 | 0.1048 | 0.1386 | 0.0395 |
2013 | 0.1273 | 0.1393 | 0.1196 | 0.1210 | 0.1302 | 0.1317 | 0.1210 |
2014 | 0.1062 | 0.1196 | 0.0929 | 0.1037 | 0.0012 | 0.0752 | 0.0874 |
2015 | 0.1070 | 0.1143 | 0.1017 | 0.1034 | 0.0038 | 0.1005 | 0.1114 |
2016 | 0.1066 | 0.1199 | 0.0940 | 0.1039 | 0.0380 | 0.0189 | 0.0201 |
2017 | 0.1299 | 0.1421 | 0.1192 | 0.1270 | 0.0292 | 0.0097 | 0.0205 |
2018 | 0.1267 | 0.1336 | 0.1160 | 0.1290 | 0.0264 | 0.0173 | 0.0454 |
2019 | 0.1120 | 0.1243 | 0.1022 | 0.1067 | 0.0556 | 0.0230 | 0.0361 |
2020 | 0.1187 | 0.1315 | 0.1013 | 0.1202 | 0.0316 | 0.0116 | 0.0466 |
2021 | 0.1526 | 0.1673 | 0.1266 | 0.1609 | 0.0058 | 0.0358 | 0.0465 |
Avg. | 0.1251 | 0.1352 | 0.1136 | 0.1244 | 0.0379 | 0.0582 | 0.0619 |
(iv) Sources of disparities and contribution rates
Table 3 decomposes the Dagum Gini coefficient into intra-regional disparities, inter-regional disparities, and transvariation (overlapping). On average, \( {G_{w}} \) , \( {G_{nb}} \) and \( {G_{t}} \) contributed 33.15%, 3.16%, and 63.69%, respectively. This indicates that transvariation—or cross-regional overlap—is the primary source of disparity in green innovation efficiency. This is largely due to significant gaps between individual provinces and regional averages, leading to a high degree of overlap in inter-regional distributions. From a temporal perspective (2011–2021), the contribution of intra-regional disparities decreased slightly by 0.36%, while the net contribution of inter-regional disparities declined by about 58.18%. By contrast, transvariation increased by approximately 4.12% over the period. These findings suggest that the main source of disparities is shifting from transvariation to direct inter-regional gaps. The stable contribution of intra-regional disparities suggests robust trade cooperation and synergistic mechanisms among provinces. Therefore, to enhance green innovation efficiency, China should focus on reducing both intra- and inter-regional disparities and promote balanced regional development and collaborative innovation.
Table 3. Sources and contribution rates of Dagum Gini coefficient decomposition
Year | Contribution | Contribution Rate (%) | ||||
\( {G_{w}} \) | \( {G_{nb}} \) | \( {G_{t}} \) | \( {G_{w}} \) | \( {G_{nb}} \) | \( {G_{t}} \) | |
2011 | 0.0475 | 0.0067 | 0.0886 | 33.2355 | 4.7189 | 62.0456 |
2012 | 0.0485 | 0.0093 | 0.0884 | 33.1607 | 6.3856 | 60.4537 |
2013 | 0.0422 | 0.0048 | 0.0802 | 33.1561 | 3.8363 | 63.0075 |
2014 | 0.0351 | 0.0038 | 0.0672 | 33.0935 | 3.6021 | 63.3044 |
2015 | 0.0355 | 0.0051 | 0.0664 | 33.1795 | 4.7546 | 62.0659 |
2016 | 0.0353 | 0.0018 | 0.0695 | 33.1268 | 1.7200 | 65.1532 |
2017 | 0.0431 | 0.0017 | 0.0850 | 33.2157 | 1.3173 | 65.4669 |
2018 | 0.0421 | 0.0025 | 0.0821 | 33.2169 | 1.9659 | 64.8172 |
2019 | 0.0370 | 0.0029 | 0.0721 | 33.0559 | 2.5681 | 64.3760 |
2020 | 0.0392 | 0.0023 | 0.0772 | 33.0409 | 1.9572 | 65.0019 |
2021 | 0.0505 | 0.0030 | 0.0991 | 33.1158 | 1.9733 | 64.9109 |
Avg. | 0.0415 | 0.0039 | 0.0796 | 33.1452 | 3.1636 | 63.6912 |
An analysis of the trends in the Gini coefficient reveals significant disparities in green innovation efficiency across different regions in China. This imbalance has hindered the overall pace of development. The government should increase support for technological research and development as well as industrial upgrading, and guide each region to formulate differentiated development strategies in order to gradually eliminate regional gaps and achieve high-quality, sustainable development. Improving green innovation efficiency requires a focus on coordinated regional development by optimizing policies and resource allocation. It is essential to encourage regions to engage in innovation activities that align with their unique characteristics, thereby promoting overall improvement. At the same time, interregional cooperation should be strengthened to facilitate the transfer of innovation achievements from the eastern region to the central and western regions, promoting balanced development and narrowing regional disparities. Future policies should emphasize coordinated planning in the central region, leveraging its role as a strategic hub to drive coordinated development among eastern, central, and western China, and thereby comprehensively enhance the efficiency of green innovation nationwide.
4. Convergence analysis of green innovation efficiency
Building on the analysis of regional disparities in green innovation efficiency, this section further explores the trend of narrowing gaps—namely, how less-developed regions catch up with more-developed ones—and the factors influencing convergence. Two approaches are employed: σ-convergence and β-convergence, to reveal regional patterns and evolution in green innovation efficiency and to provide policy recommendations.
4.1. σ-Convergence
Table 4 presents the σ-convergence results, using the coefficient of variation to measure regional disparities. Between 2011 and 2021, although fluctuations occurred, the overall coefficient of variation at the national level showed a slight downward trend, indicating weak national-level σ-convergence. At the regional level: The eastern and western regions showed significant declines in their coefficients of variation, decreasing by 12.14% and 30.36%, respectively—evidence of σ-convergence in these areas. In contrast, the central region displayed instability and no clear convergence trend. This is likely due to its relatively weak economic scale and consumption capacity, as well as unbalanced industrial structures. To achieve stronger convergence in the central region, there is a need to optimize its economic structure and enhance productive and consumption capabilities.
Table 4. σ-Convergence test of green innovation efficiency in China and its major regions
Year | National | Eastern | Central | Western |
2011 | 0.1703 | 0.1468 | 0.1461 | 0.2117 |
2012 | 0.1789 | 0.1503 | 0.1661 | 0.2126 |
2013 | 0.1640 | 0.1643 | 0.1593 | 0.1439 |
2014 | 0.1483 | 0.1330 | 0.1458 | 0.1288 |
2015 | 0.1521 | 0.1308 | 0.1479 | 0.1567 |
2016 | 0.1420 | 0.1181 | 0.1372 | 0.1404 |
2017 | 0.1687 | 0.1192 | 0.1517 | 0.1375 |
2018 | 0.1674 | 0.1109 | 0.1523 | 0.1326 |
2019 | 0.1549 | 0.1004 | 0.1448 | 0.1301 |
2020 | 0.1589 | 0.1127 | 0.1326 | 0.1343 |
2021 | 0.1613 | 0.1290 | 0.1444 | 0.1474 |
4.2. Spatial autocorrelation test
Table 5 reports the results of the Moran’s I test using three types of spatial weight matrices: adjacency, economic distance, and geographic distance. Across most years and matrices, Moran’s I values are significantly positive, indicating that green innovation efficiency is spatially clustered. However, under the economic distance matrix, the Moran’s I index is not significant for the years 2013–2016. In contrast, geographic and adjacency-based matrices consistently show strong spatial correlation, confirming the importance of spatial factors.
Table 5. Spatial autocorrelation test of green innovation efficiency
Year | Adjacency Weight Matrix | Economic Distance Weight Matrix | Geographic Distance Weight Matrix | |||
Moran’s I | Z-value | Moran’s I | Z-value | Moran’s I | Z-value | |
2011 | 0.166*** | 4.272 | 0.037* | 1.340 | 0.041*** | 8.642 |
2012 | 0.193*** | 4.937 | 0.049** | 1.751 | 0.041*** | 8.732 |
2013 | 0.172*** | 4.422 | 0.032 | 1.179 | 0.031*** | 6.847 |
2014 | 0.179*** | 4.603 | 0.027 | 1.037 | 0.034*** | 7.444 |
2015 | 0.199*** | 5.111 | 0.028 | 1.048 | 0.036*** | 7.749 |
2016 | 0.148*** | 3.828 | 0.012 | 0.517 | 0.026*** | 5.792 |
2017 | 0.307** | 7.826 | 0.061** | 2.159 | 0.071*** | 14.709 |
2018 | 0.307*** | 7.815 | 0.108*** | 3.741 | 0.070*** | 14.350 |
2019 | 0.244*** | 6.241 | 0.085*** | 2.961 | 0.052*** | 10.844 |
2020 | 0.273*** | 6.983 | 0.105*** | 3.634 | 0.050*** | 10.587 |
2021 | 0.142*** | 3.681 | 0.033* | 1.422 | 0.028*** | 6.226 |
4.3. Spatial convergence analysis
This study employs the Lagrange Multiplier (LM) test, the Likelihood Ratio (LR) test, and the Hausman test to determine the optimal regression model for the convergence analysis. The results of the LM test show that, regardless of the spatial weight matrix used, both spatial error effects and spatial lag effects are statistically significant. The LR test results indicate that the Spatial Durbin Model (SDM) can be simplified to either a Spatial Autoregressive Model (SAR) or a Spatial Error Model (SEM). The Hausman test rejects the null hypothesis at the 1% significance level, indicating that a fixed effects model is more appropriate. Considering the long panel structure of the dataset used in this study, and the critical role of individual effects, a two-way fixed effects model—accounting for both individual and time effects—is employed to avoid excessive loss of degrees of freedom.
4.3.1. Absolute β-convergence analysis.
Given the significant spatial correlation characteristics of regional green innovation efficiency in China, this study first applies a traditional β-convergence model, followed by an extended model that incorporates spatial effects to examine absolute β-convergence. First, a panel regression model is used to simulate regional green innovation efficiency without spatial effects, and the spatial correlation of the regression residuals is tested to determine the appropriate spatial econometric model (see Table 6). Second, a spatial econometric model is constructed to analyze the absolute β-convergence trend of China’s regional green innovation efficiency while accounting for spatial dependence (see Table 7).
As shown in Table 6, the β coefficients for the national level and for the eastern, central, and western regions are all negative and significant at the 1% level, indicating that in the absence of spatial effects, regions with lower green innovation efficiency tend to grow faster, thus converging toward a steady state. The shorter the half-life, the less time it takes for a region to reach its steady state in green innovation efficiency. Specifically: The national average half-life is 34.8209 years; For the eastern, central, and western regions, the half-lives are 34.4614, 34.3361, and 18.6873 years, respectively. This suggests that the eastern and central regions take longer to reach equilibrium, while the western region converges more quickly, reflecting a relatively faster improvement in its green innovation efficiency.
Table 6. Parameter estimates and test results of the traditional absolute β-convergence model
Variable | National | Eastern Region | Central Region | Western Region |
α | -0.0476*** (0.043) | -0.0177*** (0.0044) | -0.0834*** (0.0099) | -0.0844*** (0.0091) |
β | -0.1805*** (0.0107) | -0.1822*** (0.0152) | -0.1828*** (0.0206) | -0.3099*** (0.2165) |
s | 0.0199 | 0.0201 | 0.0202 | 0.0371 |
τ(year) | 34.8209 | 34.4614 | 34.3361 | 18.6873 |
R2 | 0.0931 | 0.1285 | 0.1475 | 0.2106 |
Log(L) | 1566.5000 | 927.6579 | 495.8831 | 349.5472 |
LM(LAG) | 33.202*** | 13.519*** | 10.424*** | 6.878*** |
R-LM(LAG) | 0.352 | 8.386*** | 1.086 | 3.876* |
LM(ERR) | 36.961*** | 8.283*** | 9.459*** | 12.441*** |
R-LM(ERR) | 4.111* | 3.150* | 0.121 | 9.439*** |
N | 2,770 | 980 | 1,000 | 790 |
Note: Values in parentheses are standard errors. *, **, and *** denote statistical significance at the 10%, 5%, and 1% levels, respectively.
Table 7. Absolute β-space convergence model parameter estimation and test results
Variable | National | Eastern Region | Central Region | Western Region | ||||
SEM | SAR | SEM | SAR | SEM | SAR | SEM | SAR | |
β | -0.5193*** (0.1795) | -0.4972*** (0.0175) | -0.4219*** (0.0266) | -0.4088*** (0.0263) | -0.5308***(0.0329) | -0.5256*** (0.0325) | -0.6179*** (0.0329) | -0.6176*** (0.000) |
ρ or λ | 0.1930*** (0.0249) | 0.1374*** (0.023) | 0.2029*** (0.0399) | 0.1707*** (0.0384) | 0.0155* (0.0006) | 0.0171* (0.0430) | -0.0067 (0.0449) | -0.0029 (0.0395) |
s | 0.0655 | 0.0699 | 0.0863 | 0.0895 | 0.0633 | 0.0643 | 0.0481 | 0.0482 |
τ(year) | 10.5780 | 9.9196 | 8.0320 | 7.7487 | 10.9438 | 10.7763 | 14.3977 | 14.3832 |
R2 | 0.2570 | 0.2518 | 0.2386 | 0.2291 | 0.1984 | 0.1978 | 0.3468 | 0.3467 |
Log(L) | 2069.433 | 2057.134 | 1149.482 | 1146.105 | 665.033 | 664.201 | 511.0149 | 510.9892 |
N | 2,770 | 2,770 | 980 | 980 | 1,000 | 1,000 | 790 | 790 |
Note: Values in parentheses are standard errors. *, **, and *** denote statistical significance at the 10%, 5%, and 1% levels, respectively.
The results of the LM test indicate that both LM (LAG) and LM (ERR) statistics for the national level and the eastern, central, and western regions are statistically significant, confirming the presence of strong spatial effects in all areas. Model selection follows the decision rule proposed by Anselin et al. (1996) [27]. At the national level, both LM (LAG) and LM (ERR) are significant; however, since the test statistic for LM (LAG) is smaller than that for LM (ERR), the Spatial Lag Model (SAR) is considered more appropriate. For the eastern region, although both LM statistics are significant, the LM (LAG) statistic is larger than LM (ERR), making the Spatial Error Model (SEM) the preferred choice. In the central region, both statistics are significant, and the LM (LAG) statistic is smaller, indicating that the Spatial Lag Model is more suitable. Similarly, for the western region, the SAR model is deemed more appropriate based on the same criteria.
After incorporating spatial effects into the absolute β-convergence model, the results are presented in Table 7. The β-convergence coefficients for the national level and the eastern, central, and western regions are all negative and statistically significant at the 1% level, indicating that even after accounting for spatial dependence, regions continue to exhibit a significant trend of absolute β-convergence in green innovation efficiency. In addition, improvements in log-likelihood (Log(L)) and R² values suggest that the spatial models perform better than traditional models, further validating the importance of including spatial effects. Specifically, the half-life values (τ) for the national level, eastern, central, and western regions are 9.9196, 7.7487, 10.9438, and 14.3832 years, respectively. This implies that, after accounting for spatial effects, the speed of convergence in green innovation efficiency has increased across all regions—particularly in the eastern and western regions, which now reach steady states in a shorter time. This reflects the promoting role of spatial effects in regional convergence. Furthermore, the spatial lag coefficients (ρ) and spatial error coefficients (λ) are significantly positive in the national, eastern, and central regions (but not significant in the western region), indicating that spatial effects have a positive impact on the convergence of green innovation efficiency in these areas. Additionally, the spatial correlation in response to common external shocks among regions exhibits a complementary relationship, further emphasizing the interconnected nature of regional development.
4.3.2. Conditional β-convergence analysis
Conditional β-convergence refers to the analysis of convergence trends after accounting for the influence of external factors on the narrowing of regional gaps. In examining the conditional β-convergence trend of green innovation efficiency in China, this study introduces control variables from three dimensions: economic, institutional, and technological.
At the economic level, we select Outward Foreign Direct Investment (OFDI) and Financial Agglomeration (FA) as control variables. OFDI facilitates technology transfer and knowledge diffusion, thereby enhancing regional innovation capacity and efficiency and accelerating regional convergence. It is measured as the ratio of foreign direct investment to regional GDP. Financial agglomeration provides abundant capital and innovation resources that support R&D and technology application, particularly helping underdeveloped areas to improve green innovation efficiency through financing and mature technology transfer. It is measured using the location quotient of financial sector employment. At the institutional level, we include Environmental Regulation (ER) and Green Finance (GF). Environmental regulation encourages firms to improve technologies and optimize resource utilization, boosting their green innovation capacity. Stringent regulation not only promotes technological progress but also enhances firms’ abilities to cope with environmental challenges, thereby significantly affecting convergence. ER is measured through an index synthesized using the entropy method, based on industrial wastewater, SO₂, and particulate emissions. Green finance motivates enterprises to engage in green innovation by providing specialized funding and favorable policies. Indicators such as green credit, green investment, green bonds, green funds, and green equity reflect a city’s green financial capacity. This study uses the entropy method to synthesize these indicators into a composite green finance index. At the technological level, the study uses Human Capital (HC) and Technological Innovation (TI) as control variables. High levels of human capital and innovation are key drivers of urban green innovation. HC is measured by the proportion of university students in the total population, while TI is measured by the amount of scientific and technological investment in each city.
Table 8. Parameter estimates and test results of the traditional conditional β-convergence model
Variable | National | Eastern Region | Central Region | Western Region |
α | -0.0825*** (0.0148) | -0.0190*** (0.0299) | -0.0938*** (0.0300) | -0.0705*** (0.0259) |
β | -0.1868** (0.0140) | -0.1870** (0.0172) | -0.1903*** (0.0213) | -0.3320*** (0.0222) |
FA | 0.0030 (0.0057) | -0.0097 (0.0061) | 0.0143 (0.0107) | -0.0028 (0.0137) |
GF | 0.0110* (0.0270) | -0.2044*** (0.0616) | 0.0143* (0.0107) | -0.0309 (0.0459) |
ER | 0.2621** (0.0115) | 0.0526*** (0.0157) | 0.0182** (0.0214) | -0.0031 (0.0213) |
HC | 0.0018 (0.0013) | 0.0032** (0.0014) | 0.0048 (0.0031) | -0.0695 (0.0164) |
TI | 0.0041* (0.0030) | 0.0023 (0.0021) | -0.0402 (0.0175) | -0.0695*** (0.0164) |
OFDI | -0.0007 (0.0019) | -0.0079 (0.0160) | 0.0537 (0.0777) | 0.3004*** (0.0830) |
s | 0.0207 | 0.0207 | 0.0211 | 0.0403 |
τ(year) | 33.5213 | 33.4815 | 32.8363 | 17.1798 |
R2 | 0.1983 | 0.1604 | 0.1469 | 0.2322 |
Log(L) | 1574.3646 | 945.9561 | 502.6205 | 360.2497 |
LM(LAG) | 37.405*** | 8.445*** | 4.974** | 5.779** |
R-LM(LAG) | 0.027 | 6.775*** | 1.025 | 2.906* |
LM(ERR) | 39.194*** | 4.509** | 6.482** | 10.747*** |
R-LM(ERR) | 1.816*** | 2.840* | 2.533 | 7.874*** |
N | 2770 | 980 | 1000 | 790 |
Note: Values in parentheses are standard errors. *, **, and *** denote statistical significance at the 10%, 5%, and 1% levels, respectively.
Table 9. Parameter estimates and test results of the spatial conditional β-convergence model
Variable | National | Eastern Region | Central Region | Western Region |
SAR | SEM | SAR | SAR | |
β | -0.5117*** (0.0178) | -0.4309*** (0.0277) | -0.5486*** (0.0331) | -0.6396*** (0.0335) |
FA | -0.1003 (0.0087) | -0.0148** (0.0094) | 0.0012 (0.0170) | -0.0303* (0.0181) |
GF | -0.1160** (0.1038) | -0.0883** (0.1241) | 0.0987 (0.1905) | -0.0297 (0.2015) |
ER | -0.0061* (0.0180) | 0.0288 (0.0241) | -0.0850*** (0.0296) | 0.0324 (0.0367) |
HC | -0.0028 (0.0029) | 0.0008 (0.0027) | -0.0032 (0.0049) | -0.0067 (0.0068) |
TI | 0.0137*** (0.0035) | 0.0042** (0.0027) | 0.0418* (0.0216) | -0.0067** (0.0068) |
OFDI | -0.0134 (0.0353) | 0.0041** (0.0225) | 0.0482 (0.1220) | 0.0275 (0.1300) |
ρ or λ | 0.1355*** (0.0231) | 0.2006*** (0.0405) | 0.0153*** (0.0006) | 0.0049 (0.0392) |
s | 0.0717 | 0.0564 | 0.0795 | 0.1021 |
τ(year) | 9.6697 | 12.2964 | 8.7144 | 6.7920 |
R2 | 0.2452 | 0.2410 | 0.1734 | 0.3457 |
Log(L) | 2066.894 | 1152.834 | 671.5424 | 518.6903 |
N | 2770 | 980 | 1000 | 790 |
Note: Values in parentheses are standard errors. *, **, and *** denote statistical significance at the 10%, 5%, and 1% levels, respectively.
As shown in Table 8, after accounting for external factors, the significance test results remain consistent with those in Table 6. Specifically, the half-life values for the national, eastern, central, and western regions are 33.5213, 33.4815, 32.8363, and 17.1798 years, respectively. This indicates that the time required to reach a steady state under the traditional conditional β-convergence model is significantly shorter than under the traditional absolute β-convergence model, suggesting that control variables play a positive role in promoting convergence of regional green innovation efficiency.
Further incorporating spatial effects and selecting appropriate spatial convergence models, the analysis results of conditional β spatial convergence are presented in Table 9. The β coefficients for the national level and the eastern, central, and western regions are all less than zero and statistically significant at the 1% level, confirming the presence of significant conditional β-convergence in all regions. Moreover, except for the western region, the spatial lag coefficients (ρ) and spatial error coefficients (λ) for the other regions are significantly positive, indicating that spatial effects significantly facilitate the convergence of green innovation efficiency. By comparing the half-life values across the conditional β spatial convergence model (Table 9), the absolute β spatial convergence model (Table 7), and the traditional conditional β-convergence model (Table 8), the study further confirms the importance of spatial effects and control variables in promoting the convergence of green innovation efficiency across regions.
In terms of control variables, the national-level results show that green finance, environmental regulation, and technological innovation pass the significance tests at the 10%, 5%, and 1% levels, respectively. This demonstrates that a well-developed green financial system, sound environmental regulations, and continuous technological innovation all have positive impacts on enhancing green innovation efficiency. At the regional level, the significance of control variables varies across different regions. This suggests the need for region-specific and localized policy measures to promote coordinated regional development, thereby improving green innovation efficiency nationwide.
Regarding the impact of green finance, environmental regulation, and technological innovation: Green finance plays a key role in supporting innovation activities, especially for newly established private enterprises and innovative micro-, small-, and medium-sized technology-based firms that require substantial funding. Establishing a sound and rational legal and regulatory framework and strictly overseeing the innovation process may impose short-term constraints on urban green innovation, but in the long term, robust legal systems serve as a crucial guarantee for sustained improvements in green innovation efficiency. As the most direct embodiment of urban innovation activities, technological innovation exerts a significantly positive effect on green innovation efficiency.
5. Conclusion and implications
Based on data from 277 prefecture-level cities and above in China from 2011 to 2021, this paper employs the super-efficiency SBM model to measure regional green innovation efficiency. It further utilizes kernel density estimation, the Dagum Gini coefficient, and spatial convergence models to investigate the dynamic evolution, regional disparities, and convergence characteristics of green innovation efficiency. The findings are as follows:
First, China's overall green innovation efficiency exhibits a fluctuating upward trend, particularly entering a phase of steady growth after 2017. The eastern region generally demonstrates higher levels of green innovation efficiency than the central and western regions, displaying a stepwise distribution pattern that decreases from east to west. The disparity between the eastern and central regions is greater than that between the central and western regions, but these gaps have gradually narrowed over time.
Second, kernel density estimation results from 2011 to 2021 indicate that green innovation efficiency among cities is mainly concentrated at a moderate level and shows a rightward shift overall, suggesting a certain degree of convergence. Specifically, the eastern region’s green innovation efficiency has transitioned from a bimodal to a unimodal distribution, with reduced polarization. The central region exhibits a weaker clustering trend but a more pronounced polarization. The western region shows signs of clustering, although a noticeable left-tail phenomenon persists. According to the Dagum Gini coefficient, significant disparities in green innovation efficiency exist among regions, though these disparities show a fluctuating downward trend, indicating spatial imbalance and a slow, complex developmental trajectory. In terms of intra-regional differences, the eastern region exhibits the greatest disparity, while the average Gini coefficients in the central and western regions are lower than the national average. Regarding inter-regional disparities, the gap between the western region and the eastern and central regions remains significant. The gap between the eastern and central regions has narrowed the most, followed by that between the central and western regions, reflecting initial success in China’s coordinated and inclusive development strategies. In terms of sources of disparity, inter-regional overlapping is the main contributor to the differences in green innovation efficiency, with its share gradually shifting toward net inter-regional contributions. The stable contribution rate of intra-regional disparities reflects close trade cooperation and effective coordination mechanisms among provinces.
Third, the Moran’s I index test shows a growing spatial correlation in regional green innovation efficiency, indicating increasing policy and resource alignment. The Moran’s I exhibits an inverted “U” shaped fluctuation, implying that spatial factors significantly influence green innovation efficiency, with some regions potentially experiencing differentiation or resource redistribution. In the convergence analysis, although the coefficient of variation fluctuates, it shows a slight downward trend overall, and σ-convergence is not apparent. Nevertheless, there is significant evidence of absolute β-convergence and conditional β-convergence across regions. At the national level, green finance and environmental regulation-driven technological innovation have significant positive effects on green innovation efficiency convergence. At the regional level, significant differences in the effects of control variables suggest the need for region-specific policies to promote coordinated development.
Given the current state of green innovation efficiency in China, it is urgent to further optimize factor allocation and reasonably regulate resources to realize the synergistic effects of market mechanisms and government regulation. These measures aim to reduce inter-regional disparities in green innovation efficiency and promote regionally coordinated and sustainable development. Based on the empirical findings, the following policy recommendations are proposed:
Implement targeted policies to promote regional green innovation
To effectively drive regional green innovation, targeted policy measures are essential. Due to spatial imbalances in green innovation efficiency and significant differences in regional control variables, the government should increase support for the eastern region—characterized by a favorable external environment and proximity to the efficiency frontier—by promoting technological R&D and industrial upgrading. Policymakers should guide the development of differentiated strategies across regions to gradually eliminate regional disparities and achieve high-quality, sustainable development. As a key hub in China’s "Four Major Plates" layout and "Three Major Strategies," the central region should prioritize coordinated regional development, optimize policy and resource allocation, and encourage region-specific innovation efforts. Meanwhile, strengthening interregional cooperation and facilitating the transfer of innovative outcomes from the east to the central and western regions can promote balanced development. Future policies should enhance top-level planning for the central region, leverage its hub role, and foster coordinated development across eastern, central, and western regions to comprehensively improve green innovation efficiency.
Recognize spatial correlation and inequality in green innovation and harness spatial spillover effects
First, strengthen cooperation among neighboring regions and establish cross-regional green innovation platforms to promote resource sharing and optimize the spatial layout of green innovation, thereby avoiding industrial homogeneity and vicious competition. Second, focus on low-efficiency provinces to prevent path dependency, cultivate potential cities, and develop green innovation growth poles that can drive surrounding cities through dominant and diffusion effects. Lastly, for highly polarized provinces, deepen reforms and implement support measures for neighboring areas. Through regional collaborative innovation and specialized industrial cooperation, siphoning effects can be transformed into radiation effects, enhancing overall green innovation efficiency and promoting balanced regional development.
Transform government functions and implement precision-guided policies to enhance green innovation efficiency
The government must undertake functional transformation and adopt tailored policy interventions. In the eastern region, efforts should focus on promoting indigenous innovation as well as the absorption and re-innovation of imported technologies. This includes setting up dedicated innovation funds to support high-tech enterprises and research institutions, implementing stringent environmental regulations, and establishing green technology demonstration zones. In the western region, it is vital to increase investment in infrastructure and green technologies, improve education and research capabilities, build science parks and innovation incubators, and introduce supportive policies to encourage enterprises to invest in green technologies. For the central region, the government should strengthen technological innovation capacity, increase R&D funding, improve the business environment, and offer preferential policies to attract high-tech enterprises, thus facilitating industrial upgrading and green transformation. A regional development fund should also be established to support green projects. Additionally, the government should enhance regional collaboration to promote the flow of technology, capital, and talent, encouraging east-to-west technology transfer and cross-regional cooperation to jointly tackle green technology challenges. Finally, public awareness of green innovation should be raised through media, education, and training initiatives. Green innovation competitions and forums should be organized to promote resource integration and sharing. These measures will enable the government to effectively enhance green innovation efficiency, achieving a win-win outcome between economic development and environmental protection.
References
[1]. Bai, J., & Chen, X. (2022). Digital economy, spatial spillover effects, and regional innovation efficiency. R&D Management, 34(6), 67–78.
[2]. Li, L., & Zhang, H. (2024). Driving model and internal mechanism of regional green innovation capability: From the perspective of a green innovation ecosystem. Reform, (4), 93–107.
[3]. Li, G., Sun, H., & Zhou, Y. (2020). Technological innovation and urban green development efficiency under fiscal decentralization. Statistics and Information Forum, 35(9), 83–93.
[4]. Guan, J., & Chen, K. (2009). Measurement of technological innovation efficiency in China's high-tech industries. The Journal of Quantitative & Technical Economics, 26(10), 19–33.
[5]. Cao, X., & Yu, J. (2015). A study on China’s regional innovation efficiency from the perspective of green and low-carbon development. China Population, Resources and Environment, 25(5), 10–19.
[6]. Lü, Y., Xie, Y., & Lou, X. (2020). Spatio-temporal leap and convergence trend of regional green innovation efficiency in China. The Journal of Quantitative & Technical Economics, 37(5), 78–97.
[7]. Hu, X., Chen, M., & Luo, Y. (2021). Coupling coordination, spatial co-agglomeration, and green innovation effects between manufacturing and producer services. Statistics and Information Forum, 36(7), 97–112.
[8]. Xiao, Z., Tan, R., & Shi, J. (2022). The impact of environmental regulation on regional green innovation efficiency: A quasi-natural experiment based on the carbon emission trading pilot. Frontiers of Engineering Management and Technology, 41(2), 63–69.
[9]. Chiou, T. Y., Chan, H. K., Lettice, F., & Chung, S. H. (2011). The influence of greening the suppliers and green innovation on environmental performance and competitive advantage in Taiwan. Transportation Research Part E: Logistics and Transportation Review, 47(6), 822–836.
[10]. Shen, L., Chao, X., & Nan, S. (2023). The impact of R&D factor mobility on regional green innovation efficiency: Evidence from provinces along the Belt and Road. Soft Science, 37(6), 89–96.
[11]. Chen, T., Li, X., & Li, Z. (2024). The driving effect of energy consumption and financial support on green innovation in the manufacturing industry. Statistics and Information Forum, 39(3), 66–79.
[12]. Zhang, J., Shang, J., & Qiao, B. (2022). The impact of digital inclusive finance on green innovation efficiency: Empirical evidence from 280 prefecture-level cities in China. Economic Issues, (11), 17–26.
Cite this article
Zhong,G. (2025). Measuring, dynamically evolving, and converging trends of green innovation efficiency in Chinese cities. Journal of Applied Economics and Policy Studies,18(4),42-54.
Data availability
The datasets used and/or analyzed during the current study will be available from the authors upon reasonable request.
Disclaimer/Publisher's Note
The statements, opinions and data contained in all publications are solely those of the individual author(s) and contributor(s) and not of EWA Publishing and/or the editor(s). EWA Publishing and/or the editor(s) disclaim responsibility for any injury to people or property resulting from any ideas, methods, instructions or products referred to in the content.
About volume
Journal:Journal of Applied Economics and Policy Studies
© 2024 by the author(s). Licensee EWA Publishing, Oxford, UK. This article is an open access article distributed under the terms and
conditions of the Creative Commons Attribution (CC BY) license. Authors who
publish this series agree to the following terms:
1. Authors retain copyright and grant the series right of first publication with the work simultaneously licensed under a Creative Commons
Attribution License that allows others to share the work with an acknowledgment of the work's authorship and initial publication in this
series.
2. Authors are able to enter into separate, additional contractual arrangements for the non-exclusive distribution of the series's published
version of the work (e.g., post it to an institutional repository or publish it in a book), with an acknowledgment of its initial
publication in this series.
3. Authors are permitted and encouraged to post their work online (e.g., in institutional repositories or on their website) prior to and
during the submission process, as it can lead to productive exchanges, as well as earlier and greater citation of published work (See
Open access policy for details).
References
[1]. Bai, J., & Chen, X. (2022). Digital economy, spatial spillover effects, and regional innovation efficiency. R&D Management, 34(6), 67–78.
[2]. Li, L., & Zhang, H. (2024). Driving model and internal mechanism of regional green innovation capability: From the perspective of a green innovation ecosystem. Reform, (4), 93–107.
[3]. Li, G., Sun, H., & Zhou, Y. (2020). Technological innovation and urban green development efficiency under fiscal decentralization. Statistics and Information Forum, 35(9), 83–93.
[4]. Guan, J., & Chen, K. (2009). Measurement of technological innovation efficiency in China's high-tech industries. The Journal of Quantitative & Technical Economics, 26(10), 19–33.
[5]. Cao, X., & Yu, J. (2015). A study on China’s regional innovation efficiency from the perspective of green and low-carbon development. China Population, Resources and Environment, 25(5), 10–19.
[6]. Lü, Y., Xie, Y., & Lou, X. (2020). Spatio-temporal leap and convergence trend of regional green innovation efficiency in China. The Journal of Quantitative & Technical Economics, 37(5), 78–97.
[7]. Hu, X., Chen, M., & Luo, Y. (2021). Coupling coordination, spatial co-agglomeration, and green innovation effects between manufacturing and producer services. Statistics and Information Forum, 36(7), 97–112.
[8]. Xiao, Z., Tan, R., & Shi, J. (2022). The impact of environmental regulation on regional green innovation efficiency: A quasi-natural experiment based on the carbon emission trading pilot. Frontiers of Engineering Management and Technology, 41(2), 63–69.
[9]. Chiou, T. Y., Chan, H. K., Lettice, F., & Chung, S. H. (2011). The influence of greening the suppliers and green innovation on environmental performance and competitive advantage in Taiwan. Transportation Research Part E: Logistics and Transportation Review, 47(6), 822–836.
[10]. Shen, L., Chao, X., & Nan, S. (2023). The impact of R&D factor mobility on regional green innovation efficiency: Evidence from provinces along the Belt and Road. Soft Science, 37(6), 89–96.
[11]. Chen, T., Li, X., & Li, Z. (2024). The driving effect of energy consumption and financial support on green innovation in the manufacturing industry. Statistics and Information Forum, 39(3), 66–79.
[12]. Zhang, J., Shang, J., & Qiao, B. (2022). The impact of digital inclusive finance on green innovation efficiency: Empirical evidence from 280 prefecture-level cities in China. Economic Issues, (11), 17–26.