


1. Introduction
In recent years, while undergoing structural adjustments, China’s economy has also been confronted with a range of emerging challenges. The transition from a traditional resource-dependent growth model to a higher-quality, more sustainable development path has become an inevitable choice for the country. The Chinese government has repeatedly emphasized in key economic work conferences that promoting green development, strengthening innovation-driven strategies, and improving the quality of economic growth are critical tasks at this stage [1]. Against this backdrop, how enterprises can achieve a dual improvement in economic and social benefits within the framework of sustainable development has become a focal issue in both policy research and corporate strategic decision-making [2].
At the same time, globally, ESG (Environmental, Social, and Governance) standards have gradually become a major focus of international capital markets and regulatory bodies, serving as important metrics for assessing a company’s long-term development potential and its fulfillment of social responsibilities. ESG is not only a matter of corporate social responsibility but is also increasingly becoming a key factor influencing investor decision-making. Specifically, growing attention has been paid to the role of tax incentives in promoting corporate green innovation, social responsibility fulfillment, and improvements in governance structures. In China, with the government’s continuous promotion of green development policies and the strengthening of requirements for corporate social responsibility, whether tax incentives can truly enhance corporate ESG performance has become a widely debated issue in both academic and practical circles.
Existing studies have recognized the important role of tax policy in promoting corporate sustainability. Tax incentives can lower operational costs and encourage firms to engage in green innovation, thereby facilitating an environmentally friendly industrial transformation [3]. Research has also shown that tax cuts not only stimulate corporate investment in environmental protection but can also enhance long-term competitiveness [4]. However, most of these theoretical frameworks are developed based on the context of developed economies and lack consideration of China's specific economic environment, corporate behavior patterns, and policy implementation conditions.
In China, although the government encourages firms to adopt green innovations and assume social responsibilities through preferential tax policies, in practice, many enterprises still face significant gaps in policy understanding and implementation. Many Chinese firms regard tax incentives merely as short-term financial tools, rather than strategic measures for promoting long-term sustainable development. Furthermore, due to the uncertain returns on long-term green innovation and social responsibility investments, firms often fail to integrate tax incentives into their broader strategic planning. As a result, despite substantial government support through tax policy, its actual effectiveness is still constrained by corporate short-termism and inadequate implementation capacity.
In this context, institutional investors, as major players in capital markets, play a critical role. Owing to their significant shareholdings, institutional investors often exert substantial influence in corporate decision-making, encouraging firms to focus more on long-term sustainability goals [5]. Especially with the rise of ESG investment concepts, more institutional investors are incorporating ESG performance into the core of their investment decisions. In recent years, domestic institutional investors have demonstrated significantly improved performance in ESG investments. This trend has not only promoted corporate improvements in environmental protection, social responsibility, and governance structures, but has also raised expectations for greater transparency and more rigorous ESG reporting [6]. Institutional investors influence corporate decisions through capital allocation, shareholder proposals, and voting rights, thereby driving more enterprises to incorporate ESG into their strategic agendas.
However, the impact of institutional investors on promoting ESG behavior is not always unilaterally positive. Short-term-oriented institutional investors tend to prioritize financial performance while overlooking strategic planning for long-term sustainability [7]. Similarly, domestic studies have found that under highly concentrated ownership structures, some institutional investors focus more on short-term financial statement optimization, paying insufficient attention to long-term ESG investments. Especially in firms with high ownership concentration, decision-making is typically dominated by large shareholders, who often prioritize short-term interests, leading to underinvestment in ESG initiatives [8]. This suggests that institutional investors’ effectiveness in promoting ESG behavior is influenced by ownership structure, investment horizon, and corporate strategic orientation.
It is also worth noting that different ownership structures may significantly impact the effectiveness of tax incentive policies. Firms with high ownership concentration are often controlled by dominant shareholders whose decisions are geared toward short-term returns, which can negatively affect long-term ESG investments [9]. In contrast, firms with more dispersed ownership are subject to greater market and investor pressure, tend to have more sound governance mechanisms, and are more likely to embrace long-term investment philosophies. Empirical studies in China further support this point [10]. Research shows that companies with dispersed ownership demonstrate more proactive behavior in green innovation, governance optimization, and fulfillment of social responsibilities. Conversely, firms with concentrated ownership may underinvest in ESG due to major shareholders' excessive focus on short-term financial gains.
Therefore, this paper argues that while tax incentive policies can reduce the tax burden and promote corporate green innovation, social responsibility, and governance improvement, their actual effectiveness varies across different types of firms. The effectiveness of tax incentives in practice depends not only on policy design but also on a company’s strategic orientation, shareholder structure, and the behavior of institutional investors. On this basis, we propose that when formulating tax incentive policies, the government should account for the characteristics of different enterprises, particularly variations in ownership structure and governance models, in order to more effectively guide firms toward achieving their ESG goals.
In summary, the complex interactions between tax incentive policies, institutional investor behavior, and corporate ownership structures shape corporate ESG performance. Future policy design should incorporate successful experiences from both domestic and international contexts, optimize tax incentive mechanisms, and promote comprehensive improvements in green innovation, social responsibility, and corporate governance. At the same time, further strengthening regulatory oversight of corporate ESG behavior will help ensure the effective implementation of policies and facilitate high-quality and sustainable corporate development.
2. Theoretical analysis and hypothesis development
2.1. Tax incentives and ESG performance disclosure
According to price theory, corporate investment decisions are typically based on a cost-benefit analysis, particularly under resource constraints [11]. Under this framework, firms must make trade-offs among various investment options. Green investment, as one such option, is closely tied to the implementation of tax incentives. Tax incentives play a vital role in reducing the investment costs for enterprises, especially in areas related to sustainable development. Specifically, measures such as accelerated depreciation, R&D tax credits, and deductions for pollution control effectively lower the capital costs associated with environmental investments, thereby encouraging more firms to engage in green projects [14]. From the perspective of price theory, tax incentives reduce the marginal cost of ESG-related investments, making the adoption of green technologies more attractive and thereby facilitating progress toward sustainability.
For example, government-provided tax benefits for green energy can significantly reduce the upfront costs of adopting renewable energy technologies, thereby enhancing the return on such investments. In this sense, tax incentives function as a pricing signal, nudging firms toward green technology choices and, in turn, advancing sustainable development goals.
Tax incentives also play a crucial role in promoting corporate social responsibility and enhancing corporate governance. First, by lowering tax burdens and financing costs, tax incentives ease financial pressure on firms, allowing them to allocate more resources to initiatives such as employee welfare, community support, and public interest programs—thus improving their social image and gaining public trust. Second, tax incentives send a clear policy signal of government support for sustainable development, encouraging companies to strengthen ESG disclosure and transparency. This, in turn, promotes improvements in internal governance structures and risk management systems. Such governance enhancements not only ensure greater scientific rigor and transparency in corporate decision-making but also strengthen firms' overall market competitiveness and long-term resilience. Overall, tax incentives, by improving corporate financial conditions, enhancing information transparency, and optimizing internal management, effectively drive comprehensive progress in social responsibility and corporate governance, laying a solid foundation for sustainable corporate development.
Relevant domestic studies have also explored the role of tax incentives in promoting green investment. After receiving tax benefits, firms often see significantly improved returns on green technology innovation—especially those with a strong sense of social responsibility and a long-term development perspective, where the impact of tax incentives is particularly evident [15]. At the same time, in the context of China’s economic transformation, tax policies provide a more favorable policy environment that encourages enterprises to increase investment in environmental technologies and promote sustainable development.
Hypothesis 1: Tax incentives significantly enhance firms’ ESG performance in environmental protection, social responsibility, and corporate governance, thereby facilitating greater progress toward sustainable development.
2.2. The moderating role of capital market attention
According to agency theory, capital market attention is often regarded as a factor that strengthens managerial accountability to shareholders and other stakeholders. As capital markets increasingly demand greater corporate transparency and performance, firms face mounting market pressure. Investors—particularly institutional investors—are paying closer attention to companies’ short-term financial performance, which compels corporate managers to prioritize short-term financial metrics. However, this trend toward short-termism may undermine firms’ long-term commitments to environmental, social responsibility, and corporate governance (ESG) initiatives. Although capital market scrutiny is expected to encourage greater information disclosure and transparency, excessive focus on short-term performance may lead firms to neglect long-term sustainable investments. As a result, under intense capital market pressure, tax incentives may not effectively motivate firms to undertake long-term ESG investments.
When capital markets are overly focused on quarterly earnings and financial indicators, companies may divert funds gained from tax incentives toward short-term financial adjustments instead of long-term ESG projects [12]. For example, firms might use the tax savings for stock buybacks, boosting quarterly profits, or paying higher dividends, rather than investing in green technology R&D or corporate social responsibility programs. This short-term orientation can dilute the effectiveness of tax incentives in promoting ESG investments.
Moreover, capital market regulation may give rise to a “regulatory paradox.” While regulation is intended to enhance transparency and corporate governance, the pressure to meet short-term financial expectations can, paradoxically, suppress the implementation of long-term ESG strategies. In such a regulatory environment, firms often prioritize quick returns and overlook the importance of sustainable development strategies, thereby diminishing the role of tax incentives in enhancing ESG performance.
Similar findings have been reported in domestic studies. Excessive capital market attention to short-term performance may lead corporate managers to neglect long-term investments, particularly in the ESG domain. Among listed companies, many firms, in response to market-driven short-term pressure, allocate more resources toward increasing short-term profits rather than investing in green technologies or social responsibility initiatives [13]. Furthermore, in a highly scrutinized capital market environment, the effectiveness of tax incentives in encouraging long-term ESG investment is significantly weakened, as firms tend to use tax savings for financial optimization instead of sustainable development projects.
Hypothesis 2: Capital market attention enhances firms’ access to financing and reduces their reliance on tax incentives, thereby weakening the positive effect of tax incentives on ESG performance—manifesting as a negative moderating effect.
2.3. The interaction between internal corporate structure and the propensity to disclose ESG reports
In modern corporate governance theory, ownership concentration typically reflects the degree to which a company’s equity is concentrated. When ownership is more centralized, controlling or major shareholders are better positioned to make decisions, exercise oversight, and allocate resources efficiently. This helps mitigate agency problems, facilitates the swift implementation of corporate strategies, and improves internal governance efficiency. At the same time, tax incentives serve as policy instruments aimed at reducing the financial cost of investing in green technologies, environmental protection, and social responsibility initiatives, thereby encouraging corporate engagement in sustainable development. However, due to differences in ownership structures, firms may respond differently to tax incentive policies.
First, firms with high ownership concentration benefit from major shareholders holding substantial control, allowing for prompt decision-making and minimizing resource waste caused by delays. Upon receiving tax incentives, such firms can quickly adjust their strategies and increase investment in environmental protection, social responsibility, and corporate governance, thereby achieving greater marginal benefits.
Second, concentrated ownership enhances the integration of internal resources and information. Large shareholders possess strong supervisory and constraining power over business activities. This enables firms to channel the funds saved through tax incentives directly into green projects and ESG practices, avoiding the resource dispersion often caused by conflicting interests among diverse stakeholders. Consequently, the effectiveness of tax incentives in promoting ESG improvements is amplified.
Furthermore, high ownership concentration can significantly reduce agency costs. In firms with dispersed ownership, management often faces higher agency costs and greater information asymmetry, which may weaken the transmission effects of tax incentive policies. In contrast, in firms with concentrated ownership, major shareholders are better able to constrain managerial behavior, ensuring that tax incentive funds are genuinely used to enhance ESG performance, thereby reinforcing the policy’s positive impact.
Finally, firms with high ownership concentration are generally perceived by the market as having sound governance structures and high decision-making efficiency. When such firms receive tax incentive support, their expected ESG improvements are more likely to be recognized by investors and other external stakeholders, thereby enhancing firm value and overall competitiveness. This signaling effect not only reflects improved internal governance but also strengthens the role of tax incentives in advancing ESG performance.
Hypothesis 3: Ownership concentration positively moderates the relationship between tax incentives and corporate ESG performance. In firms with higher ownership concentration, major shareholders are better able to coordinate internal resources and drive strategic implementation, thereby enabling tax incentives to play a more significant role in enhancing ESG outcomes.
3. Data, variables, and empirical models
3.1. Data sources and model specification
To meet the objective needs of economic and social development and to establish a more sustainable tax environment, China implemented a new Corporate Income Tax Law in 2008, namely the Corporate Income Tax Law of the People's Republic of China. This tax reform provided a policy background for the redistribution and adjustment of corporate social responsibility through tax reductions and optimization. To ensure consistency in financial data, this study uses A-share listed companies from 2009 to 2023 as the research sample. ESG performance, tax incentives, financial data, and other information are obtained from databases such as CSMAR and Wind, with certain items manually adjusted based on official government documents. Following common practices in existing literature, the raw data are processed as follows: (1) financial firms are excluded due to significant differences in their financial reporting structures compared to other industries; (2) firms designated as ST, *ST, or PT during the sample period—indicative of abnormal financial conditions—are also excluded; (3) companies listed on the B-share market are excluded, considering their differing financial disclosure requirements. The final sample consists of 32,523 firm-year observations.
To test Hypothesis 1, the following regression model (1) is specified:
\( {ESGi_{y}}=α+{β_{1}}TaxIncentiveiy+Controliy+{θ_{y}}+{θ_{n}}+{єi_{y}} \) (1)
As shown in Equation (1), subscript i denotes the firm and y denotes the year. The dependent variable ESGiy represents the average ESG score of firm i in year y. The independent variable TaxIncentiveit captures the post-tax incentive received by firm i in year y. Controliy includes a set of control variables related to firm characteristics, financial conditions, and internal governance. α is the intercept. θy represents year fixed effects, which control for time-specific shocks common across firms (e.g., macroeconomic conditions, monetary or fiscal policies). θn represents industry fixed effects, accounting for sector-specific shocks (e.g., technological advancement, changes in business models, consumption upgrades, or rising labor costs). θi represents firm-specific effects.
To examine the interaction effect of tax incentives, the following regression model (2) is introduced:
\( {ESGi_{y}}=α+{β_{1}}TaxIncentiveiy+{β_{3}}adjiy+{β_{4}}Incentive×adjiy+Controliy+{θ_{y}}+{θ_{n}}+{єi_{y}} \) (2)
As shown in Equation (2), adjiy represents the moderating variable from the perspective of market conditions or internal corporate structure. This model builds upon Model (1) by adding interaction terms to test the interplay between tax incentives and the firm’s internal and external environments in driving ESG disclosure. If both coefficients β1 and β4 are significantly positive, it indicates a positive interaction effect, thereby supporting Hypotheses 2 and 3.
3.1.1. Dependent variable
This study adopts the Huazheng ESG Rating Index as the core explanatory variable to measure corporate performance in environmental protection, corporate governance, and social responsibility. The Huazheng ESG system is one of the more mature ESG evaluation frameworks in China. It employs a three-tier indicator system that assigns ESG performance ratings to Chinese firms on a nine-grade scale ranging from C to AAA. The average ESG score of each firm is used as the dependent variable in the empirical analysis.
3.1.2. Independent variable
Following the promulgation of the new Corporate Income Tax Law in 2008, adjustments to China’s corporate tax rates allowed certain firms to benefit from preferential tax policies. From a cash flow perspective, this study measures tax incentives by calculating the difference between the statutory and effective tax rates based on the actual corporate income tax rate available in the GTA database. The formula is defined as equation (3):
\( Tax Incentive = ln[EBIT × (25\% - Effective Tax Rate)] \) (3)
3.1.3. Moderating variables
From the market perspective, institutional investor ownership is used as a proxy variable. It is measured by the proportion of shares held by institutional investors in the firm’s ownership structure—the higher the proportion, the stronger the institutional oversight and participation in governance, and vice versa.
In terms of internal governance structure, which is central to modern corporate systems and significantly affects firm development, this study uses ownership concentration as the proxy variable—measured by the shareholding ratio of the top ten shareholders. A higher value indicates a higher level of ownership concentration.
3.1.4. Control variables
To mitigate endogeneity from omitted variables and improve estimation efficiency, the following control variables are included: (1) Firm nature (SOE): A dummy variable equal to 1 if the firm is state-owned and 0 otherwise. (2) Growth capability (Grow): Measured by the net profit growth rate. (3) Leverage (Lev): Measured by the debt-to-asset ratio (total liabilities divided by total assets). (4) Liquidity (Liq): Measured using the current ratio. (5) Financial risk (FinR): Measured by financial leverage. (6) Market value (BDT): Calculated as total assets divided by market capitalization (Market Cap A). (7) Separation of ownership and control (Separation): The difference between the actual controlling shareholder's control rights and ownership rights. (8) Operational efficiency (CAT): Measured by the turnover ratio of current assets. To eliminate the influence of extreme values, all variables are winsorized at the 1st and 99th percentiles. Variable definitions are summarized in Table 1, and descriptive statistics of key variables are reported in Table 2.
Table 1. Variable definitions
Variable Type | Variable Name | Symbol | Measurement Description |
Dependent Variable | Huazheng ESG Rating | ESGaverage | The average ESG performance score of a company as measured by Huazheng Rating |
Independent Variable | Tax Incentive | Incentive | Natural logarithm of the corporate income tax incentives |
Moderating Variable | External Market Proxy Perspective | IIP | Shareholding ratio of institutional investors |
Corporate Ownership Structure | TTH | Ownership concentration of the top ten shareholders | |
Control Variables | Nature of Enterprise | SOE | State-owned enterprise (SOE = 1), non-state-owned enterprise (SOE = 0) |
Growth Capability | Grow | Net profit growth rate | |
Leverage Ratio | Lev | Total liabilities divided by total assets | |
Liquidity | Liq | Current ratio | |
Financial Risk | FinR | Financial leverage | |
Operational Efficiency | CAT | Turnover ratio of current assets | |
Separation of Ownership and Control | Separation | Difference between control rights and ownership held by the actual controller of the listed company | |
Market Value | BVR | Book-to-market ratio | |
Year | Year | Year fixed effect | |
Individual | Id | Individual fixed effect |
Table 2. Descriptive statistics
Variable | Mean | SD | Min | Max | |
ESGaverage | 73.57 | 5.067 | 38.92 | 92.93 | |
TaxIncentive | 10.51 | 13.30 | -26.61 | 23.37 | |
size | 22.20 | 1.342 | 15.71 | 28.70 | |
TTR | 60.17 | 15.17 | 3.588 | 101.2 | |
SOE | 0.337 | 0.473 | 0 | 1 | |
Seperation | 4.717 | 7.542 | -72.48 | 58.88 | |
ROE | 0.0780 | 1.524 | -176.4 | 204.7 | |
Liq | 2.915 | 4.245 | 0.0300 | 204.7 | |
Lev | 0.399 | 0.201 | 0.00700 | 0.995 | |
IIP | 44.54 | 25.36 | 0 | 132.6 | |
grow | -1.323 | 155.6 | -19000 | 11000 | |
FinR | 1.382 | 13.19 | -81.34 | 2403 | |
CAT | 1.229 | 1.110 | -0.0550 | 37.05 | |
BDT | 0.358 | 0.166 | 0.00100 | 1.290 | |
According to Table 2, the average ESG performance score of Chinese firms during the sample period is 73.57, with a standard deviation of 5.067, a maximum value of 92.93, and a minimum value of 38.92. This indicates that most enterprises perform relatively well in ESG dimensions, although there is some variation. The mean value of tax incentives (TaxIncentive) is 10.51 with a standard deviation of 13.30, reflecting considerable differences in tax benefits among enterprises. The average firm size (size) is 22.20, with a standard deviation of 1.342, suggesting relatively small variation in company size. The mean ownership concentration (TTR) is 60.17 with a standard deviation of 15.17, indicating significant variation in shareholder control across firms. The average degree of separation between ownership and control (Seperation) is 4.717, with a standard deviation of 7.542, pointing to substantial differences in corporate governance structures. The mean return on equity (ROE) is 0.078, with a standard deviation of 1.524, highlighting wide differences in profitability. The liquidity ratio (Liq) averages 2.915 with a standard deviation of 4.245, showing that some firms experience large liquidity disparities. The mean debt ratio (Lev) is 0.399 with a standard deviation of 0.201, indicating notable differences in firms' leverage levels. The average institutional investor shareholding ratio (IIP) is 44.54, with a standard deviation of 25.36, reflecting considerable variation in ownership structures. Overall, the sample firms exhibit substantial differences in ESG performance, tax incentives, firm size, and governance structures, suggesting that there is still room for improvement in corporate sustainability practices.
4. Regression results and analysis
4.1. Benchmark regression results for the full sample
Table 3 presents the benchmark regression results based on Model (1). Column (1) shows the baseline model, which controls only for year and industry fixed effects, without including additional control variables. Column (2) builds on this by adding several financial indicators, such as firm growth, leverage, liquidity, financial risk, market value, and firm size. Column (3) further incorporates the remaining control variables—operational efficiency, separation of control and ownership, and state ownership—constituting the fully controlled model.
In all three models, the coefficient of tax incentive (TaxIncentive) is significantly positive and passes the 1% significance level. Specifically, in Column (1), the coefficient is 0.0502, indicating that without any control variables, a one-unit increase in tax incentive corresponds to an approximate 5.02% increase in average ESG performance. In Column (2), after including some financial indicators, the marginal effect of tax incentives declines to 0.0230 but remains statistically significant, further confirming the robust positive relationship between tax incentives and ESG performance. In Column (3), after incorporating all control variables, the coefficient stands at 0.0237, consistent with the result in Model (2), indicating that under all configurations of control variables, tax incentives exert a significantly positive influence on ESG performance.
Regarding control variables, the negative coefficient of firm growth (Grow) suggests that firms with higher net profit growth may allocate more resources toward business expansion, thereby relatively reducing ESG-related investments. The significant negative relationship of leverage (Lev) implies that highly leveraged firms may face financial constraints in ESG activities. The positive effect of liquidity (Liq) suggests that firms with higher current ratios are more capable of allocating resources to improve ESG performance. Moreover, the positive coefficient of ownership-control separation (Seperation) introduced in Model (3) supports the idea that governance structure contributes positively to ESG performance. Although operational efficiency (CAT) does not reach statistical significance, its inclusion helps enhance the explanatory power of the model.
In summary, tax incentives have a significantly positive impact on corporate ESG performance. This conclusion holds regardless of whether no, partial, or full control variables are included, further underscoring the important role of tax incentives in promoting corporate sustainability.
Table 3. Regression results for the full sample
Variable | Impact of Tax Incentives on ESG Performance | ||
(1) | (2) | (3) | |
TaxIncentive | 0.0502*** | 0.0230*** | 0.0237*** |
(0.00347) | (0.00340) | (0.00339) | |
Grow | -0.0175** | -0.0192*** | |
(0.00740) | (0.00740) | ||
Lev | -4.313*** | -4.343*** | |
(0.430) | (0.429) | ||
Liq | 0.0371** | 0.0327* | |
(0.0189) | (0.0194) | ||
FinR | -0.597*** | -0.603*** | |
(0.0620) | (0.0617) | ||
BDT | 0.498 | 0.488 | |
(0.351) | (0.351) | ||
Size | 1.212*** | -0.0732 | |
(0.0501) | (0.0651) | ||
CAT | -0.0104 | ||
(0.00728) | |||
Seperation | 0.284** | ||
(0.132) | |||
SOE | 1.193*** | ||
(0.0519) | |||
Constant | 73.07*** | 48.74*** | 49.23*** |
(0.0697) | (1.037) | (1.067) | |
Year FE | Controlled | Controlled | Controlled |
Industry FE | Controlled | Controlled | Controlled |
Observations | 31,154 | 29,925 | 29,925 |
R-squared | 0.091 | 0.166 | 0.167 |
4.2. Robustness tests
4.2.1. Replacing the dependent variable
To further test the impact of tax incentives on firms’ enthusiasm for issuing ESG reports, this paper adopts two alternative methods for the dependent variable. First, we continue to use Huazheng’s ESG rating scores, including separate analyses of the E (environmental), S (social), and G (governance) dimensions. Second, we use ESG ratings from Bloomberg (2009–2022) to replace the original dependent variable and re-run the regression analysis. Table 4 presents the regression results after these replacements.
As shown in Table 4, after replacing the dependent variable, tax incentives still significantly enhance firms’ willingness to issue ESG reports to varying degrees. Specifically, the coefficient of the tax incentive variable (TaxIncentive) remains positive and statistically significant across all models, consistent with our main conclusion that tax incentives positively promote corporate ESG engagement. This indicates that tax incentives, regardless of the measurement method used, effectively encourage firms to strengthen their ESG disclosure efforts, thereby contributing to sustainable corporate development.
Table 4. Changes in the core dependent variable
Variable | (1) | (2) | (3) | (4) |
Huazheng E Score | Huazheng S Score | Huazheng G Score | CNRDS | |
TaxIncentive | 0.0275*** | 0.0303*** | 0.0225*** | 0.016*** |
(0.00531) | (0.00641) | (0.00428) | (0.006) | |
Size | 1.473*** | 1.778*** | 0.886*** | 1.477*** |
(0.0890) | (0.103) | (0.0646) | (0.100) | |
TTR | 0.0125** | 0.0424*** | 0.0625*** | -0.007 |
(0.00637) | (0.00714) | (0.00456) | (0.006) | |
SOE | 0.254 | -1.044*** | 1.975*** | 0.609** |
(0.239) | (0.261) | (0.163) | (0.239) | |
Seperation | 0.0211 | 0.00225 | -0.00724 | 0.001 |
(0.0129) | (0.0138) | (0.00791) | (0.012) | |
Roe | -0.0166*** | -0.0207* | 0.0153* | 0.005 |
(0.00531) | (0.0124) | (0.00867) | (0.013) | |
Liq | -0.0578*** | -0.0576*** | 0.0254 | -0.066*** |
(0.0143) | (0.0178) | (0.0187) | (0.014) | |
lev | 1.361** | -3.532*** | -11.45*** | 0.407 |
(0.644) | (0.724) | (0.480) | (0.643) | |
IIP | -0.00397 | -0.0326*** | -0.0116*** | -0.010** |
(0.00454) | (0.00507) | (0.00318) | (0.005) | |
Grow | -0.00101*** | -0.000633** | -0.00112 | -0.001 |
(0.000287) | (0.000276) | (0.000784) | (0.000) | |
FinR | 0.000928 | -0.00462*** | -0.00164 | 0.004*** |
(0.000829) | (0.00128) | (0.00220) | (0.001) | |
BDT | 3.312*** | -3.655*** | -0.592 | 0.047 |
(0.586) | (0.648) | (0.406) | (0.074) | |
CAT | -0.0792 | -0.0407 | -0.0431 | -1.428** |
(0.0665) | (0.0886) | (0.0536) | (0.611) | |
Constant | 25.29*** | 36.91*** | 61.01*** | -5.409*** |
(1.792) | (2.173) | (1.328) | (2.027) | |
Year FE | Controlled | Controlled | Controlled | Controlled |
Industry FE | Controlled | Controlled | Controlled | Controlled |
Observations | 29,925 | 29,995 | 29,925 | 29,925 |
R-squared | 0.194 | 0.284 | 0.205 | 0.496 |
4.2.2. Considering the impact of omitted variables and special sample periods
4.2.2.1. Incorporating omitted variables
According to existing literature, financial redundancy positively interacts with the relationship between tax incentives and corporate ESG proactivity. Given the uncertainty and spillover effects of ESG activities, financial redundancy provides essential resource support for non-profit initiatives and serves as a material guarantee for promoting sustainable corporate development. It reduces external risks faced by enterprises, thereby effectively enhancing their resilience. Therefore, this study introduces the expected return on assets as an external indicator to measure corporate financial redundancy, with the results presented in column (1) of Table 5. After adding this variable, tax incentives still exhibit a significantly positive effect on enhancing corporate ESG proactivity, indicating the robustness of the regression results.
4.2.2.2. Excluding special sample periods
As a national macro-control policy, tax incentives are significantly influenced by the country’s fiscal policies. In 2018, China implemented policies related to environmental protection tax, which had a major impact on green development and significantly influenced corporate ESG proactivity. To further examine the impact of tax incentives on ESG engagement, this study excludes data from 2018 to 2023, which corresponds to the period following the implementation of the environmental protection tax policy. The regression results shown in column (2) of Table 5 indicate that even after excluding this special sample period, tax incentives remain significant at the 1% level. This demonstrates that tax incentives positively promote corporate ESG proactivity both before and after the implementation of the environmental protection tax policy.
Table 5. Introducing omitted variables and excluding sample periods
(1) | (2) | |
Variable | Including Omitted Variable | Excluding Sample Period |
TaxIncentive | 0.0223*** | 0.00933** |
(0.00391) | (0.00439) | |
size | 1.117*** | 0.936*** |
(0.0574) | (0.0659) | |
SOE | 0.141 | 0.350** |
(0.149) | (0.171) | |
seperation | -0.0118 | -0.00471 |
(0.00859) | (0.00984) | |
roe | -0.0164 | -0.0135 |
(0.0117) | (0.0119) | |
liq | 0.00995 | 0.00857 |
(0.0137) | (0.0149) | |
lev | -4.361*** | -3.389*** |
(0.415) | (0.470) | |
InsInvestorProp | -0.000607 | -0.00479 |
(0.00260) | (0.00304) | |
grow | -0.000578 | -0.00157* |
(0.000441) | (0.000810) | |
FinR | -0.00291 | -0.00226** |
(0.00194) | (0.00107) | |
CAT | -0.249*** | -0.174*** |
(0.0539) | (0.0558) | |
BDT | 0.690** | 1.892*** |
(0.345) | (0.428) | |
ExpectedReturnRate | 0.227*** | |
(0.0556) | ||
Constant | 50.03*** | 53.69*** |
(1.181) | (1.316) | |
Year FE | Controlled | Controlled |
Industry FE | Controlled | Controlled |
Observations | 29,994 | 15,344 |
R-squared | 0.075 | 0.065 |
4.2.2.3. Considering the impact of sample lag
Given the possibility that the positive effect of tax incentives on corporate ESG proactiveness may exhibit a certain degree of lag, this study incorporates one-period, two-period, and three-period lags of the incentive level into the baseline regression model to test the robustness of the regression results. Table 6 presents the regression results after accounting for lag effects. The results show that tax incentives continue to significantly enhance corporate ESG proactiveness, and the positive impact strengthens as the lag length increases. Specifically, the coefficients for one-period and two-period lags are both positive and statistically significant, while the coefficient for the three-period lag remains positive but does not reach the level of statistical significance. Overall, when accounting for lag effects, the conclusion of the baseline regression remains robust, further confirming the sustained and positive influence of tax incentives on improving corporate ESG proactiveness.
Table 6. Lag effect test
(1) | (2) | (3) | |
Variable | One-Period Lag | Two-Period Lag | Three-Period Lag |
TaxIncentive | 0.0368*** | 0.0193*** | 0.00331 |
(0.00377) | (0.00344) | (0.00392) | |
Size | 1.289*** | 1.354*** | 1.454*** |
(0.0632) | (0.0403) | (0.0462) | |
TTR | 0.0314*** | 0.0247*** | 0.0182*** |
(0.00437) | (0.00281) | (0.00329) | |
Soe | 0.853*** | 0.928*** | 0.965*** |
(0.158) | (0.0906) | (0.102) | |
Seperation | 0.00258 | 0.00261 | 0.000466 |
(0.00856) | (0.00492) | (0.00556) | |
Roe | 2.025** | 2.658*** | 2.543*** |
(0.900) | (0.649) | (0.749) | |
Liq | -0.0253** | -0.0297*** | -0.0416** |
(0.0106) | (0.00892) | (0.0163) | |
Lev | -5.649*** | -5.879*** | -6.273*** |
(0.445) | (0.308) | (0.374) | |
IIP | -0.0138*** | -0.0121*** | -0.0111*** |
(0.00319) | (0.00209) | (0.00249) | |
Grow | -0.000422 | -0.000321 | -0.000265 |
(0.000370) | (0.000312) | (0.000266) | |
FinR | -0.00169** | -0.00160*** | -0.0279 |
(0.000665) | (0.000556) | (0.0378) | |
CAT | -0.0550 | -0.0757** | -0.0404 |
(0.0463) | (0.0310) | (0.0336) | |
BDT | -1.011** | -1.396*** | -2.060*** |
(0.418) | (0.297) | (0.340) | |
Constant | 45.67*** | 44.65*** | 43.10*** |
(1.262) | (0.781) | (0.889) | |
Year FE | Controlled | Controlled | Controlled |
Industry FE | Controlled | Controlled | Controlled |
Observations | 24,011 | 18,871 | 14,792 |
R-squared | 0.179 | 0.186 | 0.195 |
4.2.2.4. DID (Difference-In-Differences) test
To examine changes in corporate ESG behavior before and after the implementation of ESG policies in 2020, this study employs the Difference-in-Differences (DID) method. Specifically, the treatment group consists of firms affected by the ESG policies implemented after 2020, while the control group includes firms not influenced by these policies. By comparing changes in ESG behavior between the two groups before and after the policy introduction, the DID approach effectively identifies the net effect of the policy. The regression results in Table 7 show that the coefficient of the DID variable is 0.0441 and is statistically significant at the 1% level, indicating that the implementation of ESG policies had a significantly positive impact on corporate ESG performance. More specifically, the positive and significant DID estimate suggests that corporate ESG engagement improved effectively after the policy was enacted, confirming the promoting effect of ESG policies on corporate behavior. In addition, several control variables in the regression results—such as firm size (size), ownership concentration (TopTenHoldersRate), and state-owned enterprise status (SOE)—also exert a significant influence on corporate ESG performance. Both firm size and ownership concentration have significantly positive effects on ESG performance, whereas leverage (lev) shows a significantly negative correlation. Overall, the regression results of the DID model validate the positive impact of ESG-related tax incentives on corporate ESG behavior before and after the policy implementation in 2020. Moreover, these results remain consistent in robustness checks.
Table 7. DID test
(1) | |
Variable | ESGaverage |
DID | 0.0441*** |
(0.00519) | |
size | 1.313*** |
(0.0556) | |
TopTenHoldersRate | 0.0449*** |
(0.00396) | |
SOE | 0.652*** |
(0.147) | |
seperation | 0.00265 |
(0.00782) | |
roe | -0.000287 |
(0.00722) | |
liq | -0.0183* |
(0.00962) | |
lev | -6.206*** |
(0.394) | |
InsInvestorProp | -0.0160*** |
(0.00282) | |
grow | -0.000799* |
(0.000485) | |
FinR | -0.00221* |
(0.00124) | |
CAT | -0.0581 |
(0.0444) | |
BDT | -0.557 |
(0.360) | |
Constant | 44.92*** |
(1.136) | |
Year FE | Controlled |
Industry FE | Controlled |
Observations | 29,925 |
R-squared | 0.172 |
4.3. Test of interaction effects
To examine whether the impact of tax incentives on corporate ESG performance is moderated by corporate governance factors and capital market attention, this study constructs a multiple regression model incorporating nonlinear interaction terms. The detailed procedure is as follows:
4.3.1. Moderating Effect of Institutional Investor Ownership
Hypothesis 2 posits that the proportion of institutional investor ownership moderates the relationship between tax incentives and corporate ESG performance. In firms with a higher proportion of institutional investors, the positive impact of tax incentives on ESG performance may be weakened. This may be attributed to a heightened focus on short-term returns or increased sensitivity to external oversight among firms with high institutional ownership, which in turn may suppress the long-term sustainability effects of tax incentives.
Table 8. Moderating effect of institutional investor ownership
ESGaverage | |
TaxIncentive | 0.032*** |
(0.002) | |
M1 | -0.001*** |
(0.000) | |
size | 1.253*** |
(0.030) | |
SOE | 0.280*** |
(0.070) | |
BDT | 0.202 |
(0.223) | |
CAT | -0.052* |
(0.027) | |
FinR | -0.002 |
(0.002) | |
grow | -0.001*** |
(0.000) | |
lev | -6.021*** |
(0.234) | |
liq | -0.005 |
(0.007) | |
seperation | -0.008** |
(0.004) | |
InsInvestorProp | 0.002 |
(0.001) | |
_cons | 47.759*** |
(0.586) | |
id | YES |
year | YES |
N | 29925.000 |
r2_a | 0.160 |
The regression results in Table 8 offer an in-depth examination of the effect of tax incentives and their interaction with institutional investor ownership. Specifically, the model introduces an interaction term M1, defined as the product of institutional investor ownership and tax incentives. The coefficient of M1 is –0.001 and is significantly negative at the 1% level. This negative interaction effect implies that as the proportion of institutional investor ownership increases, the positive impact of tax incentives on corporate ESG performance significantly diminishes. This finding confirms Hypothesis 2, which anticipates a negative moderating effect of capital market attention on the relationship between tax incentives and ESG performance. These results suggest that in firms with a high proportion of institutional ownership, investor preferences or governance structures may hinder the effective translation of tax incentives into ESG performance improvements. This provides valuable insights for both policymakers and corporate internal management.
4.3.2. Moderating Effect of Ownership Concentration
Hypothesis 3 suggests that ownership concentration moderates the relationship between tax incentives and corporate ESG performance. It is anticipated that when a firm exhibits a high level of ownership concentration, the positive impact of tax incentives on ESG performance will be strengthened. This may reflect that firms with concentrated ownership are more capable of unified decision-making, thereby enabling more effective utilization of tax incentives to promote long-term ESG improvements.
Table 9. Moderating effect of ownership concentration
ESGaverage | |
TaxIncentive | 0.026*** |
(0.002) | |
M2 | 0.001*** |
(0.000) | |
size | 1.206*** |
(0.028) | |
SOE | 0.410*** |
(0.067) | |
BDT | -0.051 |
(0.220) | |
CAT | -0.059** |
(0.027) | |
FinR | -0.002 |
(0.002) | |
grow | -0.001*** |
(0.000) | |
lev | -5.736*** |
(0.231) | |
liq | -0.013* |
(0.007) | |
seperation | -0.012*** |
(0.004) | |
TopTenHoldersRate | 0.033*** |
(0.002) | |
_cons | 46.980*** |
(0.567) | |
id | YES |
year | YES |
N | 29925.000 |
r2_a | 0.167 |
The regression results in Table 9 further reveal the moderating role of ownership concentration in the relationship between tax incentives and corporate ESG performance. Specifically, the standardized indicator for ownership concentration TopTenHoldersRate is significantly positive, indicating that a higher concentration of ownership is associated with a higher overall level of ESG performance. Additionally, the interaction term M2, which captures the combined effect of tax incentives and ownership concentration, also shows a significantly positive coefficient. This suggests that under conditions of high ownership concentration, the positive effect of tax incentives on ESG performance becomes more pronounced. These findings provide strong support for Hypothesis 3 and offer a theoretical basis for leveraging ownership structure optimization to enhance corporate ESG outcomes.
4.4. Heterogeneity test
Table 10 presents the heterogeneous effects of tax incentives on state-owned enterprises (SOEs) and non-state-owned enterprises (non-SOEs). Column (1) shows the interaction effect between the level of tax incentives and ESG proactiveness in SOEs, while Column (2) displays the corresponding effect in non-SOEs.
According to the regression results, for SOEs, the coefficient of TaxIncentive is 0.004, but it does not reach the threshold of statistical significance. This indicates that although SOEs are influenced by tax incentives, the effect is relatively weak and insignificant. In SOEs, tax incentives do not have a clear positive impact on ESG proactiveness. This may be attributed to the governance structure and management mechanisms of SOEs. These enterprises are typically subject to stronger government supervision and bear greater social responsibility, but issues such as internal control weaknesses and agency problems may undermine the effectiveness of such incentives.
In contrast, the interaction between tax incentives and ESG proactiveness in non-SOEs shows a significantly positive relationship. As shown in Column (2), the coefficient of TaxIncentive is 0.053 and is significant at the 1% level, indicating that tax incentives significantly promote ESG proactiveness in non-SOEs. This suggests that the governance structures and market-driven mechanisms of non-SOEs enable them to respond more effectively to tax incentives, thereby demonstrating a more proactive approach to ESG practices.
Overall, due to their unique ownership structure and management mechanisms, SOEs tend to exhibit less significant ESG proactiveness in response to tax incentives compared to non-SOEs. This phenomenon highlights the specific challenges SOEs face in implementing tax incentive policies, such as insider control and benefit tunneling. Therefore, to ensure that tax incentive policies can effectively promote ESG performance across all types of enterprises—particularly SOEs—it is crucial to optimize corporate governance structures and strengthen external supervision.
Table 10. Results of the heterogeneity test
(1) | (2) | |
Variable | SOEs | Non-SOEs |
TaxIncentive | 0.004 | 0.053*** |
(1.35) | (14.14) | |
size | 1.481*** | 1.100*** |
(31.47) | (25.08) | |
SOE | - | - |
BDT | -1.107*** | -0.307 |
(-2.88) | (-1.11) | |
CAT | -0.041 | -0.152*** |
(-1.42) | (-2.82) | |
FinR | -0.001* | -0.024 |
(-1.79) | (-0.68) | |
grow | -0.001** | -0.001 |
(-2.16) | (-1.35) | |
lev | -5.947*** | -5.663*** |
(-14.32) | (-18.45) | |
liq | -0.044** | -0.022*** |
(-1.98) | (-3.56) | |
seperation | -0.003 | 0.011** |
(-0.46) | (2.07) | |
TopTenHoldersRate | -0.016** | 0.048*** |
(-2.05) | (17.86) | |
InsInvestorProp | 0.027*** | -0.013*** |
(3.64) | (-8.04) | |
Constant | 42.857*** | 48.730*** |
(47.16) | (53.06) | |
Observations | 10,518 | 19,405 |
R-squared | 0.279 | 0.143 |
year fe | yes | yes |
id fe | yes | yes |
4.5. Further analysis: assessing the marginal nonlinear effects of tax incentives on corporate ESG performance
In the previous empirical analysis, we verified that tax incentives significantly enhance corporate ESG performance. Building on this conclusion, this section further investigates the marginal effects of tax incentives in driving ESG improvements. Specifically, we incorporate the squared term of tax incentives (TaxIncentivesq) into the model to assess whether the influence of tax incentives increases progressively as the level of incentives rises.
To explore the marginal effects of tax incentives on corporate ESG performance, we construct Model (4) as follows:
\( ESGaverage={β_{0}}+{β_{1}}×TaxIncentive+{β_{2}}×TaxIncentive2+{Z_{γ}}+ε \) (4)
As shown in Equation (4), TaxIncentive denotes the level of tax incentives; TaxIncentive² represents the squared term, used to capture potential nonlinear effects. Z includes control variables such as firm size, leverage, liquidity, financial risk, ownership concentration, institutional investor shareholding ratio, separation rate, profitability (roe), growth (grow), expected return, and operational efficiency (CAT), among others. Industry fixed effects (IndustryName) and year fixed effects (year) are also included in the model.
Table 11. Analysis of the marginal nonlinear effects of tax incentives on ESG performance
Variable | Marginal Nonlinear Effects of Tax Incentives on ESG Performance |
TaxIncentive | 0.022*** |
(0.004) | |
TaxIncentive_sq | 0.004*** |
(0.001) | |
size | 1.165*** |
(0.067) | |
TopTenHoldersRate | 0.044*** |
(0.004) | |
SOE | 0.699*** |
(0.147) | |
seperation | 0.003 |
(0.008) | |
roe | -0.010* |
(0.006) | |
liq | -0.016* |
(0.010) | |
lev | -5.842*** |
(0.397) | |
InsInvestorProp | -0.016*** |
(0.003) | |
grow | -0.001 |
(0.000) | |
FinR | -0.002* |
(0.001) | |
BDT | -0.333 |
(0.363) | |
CAT | -0.058 |
(0.045) | |
Constant | 46.869*** |
(1.248) | |
Year FE | Controlled |
Industry FE | Controlled |
Observations | 29,925 |
R-squared | 0.173 |
According to the results of Model (4) presented in Table 11, the coefficient of the linear term TaxIncentive (β₁) is 0.022 and is statistically significant at the 1% level. The coefficient of the squared term TaxIncentive² is 0.004, also significant at the 1% level. The constant term is 46.869. Thus, the predicted function can be expressed as equation (5):
\( y=46.869+0.022×TaxIncentive+0.004×TaxIncentive2 \) (5)
Using the turning point formula, as shown in Equation (6):
\( x*=-\frac{{β_{1}}}{2{β_{2}}} = -\frac{0.022}{2×0.004}≈ -2.75 \) (6)
This indicates that when the tax incentive level is below –2.75, the marginal effect is relatively weak or even negative. However, once the tax incentive level exceeds –2.75, the marginal effect becomes progressively stronger, significantly enhancing corporate ESG performance.
To visually illustrate the nonlinear effect of tax incentives on ESG performance, a series of continuous predicted values were manually generated based on the range of TaxIncentive in Model (4). The corresponding ESGaverage scores were then calculated. Specifically, the constant term and the estimated coefficients of both the linear and squared terms of TaxIncentive from Model (4) were used to compute the predicted ESG score at each level of tax incentive.
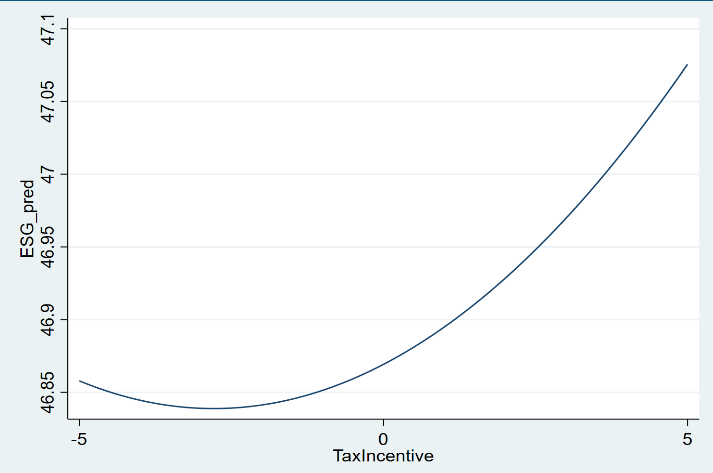
Figure 1. Marginal effects of tax incentives on ESG performance
Figure 1 presents the predicted curve derived from the predictive function. As shown, the overall curve exhibits a distinct U-shaped trend. When the level of tax incentives is relatively low—that is, when the tax incentive level is below approximately -2.75—the predicted ESG score of enterprises remains generally low, with minimal fluctuations, and the curve appears relatively flat. However, once the tax incentive level reaches around -2.75, the predicted ESG score begins to rise rapidly, indicating that beyond this threshold, the marginal impact of tax incentives on ESG performance increases significantly.
Empirical models reveal a significant nonlinear positive relationship between tax incentives and corporate ESG performance. As previously demonstrated, tax incentives exhibit a marginally increasing effect on ESG performance, meaning that as the level of tax incentives increases, the improvement in ESG performance accelerates. However, the existence of marginal effects alone does not fully reveal the structural characteristics of this nonlinear mechanism. To address this, the concept of Marginal Curvature is introduced to explore the rate of change in the strength of corporate ESG responses to tax incentives, thereby uncovering the elasticity of policy effectiveness across different ranges.
Within this model framework, the first-order marginal effect of tax incentives on corporate ESG performance, as shown in Equation (7), is expressed as:
\( \frac{∂ESGaverage}{∂TaxIncentive}={β_{1}}+2{β_{2}}∙TaxIncentive \) (7)
The second derivative of tax incentives, that is, the rate of change of the marginal effect, is given in Equation (8) as:
\( \frac{{∂^{2}}ESGaverage}{∂{TaxIncentive^{2}}}=2{β_{2}} \) (8)
Accordingly, this paper defines the following Equation (9):
\( Marginal Curvature Coefficient (Curvature)=2×{β_{2}} \) (9)
This coefficient reflects the acceleration in the sensitivity of corporate ESG responses to changes in tax incentives. A significantly positive value suggests that once tax incentives surpass a certain threshold, the improvement in ESG performance not only continues but does so at an increasing rate, revealing a nonlinear, accelerated response pattern. In other words, tax incentives possess an “amplification mechanism” that can rapidly spur sustainable corporate behavior within a specific range.
Empirical results show that the linear coefficient of tax incentives is β₁ = 0.022 and the quadratic coefficient is β₂ = 0.004, both statistically significant at the 1% level, yielding a Curvature of 0.008. This value indicates a distinctly convex ESG response curve to tax incentives—that is, a clear “U-shaped structure” with a rapidly rising trend as incentive intensity increases.
This analysis of Marginal Curvature offers critical real-world insights for the formulation of tax policy. First, while most existing literature focuses on whether tax incentives are effective, this analytical framework emphasizes the nonlinear elasticity of policy effects at different intensity levels, thus expanding theoretical perspectives. Second, the significantly positive Curvature value implies that policymakers should pay close attention to the boundary conditions of tax incentives: if incentive intensity remains below the critical point, policy effects will stay in a “low-response zone,” making it difficult to drive structural behavioral changes in enterprises.
Furthermore, this paper argues that the significance of marginal curvature also reflects the necessity for stratified tax policy design. Different enterprises may exhibit heterogeneous curvature structures in their response to incentives (e.g., state-owned enterprises may respond more sluggishly, while private enterprises may be more sensitive). This provides a methodological basis for developing differentiated and targeted incentive schemes. Future studies can further map out a “curvature response profile” based on factors such as ownership structure, industry characteristics, and regional governance environments, ultimately supporting the development of a scientifically grounded incentive classification mechanism.
In conclusion, there is not only a significant positive correlation between tax incentives and corporate ESG behavior, but also a distinct nonlinear acceleration mechanism. By introducing the structural indicator of Marginal Curvature, this paper reveals the amplification effect and response threshold of policy incentives, offering both theoretical grounding and practical guidance for governments aiming to optimize incentive design and enhance the efficiency of policy tools in the context of green transformation.
5. Conclusion and policy recommendations
This paper takes the 2008 reform of China's corporate income tax system as its policy background and uses data from A-share listed companies from 2009 to 2023 to explore the impact of tax incentives on corporate ESG proactivity, considering both internal and external corporate environments. The goal is to support the development of corporate ESG initiatives. First, tax incentives significantly enhance corporate ESG proactivity. This conclusion remains robust after controlling for omitted variables, excluding special sample periods, and applying multiple estimation methods [16]. Second, regarding the interaction effect between external market agents and tax incentives, when institutional ownership is relatively high, tax incentives have a more pronounced effect in boosting ESG proactivity. Third, in terms of the interaction between internal ownership structure and tax incentives, when ownership concentration is high, the positive effect of tax incentives on ESG proactivity is weakened. Further research reveals that tax incentives have a negative interaction effect on the ESG proactivity of state-owned enterprises but a promoting effect on that of non-state-owned enterprises.
At this new historical juncture, to further advance high-quality development and achieve the goal of steady economic progress, a virtuous cycle and close collaboration among government, enterprises, and the market are more important than ever. The findings of this study offer the following insights for building an “enabling government” that stimulates corporate ESG proactivity.
First, at the institutional level, under the current macro environment of tax and fee reductions—particularly under the guidance of the “dual carbon” goals—tax incentives are increasingly generating a mutually reinforcing effect with corporate sustainable development. In this context, structural tax reductions serve not only as a strategic tool but also as a vital signal and driving force for improving business operations and creating space for green innovation. The government can further leverage the guiding role of tax incentive policies to reduce corporate income tax burdens, ease cost pressures, and provide comprehensive cost compensation for ESG activities. This would effectively support companies in undertaking green innovation, improving corporate governance, and fulfilling social responsibilities. Moreover, institutional advantages such as tax incentives can be used to stimulate market vitality, deepen economic system reform and innovation, and provide institutional support for high-quality economic development.
Second, at the enterprise level, companies should further shift their development mindset and regard ESG activities as an important means of enhancing their own value. Enterprises should seize the opportunities of the times and make full use of government tax incentive policies to secure more after-tax cash flow compensation for ESG efforts, thereby enhancing their capacity for sustainable development. At the same time, companies should actively shoulder social responsibilities and give back to society, contributing to the nation’s high-quality development.
Lastly, both the external market’s agency perspective and the internal ownership structure influence corporate ESG proactivity, reflecting that positive internal and external interactions are key to promoting high-quality corporate development. Therefore, it is necessary to truly integrate an enabling government with an effective market: while giving full play to the market's decisive role in resource allocation, attention must also be paid to the government's role. The government should prudently employ economic, administrative, and essential legal tools to foster a sound market environment and continuously improve the socialist market economy with Chinese characteristics in the new era.
References
[1]. Guo, W. (2024). Integration of socially responsible investment and sustainable economic management. Business Observation, 10(07), 101–104.
[2]. Zhang, J., Yang, H., Han, X., et al. (2024). A study on the effectiveness of corporate tax planning: From the perspective of new quality productive forces. Farm Economy and Management, (10), 30–33.
[3]. Porter, M. E., & Kramer, M. R. (2011). Creating shared value. Harvard Business Review, (1), 89–104.
[4]. Konar, S., & Cohen, M. A. (2001). Does the market value environmental performance? Review of Economics and Statistics, 83(2), 281–289.
[5]. Gillan, S. L., Hartzell, J. C., Koch, A., & Starks, L. T. (2010). Firms’ environmental, social, and governance (ESG) choices: Performance and managerial motivation. Unpublished working paper.
[6]. Wu, H., & Lei, L. (2024). Can ESG performance improve corporate investment efficiency? Operations and Fuzzy Mathematics, 14(5), 247–260.
[7]. Bushee, B. J. (1998). Institutional investors, long-term investment, and earnings management. The Accounting Review, 73(3), 305–333.
[8]. Shenzhen Stock Exchange Research Center. (2023). How do common institutional investors affect corporate ESG performance? Shenzhen: Shenzhen Stock Exchange.
[9]. Shleifer, A., & Vishny, R. W. (1997). A survey of corporate governance. The Journal of Finance, 52(2), 737–783.
[10]. Zhang, G. (2009). Conflicts of interest among shareholders and the protection mechanism for minority shareholders. Securities Market Herald, (10), 15–20.
[11]. Stiglitz, J. E. (2015). Price theory (M.). Beijing: China Renmin University Press.
[12]. Benlemlih, M., & Bitar, M. (2018). Corporate social responsibility and investment efficiency. Journal of Business Ethics, 148(3), 647–671.
[13]. Wang, Z., Li, M., & Zhang, W. (2020). The impact of capital market short-termism on firms’ long-term investment decisions. Economic Research Journal, 55(8), 112–125.
[14]. Zhang, S., & Jia, J. (2020). Tax incentives and corporate green innovation: An empirical analysis based on preferential tax policies. Finance and Economics Science, (07), 88–100.
[15]. Luo, L., Tang, Q., & Lan, Y. (2013). A comparison of carbon disclosure tendencies between developing and developed countries: From a resource constraint perspective. Accounting Research Journal, 26(1), 6–34.
[16]. Meng, F., & Wang, W. (2024). Tax incentives, ESG performance, and firm value: From the perspective of internal and external interactions. Journal of Beijing Institute of Technology (Social Sciences Edition), 26(3), 45–58.
Cite this article
Wang,Y. (2025). Tax incentives, marginal effects, and ESG performance: a dual principal perspective of government and market. Journal of Applied Economics and Policy Studies,18(4),127-144.
Data availability
The datasets used and/or analyzed during the current study will be available from the authors upon reasonable request.
Disclaimer/Publisher's Note
The statements, opinions and data contained in all publications are solely those of the individual author(s) and contributor(s) and not of EWA Publishing and/or the editor(s). EWA Publishing and/or the editor(s) disclaim responsibility for any injury to people or property resulting from any ideas, methods, instructions or products referred to in the content.
About volume
Journal:Journal of Applied Economics and Policy Studies
© 2024 by the author(s). Licensee EWA Publishing, Oxford, UK. This article is an open access article distributed under the terms and
conditions of the Creative Commons Attribution (CC BY) license. Authors who
publish this series agree to the following terms:
1. Authors retain copyright and grant the series right of first publication with the work simultaneously licensed under a Creative Commons
Attribution License that allows others to share the work with an acknowledgment of the work's authorship and initial publication in this
series.
2. Authors are able to enter into separate, additional contractual arrangements for the non-exclusive distribution of the series's published
version of the work (e.g., post it to an institutional repository or publish it in a book), with an acknowledgment of its initial
publication in this series.
3. Authors are permitted and encouraged to post their work online (e.g., in institutional repositories or on their website) prior to and
during the submission process, as it can lead to productive exchanges, as well as earlier and greater citation of published work (See
Open access policy for details).
References
[1]. Guo, W. (2024). Integration of socially responsible investment and sustainable economic management. Business Observation, 10(07), 101–104.
[2]. Zhang, J., Yang, H., Han, X., et al. (2024). A study on the effectiveness of corporate tax planning: From the perspective of new quality productive forces. Farm Economy and Management, (10), 30–33.
[3]. Porter, M. E., & Kramer, M. R. (2011). Creating shared value. Harvard Business Review, (1), 89–104.
[4]. Konar, S., & Cohen, M. A. (2001). Does the market value environmental performance? Review of Economics and Statistics, 83(2), 281–289.
[5]. Gillan, S. L., Hartzell, J. C., Koch, A., & Starks, L. T. (2010). Firms’ environmental, social, and governance (ESG) choices: Performance and managerial motivation. Unpublished working paper.
[6]. Wu, H., & Lei, L. (2024). Can ESG performance improve corporate investment efficiency? Operations and Fuzzy Mathematics, 14(5), 247–260.
[7]. Bushee, B. J. (1998). Institutional investors, long-term investment, and earnings management. The Accounting Review, 73(3), 305–333.
[8]. Shenzhen Stock Exchange Research Center. (2023). How do common institutional investors affect corporate ESG performance? Shenzhen: Shenzhen Stock Exchange.
[9]. Shleifer, A., & Vishny, R. W. (1997). A survey of corporate governance. The Journal of Finance, 52(2), 737–783.
[10]. Zhang, G. (2009). Conflicts of interest among shareholders and the protection mechanism for minority shareholders. Securities Market Herald, (10), 15–20.
[11]. Stiglitz, J. E. (2015). Price theory (M.). Beijing: China Renmin University Press.
[12]. Benlemlih, M., & Bitar, M. (2018). Corporate social responsibility and investment efficiency. Journal of Business Ethics, 148(3), 647–671.
[13]. Wang, Z., Li, M., & Zhang, W. (2020). The impact of capital market short-termism on firms’ long-term investment decisions. Economic Research Journal, 55(8), 112–125.
[14]. Zhang, S., & Jia, J. (2020). Tax incentives and corporate green innovation: An empirical analysis based on preferential tax policies. Finance and Economics Science, (07), 88–100.
[15]. Luo, L., Tang, Q., & Lan, Y. (2013). A comparison of carbon disclosure tendencies between developing and developed countries: From a resource constraint perspective. Accounting Research Journal, 26(1), 6–34.
[16]. Meng, F., & Wang, W. (2024). Tax incentives, ESG performance, and firm value: From the perspective of internal and external interactions. Journal of Beijing Institute of Technology (Social Sciences Edition), 26(3), 45–58.