


1. Introduction
On October 16, 2022, the report of the 20th National Congress of the Communist Party of China stated: “Chinese modernization is modernization for a population of a massive scale; it is modernization that aims to achieve common prosperity for all.” The realization of common prosperity for the entire population is deeply rooted in the unique value system of Chinese civilization. In China's rich traditional culture, concepts such as “Datong under Heaven” (universal harmony) and “It is not poverty but inequality that is troubling” embody a humanistic concern for common prosperity. Over thousands of years, the idea of common prosperity has become deeply embedded in the national cultural heritage and has evolved into a widely accepted social consensus. Common prosperity fully reflects the institutional advantages of socialism with Chinese characteristics. It is grounded not only in China's excellent traditional culture but also in the theoretical foundation of classical Marxism. The material basis for common prosperity is the high-level development of productive forces, and its ultimate goal is the free and comprehensive development of human beings—core principles that align closely with Marxist theory. In China, the pursuit of common prosperity integrates both theoretical and practical dimensions. Beyond its theoretical roots in Marxism and traditional culture, the Communist Party of China (CPC) has made substantial achievements in its practical implementation. As early as 1986, during an inspection tour in Tianjin, Comrade Deng Xiaoping proposed that some people and regions should be allowed to prosper first, so as to drive the prosperity of others and ultimately realize common prosperity. In 1990, Deng once again emphasized that “achieving prosperity for all” had been a guiding principle since the beginning of the reform era and would eventually become a central issue. In 2007, Comrade Hu stated that “following the path of common prosperity and promoting the all-round development of human beings” meant that development must be for the people, rely on the people, and deliver its benefits to the people. Since assuming office in 2012, General Secretary Xi has repeatedly stressed that common prosperity is a fundamental goal of Marxism and that China must unswervingly pursue the path of development oriented toward common prosperity. As he declared, “Common prosperity is the essential requirement of socialism and a defining feature of Chinese modernization.”
Sichuan Province is located in the southwestern inland region of China, in the upper reaches of the Yangtze River. As the most populous and economically developed province in Western China, Sichuan boasts a profound historical and cultural heritage, diverse climatic and geographical conditions, and abundant human and economic resources, making it a province with tremendous development potential. The administrative division of Sichuan includes 18 prefecture-level cities and 3 autonomous prefectures. According to data from the Seventh National Population Census, the population of Sichuan reached 83.71 million in 2020, ranking fifth nationwide and first in Western China. The province’s Gross Domestic Product (GDP) reached 4.859876 trillion yuan, positioning Sichuan as a strategically vital hinterland for national development and an indispensable player in China’s industrial development landscape.
Sichuan Province plays a strategically continuous and vital role in advancing the process of common prosperity and constitutes an essential piece of the national common prosperity puzzle. Establishing a rational evaluation index system and analyzing the spatiotemporal characteristics and influencing factors of common prosperity in Sichuan can help identify regions where development remains weak. Based on the analysis of effective influencing factors, targeted policy recommendations can be proposed to enhance the overall level of common prosperity across the province.
2. Literature review
2.1. The fundamental connotation of common prosperity
A prerequisite for studying common prosperity in Sichuan Province is to clarify the concept of common prosperity itself. General Secretary Xi has emphasized that common prosperity refers to the prosperity of all people, encompassing all ethnic groups, regions, and social strata. It is a comprehensive form of prosperity that reflects the people's aspiration for a better life characterized by coordinated development across multiple fields and dimensions. Common prosperity does not imply egalitarianism, but rather a form of prosperity that allows for reasonable differences [1]. To accurately understand common prosperity, it is essential to grasp the dual notions of “prosperity” and “sharing”. Prosperity includes both material and spiritual abundance, while sharing means that members of society share income and wealth and have equal access to public services [2]. Specifically, common prosperity can be examined from political, economic, and social dimensions. Politically, it reflects a socialist social contract in which national strength and collective prosperity coexist; economically, it entails the joint creation and sharing of increasingly abundant material and spiritual wealth by the people; socially, it envisions a harmonious and stable society where the middle-income group constitutes the majority [3]. Four key characteristics define common prosperity: entry of society as a whole into a prosperous state; the prosperity of the entire population; comprehensive prosperity; and widespread prosperity characterized by the elimination of extreme polarization while maintaining reasonable differences.
2.2. Methods for measuring common prosperity
Research on the connotation of common prosperity has made it clear that the concept encompasses two major dimensions: development and sharing. Existing literature has provided relatively rich discussions on the measurement frameworks, indicator systems, and methodologies for assessing both the developmental and sharing aspects of common prosperity. The degree of common prosperity is generally measured through multi-level and multi-dimensional indicators that reflect the extent of “balanced development” or “economic sharing”. For example, Xu et al. constructed a “Balanced Development Index” using a hierarchical structure of 4 primary indicators, 20 secondary indicators, and 49 tertiary indicators to assess regional development balance [4]. Chen et al. developed a common prosperity index model from three dimensions: development, sharing, and sustainability [5]. Their indicator system includes prosperity level, degree of sharing, education, healthcare, social security, ecology, and governance. They adopted the Analytic Hierarchy Process (AHP) based on expert evaluation to assign weights to the indicators [5]. Zhang et al. constructed an evaluation index system from the dual perspectives of participatory rights and income rights [6]. They applied both the entropy-weighted TOPSIS method and the grey relational analysis method to measure the level of common prosperity [6].
2.3. Pathways to achieving common prosperity
With regard to promoting common prosperity, academic research has already proposed a variety of pathways and strategies from specific perspectives. From the viewpoint of the digital economy, the timeline of China’s pursuit of common prosperity aligns with the rise of the digital economy, suggesting that the realization of common prosperity in the future will inevitably rely on the development of the digital economy [7]. The growth of the digital economy not only contributes to “growing the pie” by enhancing overall prosperity levels, but also to “dividing the pie” by facilitating more equitable distribution [8]. Income distribution is also a crucial dimension for advancing common prosperity. The “third distribution” —through philanthropy, social enterprises, and volunteer services—serves as a beneficial supplement to both primary and secondary distribution mechanisms, helping to stimulate endogenous motivation for common prosperity [9]. Following the eradication of absolute poverty, achieving common prosperity requires the prosperous to support and drive the less prosperous. To this end, accurate measurement and dynamic identification of relative poverty in China are necessary, along with quantitative decomposition of changes in poverty levels [10]. Rural revitalization and urban–rural integration are among the essential pathways to realizing common prosperity. Addressing relative poverty in rural areas is a fundamental requirement for achieving this goal. Breaking down the urban–rural dual structure and coordinating development between urban and rural areas should be key strategic priorities in China’s current efforts toward common prosperity [11]. However, challenges such as market barriers between urban and rural factor markets, underdeveloped rural production infrastructure, and weaknesses in rural public services remain significant obstacles to implementing rural revitalization strategies. Achieving the long-term objective of common prosperity necessitates accelerating reforms for marketization of urban–rural factor allocation, promoting intensive and integrated rural industrial development, and continuously improving rural living standards and the provision of public services [12].
2.4. Research commentary
The aforementioned studies have offered in-depth insights into the concept, measurement methodologies, and realization pathways of common prosperity. Overall, the core connotations of common prosperity emphasize both “overall prosperity” and “collective development”. Indicator systems developed based on these dimensions tend to comprehensively encompass various aspects of national development. However, certain limitations remain. First, most existing measurement indicators are designed primarily from the perspective of material wealth, with insufficient attention paid to the dimension of spiritual well-being. Second, although the concept that “lucid waters and lush mountains are invaluable assets” has gained widespread acceptance, ecological and environmental factors have rarely been incorporated into the indicator systems of common prosperity. Finally, current research on common prosperity tends to focus predominantly on the national level, with relatively few studies dedicated to regional analyses. This paper, building upon a thorough understanding of the connotation of common prosperity and taking into account the specific characteristics and development conditions of Sichuan Province, constructs a corresponding measurement model tailored to the region.
3. Data sources and research methods
3.1. Indicator system
Drawing upon a review of existing research and referencing the works of scholars such as Liu, Chen, and Zhang, this study constructs an indicator system for evaluating common prosperity in Sichuan Province, based on the availability of relevant data [3, 5, 6]. The indicators are divided into two dimensions: development indicators and sharing indicators. Table 1 presents the complete indicator framework adopted in this study. Under the dimension of development indicators, the economic indicators include: Urbanization rate of the registered population, Per capita regional GDP, Overall employment rate, Ratio of per capita disposable income between urban and rural residents, and Ratio of living consumption expenditure between urban and rural residents. Under the sharing indicators dimension: Public service indicators include: the number of hospitals, physicians, and hospital beds per 10,000 urban and rural residents; per capita education expenditure; and per capita expenditure on social security and employment for urban and rural residents. Ecological and environmental indicators include: per capita green space area in the province and the number of days with good air quality.
|
Type |
Primary Indicator |
Secondary Indicator |
Unit |
|
Developmental Indicators |
Economic Indicators |
Urbanization Rate of Registered Population |
% |
|
Per Capita Regional GDP |
Yuan/person |
||
|
City Overall Employment Rate |
% |
||
|
Urban–Rural Per Capita Disposable Income Ratio |
— |
||
|
Urban–Rural Per Capita Living Consumption Expenditure Ratio |
— |
||
|
Sharing Indicators |
Public Service Indicators |
Number of Hospitals per 10,000 Urban and Rural Residents |
Units |
|
Number of Physicians per 10,000 Urban and Rural Residents |
Persons |
||
|
Number of Hospital Beds per 10,000 Urban and Rural Residents |
Beds |
||
|
Per Capita Education Expenditure |
Ten Thousand Yuan/person |
||
|
Per Capita Social Security and Employment Expenditure |
Ten Thousand Yuan/person |
||
|
Ecological Environment Indicators |
Per Capita Green Space Area |
Hectares/person |
|
|
Number of Days with Air Quality Meeting Standards |
Days |
After measuring the level of common prosperity in Sichuan Province, this study further analyzes the key factors influencing its development. The main influencing factors include: the growth rate of fixed asset investment, the proportion of the tertiary industry, population density, in-migration rate, number of mobile phone users, total retail sales of consumer goods, per capita general public budget revenue, and the number of urban and rural residents receiving minimum living allowances. Descriptive statistics of these variables are presented in Table 2.
|
Type |
Mean |
Std. Dev. |
Min |
Max |
|
Urbanization Rate of Registered Population (%) |
35.00 |
0.23 |
27.93 |
41.76 |
|
Per Capita GDP (Yuan) |
39414.308 |
15015.381 |
15994 |
64326 |
|
Employment Rate (%) |
96.255 |
0.206 |
95.960 |
96.590 |
|
Urban–Rural Per Capita Disposable Income Ratio |
2.594 |
0.316 |
2.264 |
3.116 |
|
Urban–Rural Per Capita Living Consumption Expenditure Ratio |
2.320 |
0.495 |
1.640 |
3.106 |
|
Number of Hospitals per 10,000 Urban and Rural Residents (units) |
0.232 |
0.053 |
0.145 |
0.296 |
|
Number of Physicians per 10,000 Urban and Rural Residents (persons) |
22.717 |
3.844 |
16.944 |
29.909 |
|
Number of Hospital Beds per 10,000 Urban and Rural Residents (beds) |
58.839 |
15.436 |
33.663 |
79.075 |
|
Per Capita Education Expenditure (10,000 Yuan/person) |
0.126 |
0.044 |
0.049 |
0.181 |
|
Per Capita Social Security & Employment Expenditure (10,000 Yuan/person) |
0.088 |
0.029 |
0.047 |
0.128 |
|
Per Capita Green Space Area (hectares per 10,000 people) |
25.761 |
1.920 |
21.094 |
28.822 |
|
Number of Days with Good Air Quality (days/year) |
120.462 |
27.303 |
98.000 |
173.000 |
|
Proportion of Tertiary Industry (%) |
0.381 |
0.100 |
0.283 |
0.525 |
|
Population Density (10,000 persons/km²) |
0.0169 |
0.0003 |
0.0165 |
0.0172 |
|
Natural Population Growth Rate (‰) |
2.333 |
2.083 |
-2.651 |
4.230 |
|
Total Retail Sales of Consumer Goods (100 million Yuan) |
15020.973 |
6303.813 |
5758.685 |
24133.210 |
|
Per Capita General Public Budget Revenue (Yuan) |
3915.284 |
1331.508 |
1435.055 |
5828.213 |
|
Number of Urban Residents Receiving Minimum Living Allowance (persons) |
1333858.929 |
540849.578 |
521488.000 |
1893114.000 |
|
Number of Rural Residents Receiving Minimum Living Allowance (persons) |
3866414.643 |
350747.178 |
3399154.000 |
4394553.000 |
3.2. Data sources
The data used in this study are primarily drawn from the following sources: 1. Sichuan Statistical Yearbook (2010–2022) and the Statistical Communiques on the National Economic and Social Development of Sichuan Province for corresponding years. These sources provide comprehensive data on economic, social, and environmental conditions for both Sichuan Province as a whole and its prefecture-level cities. 2. Environmental Air Quality Reports published by the Sichuan Provincial Bureau of Ecology and Environment. These reports contain data on the number of days with air quality meeting standards (API or AQI < 100) for Sichuan Province and its prefecture-level cities from 2000 to 2020.
3.3. Research methods
First, this study employs the entropy method to measure the level of common prosperity in Sichuan Province. Based on the scores derived from the entropy-weighted TOPSIS method, the spatial aggregation level of common prosperity across Sichuan's prefecture-level cities is assessed using Moran's I from spatial statistical analysis. Finally, a linear probability model is applied to examine the main factors influencing the level of common prosperity in Chengdu.
3.3.1. Entropy method
The entropy method is an objective weighting technique that determines the weight of each indicator based on the amount of information provided by its observed values. In information theory, entropy is a measure of uncertainty: the greater the amount of information, the lower the uncertainty; conversely, less information implies greater uncertainty.
According to the characteristics of the indicators, entropy can be used to assess the degree of dispersion of a given indicator. The smaller the entropy value, the greater the degree of dispersion, and the greater the influence (i.e., weight) of that indicator in the comprehensive evaluation.
The steps of the entropy method are as follows:
Step 1: Data standardization:
Since positive and negative indicators represent different implications in value, they must be standardized separately.
For positive indicators (see Equation 1):
For negative indicators (see Equation 2):
Where
Step 2: Calculate the Proportion of the
Step 3: Calculate the Entropy Value of the
Where
Step 4: Calculate the Information Utility Value of the
Step 5: Calculate the Weight of each Indicator (see Equation 6):
Finally: Calculate the Common Prosperity Level Scores for Sichuan Province as a Whole, as well as for Each Prefecture-Level City and Autonomous Prefecture (see Equation 7):
3.3.2. TOPSIS method
The TOPSIS method, short for Technique for Order Preference by Similarity to Ideal Solution, is a commonly used comprehensive evaluation approach that can accurately reflect the differences among various alternatives. The calculation steps are as follows:
Step 1: Calculate the Weighted Normalized Decision Matrix (see Equation 8):
where
Step 2: Determine the Positive Ideal Solution A+and Negative Ideal Solution A- (see Equation 9):
Step 3: Calculate the Distance D+ from Each Evaluation Object to the Positive Ideal Solution A+, and the Distance D- to the Negative Ideal Solution A- (see Equation 10):
Step 4: Calculate the Comprehensive Score
A higher value of
3.3.3. Moran’s i index
Spatial autocorrelation refers to the correlation of attribute values of the study objects in geographic space. Moran’s I index is commonly used to test whether the data exhibit spatial correlation. The formula for calculating Moran’s I is as Equation (12):
Where
3.3.4. Linear probability model
In this study, the explained variable is the common prosperity index of each prefecture-level city and autonomous prefecture in Sichuan Province. This index is a continuous positive value ranging from 0 to 1. Therefore, a linear probability model is employed to analyze the factors influencing the common prosperity levels across these regions. Since the dataset used in this paper is panel data covering multiple cities and multiple years, clustered robust standard errors are applied in the model to address potential intra-group autocorrelation issues. The model is specified as Equation (13):
where
4. Development level of common prosperity in Sichuan Province
4.1. Temporal characteristics
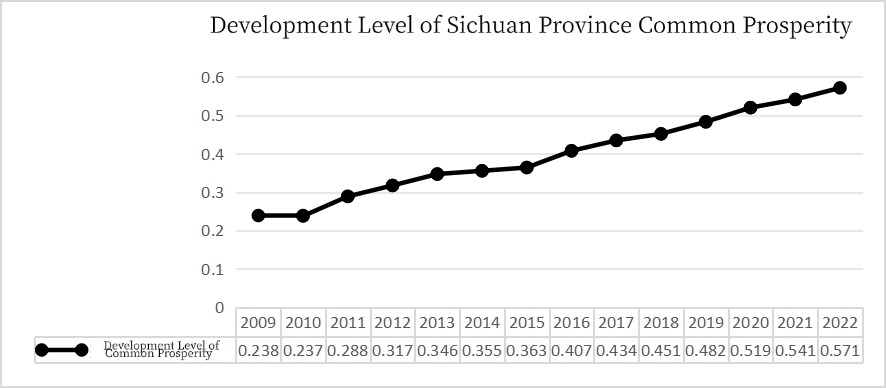
The following table presents the common prosperity development levels of prefecture-level cities in Sichuan Province from 2009 to 2022, calculated using the entropy method. As shown in Table 3, from 2009 to 2022, the overall common prosperity level of Sichuan’s prefecture-level cities exhibited an upward trend, rising significantly from 0.239 in 2009 to 0.571 in 2022, an increase of 239%. The province’s common prosperity development level demonstrated a steady growth trend. The steady improvement of common prosperity in Sichuan Province can be primarily attributed to the successive introduction of coordinated urban-rural development policies and poverty alleviation measures by various prefectures and cities, which have ensured stable economic and social development.
Although the common prosperity levels across prefecture-level cities in Sichuan Province have all been improving, there remain certain disparities in development among different regions. A comparative analysis of the common prosperity levels of Sichuan’s prefecture-level cities and autonomous prefectures reveals that some areas with originally weaker economic foundations, such as Guangyuan, Bazhong, and Aba Prefecture, experienced significant improvements and rapid growth in common prosperity from 2009 to 2022 (see Figure 1). These cities previously faced challenges including poor economic bases and substantial internal developmental disparities. However, through coordinated development and support policies implemented over the past decade or more within the province, these areas have achieved considerable progress in advancing common prosperity. In contrast, cities with higher initial levels of socioeconomic development, such as Chengdu and Panzhihua, have consistently maintained leading positions in the province in terms of common prosperity and have seen their common prosperity levels increase over time, though their overall growth rates have been relatively moderate. Overall, prefecture-level cities and autonomous prefectures in Sichuan that have demonstrated consistently strong performance in realizing common prosperity include Chengdu, Zigong, Panzhihua, Deyang, Mianyang, Guangyuan, Leshan, Ya’an, Aba, and Ganzi. These areas have maintained common prosperity levels above the provincial average for an extended period. Meanwhile, Luzhou, Suining, Neijiang, Nanchong, Yibin, Meishan, Guang'an, Dazhou, Bazhong, Ziyang, and Liangshan have shown varying degrees of disparity compared to the provincial average common prosperity level. Nevertheless, these cities have achieved substantial progress over the past decade, narrowing the gap with the province’s better-performing cities, with some even surpassing the provincial average and advancing their rankings within the province.
|
City/Year |
2009 |
2010 |
2011 |
2012 |
2013 |
2014 |
2015 |
|
Sichuan Province |
0.239 |
0.237 |
0.289 |
0.317 |
0.347 |
0.355 |
0.364 |
|
Chengdu |
0.410 |
0.379 |
0.447 |
0.451 |
0.439 |
0.419 |
0.425 |
|
Zigong |
0.314 |
0.309 |
0.363 |
0.387 |
0.369 |
0.382 |
0.418 |
|
Panzhihua |
0.491 |
0.445 |
0.477 |
0.500 |
0.513 |
0.544 |
0.571 |
|
Luzhou |
0.216 |
0.212 |
0.265 |
0.297 |
0.344 |
0.363 |
0.375 |
|
Deyang |
0.303 |
0.291 |
0.331 |
0.344 |
0.369 |
0.358 |
0.370 |
|
Mianyang |
0.288 |
0.275 |
0.332 |
0.332 |
0.361 |
0.352 |
0.369 |
|
Guangyuan |
0.244 |
0.276 |
0.310 |
0.315 |
0.362 |
0.372 |
0.385 |
|
Suining |
0.220 |
0.259 |
0.330 |
0.299 |
0.293 |
0.341 |
0.355 |
|
Neijiang |
0.195 |
0.208 |
0.269 |
0.261 |
0.267 |
0.325 |
0.334 |
|
Leshan |
0.249 |
0.273 |
0.335 |
0.325 |
0.334 |
0.382 |
0.394 |
|
Nanchong |
0.214 |
0.224 |
0.247 |
0.280 |
0.263 |
0.282 |
0.308 |
|
Meishan |
0.199 |
0.198 |
0.218 |
0.288 |
0.257 |
0.300 |
0.295 |
|
Yibin |
0.212 |
0.198 |
0.220 |
0.323 |
0.267 |
0.281 |
0.325 |
|
Guang’an |
0.119 |
0.168 |
0.205 |
0.264 |
0.243 |
0.268 |
0.309 |
|
Dazhou |
0.117 |
0.148 |
0.183 |
0.241 |
0.223 |
0.243 |
0.267 |
|
Ya’an |
0.243 |
0.291 |
0.319 |
0.349 |
0.401 |
0.407 |
0.459 |
|
Bazhong |
0.125 |
0.150 |
0.174 |
0.219 |
0.265 |
0.281 |
0.320 |
|
Ziyang |
0.102 |
0.162 |
0.195 |
0.230 |
0.265 |
0.278 |
0.285 |
|
Aba Zang and Qiang Autonomous Prefecture |
0.232 |
0.240 |
0.265 |
0.307 |
0.350 |
0.357 |
0.414 |
|
Ganzi Zang Autonomous Prefecture |
0.230 |
0.238 |
0.270 |
0.297 |
0.336 |
0.346 |
0.370 |
|
Liangshan Yi Autonomous Prefecture |
0.160 |
0.192 |
0.196 |
0.212 |
0.227 |
0.267 |
0.294 |
|
City/Year |
2016 |
2017 |
2018 |
2019 |
2020 |
2021 |
2022 |
|
Sichuan Province |
0.407 |
0.434 |
0.452 |
0.483 |
0.520 |
0.541 |
0.571 |
|
Chengdu |
0.441 |
0.484 |
0.489 |
0.509 |
0.551 |
0.577 |
0.666 |
|
Zigong |
0.422 |
0.455 |
0.488 |
0.534 |
0.561 |
0.551 |
0.590 |
|
Panzhihua |
0.572 |
0.589 |
0.586 |
0.600 |
0.631 |
0.652 |
0.658 |
|
Luzhou |
0.395 |
0.456 |
0.499 |
0.519 |
0.530 |
0.541 |
0.626 |
|
Deyang |
0.393 |
0.416 |
0.441 |
0.467 |
0.499 |
0.542 |
0.552 |
|
Mianyang |
0.388 |
0.436 |
0.450 |
0.484 |
0.511 |
0.551 |
0.580 |
|
Guangyuan |
0.420 |
0.449 |
0.465 |
0.513 |
0.592 |
0.592 |
0.594 |
|
Suining |
0.423 |
0.437 |
0.450 |
0.457 |
0.527 |
0.539 |
0.561 |
|
Neijiang |
0.406 |
0.423 |
0.425 |
0.453 |
0.508 |
0.491 |
0.505 |
|
Leshan |
0.419 |
0.435 |
0.465 |
0.551 |
0.566 |
0.562 |
0.586 |
|
Nanchong |
0.376 |
0.404 |
0.418 |
0.481 |
0.517 |
0.496 |
0.516 |
|
Meishan |
0.339 |
0.399 |
0.385 |
0.419 |
0.453 |
0.482 |
0.513 |
|
Yibin |
0.362 |
0.392 |
0.436 |
0.479 |
0.522 |
0.521 |
0.600 |
|
Guang’an |
0.349 |
0.392 |
0.389 |
0.418 |
0.443 |
0.432 |
0.468 |
|
Dazhou |
0.294 |
0.326 |
0.345 |
0.386 |
0.434 |
0.463 |
0.510 |
|
Ya’an |
0.461 |
0.436 |
0.465 |
0.509 |
0.559 |
0.581 |
0.603 |
|
Bazhong |
0.344 |
0.414 |
0.409 |
0.438 |
0.446 |
0.481 |
0.509 |
|
Ziyang |
0.318 |
0.349 |
0.361 |
0.381 |
0.419 |
0.483 |
0.516 |
|
Aba Zang and Qiang Autonomous Prefecture |
0.505 |
0.524 |
0.564 |
0.593 |
0.623 |
0.684 |
0.681 |
|
Ganzi Zang Autonomous Prefecture |
0.410 |
0.406 |
0.438 |
0.468 |
0.473 |
0.554 |
0.603 |
|
Liangshan Yi Autonomous Prefecture |
0.349 |
0.343 |
0.346 |
0.371 |
0.396 |
0.446 |
0.463 |
4.2. Spatial characteristics
Table 4 presents the common prosperity scores of Sichuan Province calculated using the entropy-weighted TOPSIS method, along with the Global Moran’s I index. In terms of spatial correlation, the Moran's I values for the common prosperity levels of various prefecture-level cities and autonomous prefectures in Sichuan Province were 0.104 in 2009 and 0.098 in 2022, both statistically significant at the 5% level. This indicates that the common prosperity levels across Sichuan's administrative regions exhibit a spatial clustering pattern.
|
2009 |
2022 |
|
|
Sichuan Province |
0.264 |
0.279 |
|
Chengdu |
0.441 |
0.404 |
|
Zigong |
0.350 |
0.276 |
|
Panzhihua |
0.717 |
0.325 |
|
Luzhou |
0.248 |
0.384 |
|
Deyang |
0.344 |
0.256 |
|
Mianyang |
0.319 |
0.307 |
|
Guangyuan |
0.306 |
0.351 |
|
Suining |
0.242 |
0.270 |
|
Neijiang |
0.219 |
0.210 |
|
Leshan |
0.288 |
0.268 |
|
Nanchong |
0.240 |
0.245 |
|
Meishan |
0.229 |
0.243 |
|
Yibin |
0.263 |
0.335 |
|
Guang’an |
0.123 |
0.257 |
|
Dazhou |
0.126 |
0.250 |
|
Ya’an |
0.293 |
0.330 |
|
Bazhong |
0.153 |
0.297 |
|
Ziyang |
0.101 |
0.314 |
|
Aba Zang and Qiang Autonomous Prefecture |
0.535 |
0.652 |
|
Ganzi Zang Autonomous Prefecture |
0.551 |
0.620 |
|
Liangshan Yi Autonomous Prefecture |
0.228 |
0.302 |
|
Moran I |
0.104 |
0.098 |
Figure 2 illustrates the level of common prosperity development across various prefecture-level cities in Sichuan Province in 2009, as calculated using the entropy method. Based on the natural breaks classification method, the levels of common prosperity development are divided into five categories. In 2009, Chengdu and Panzhihua exhibited the highest levels of common prosperity development. As the provincial capital, Chengdu maintained a leading position in all aspects of development within Sichuan. Panzhihua, supported by its abundant mineral resources, achieved high-level economic development through the growth of its secondary industry. Furthermore, Panzhihua has long served as a pilot city for various provincial development policies, receiving substantial support from the Sichuan provincial government. These factors helped reduce internal development disparities and promoted the realization of common prosperity. Deyang, Mianyang, and Zigong, located in the Chengdu Plain, constituted the second tier of common prosperity development. Deyang and Mianyang, as key industrial and technological bases of the province, benefited from their strategic importance and resource advantages. Zigong successfully transformed its unique cultural tourism assets and geographical strengths into developmental resources. Cities located in the western Sichuan plateau, southern Sichuan, and northeastern Sichuan fell into the third tier, with common prosperity levels slightly below the provincial average. Liangshan, Meishan, and Neijiang formed the fourth tier, characterized by relatively underdeveloped economies and likely influenced by the siphoning effects of Chengdu and Panzhihua. Bazhong, Dazhou, Guang’an, and Ziyang were ranked at the bottom in terms of common prosperity development in 2009. Overall, in 2009, Sichuan’s common prosperity landscape displayed two developed cores—the Chengdu Plain and Panzhihua—radiating outward with progressively lower levels of development, forming a spatial structure centered on these two hubs.
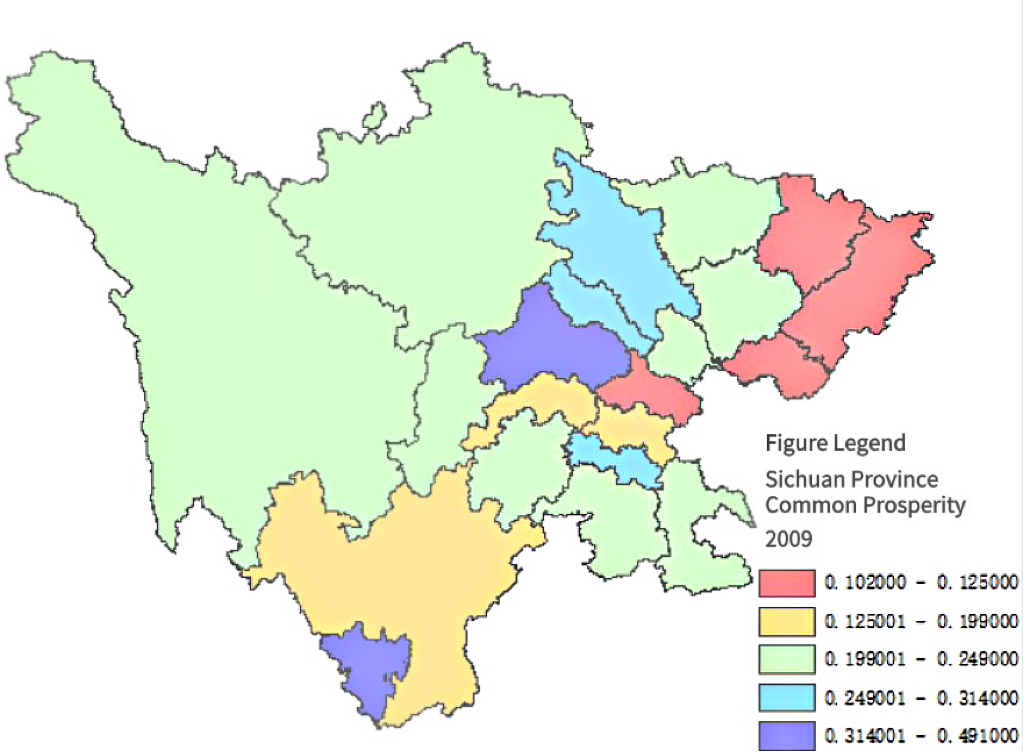
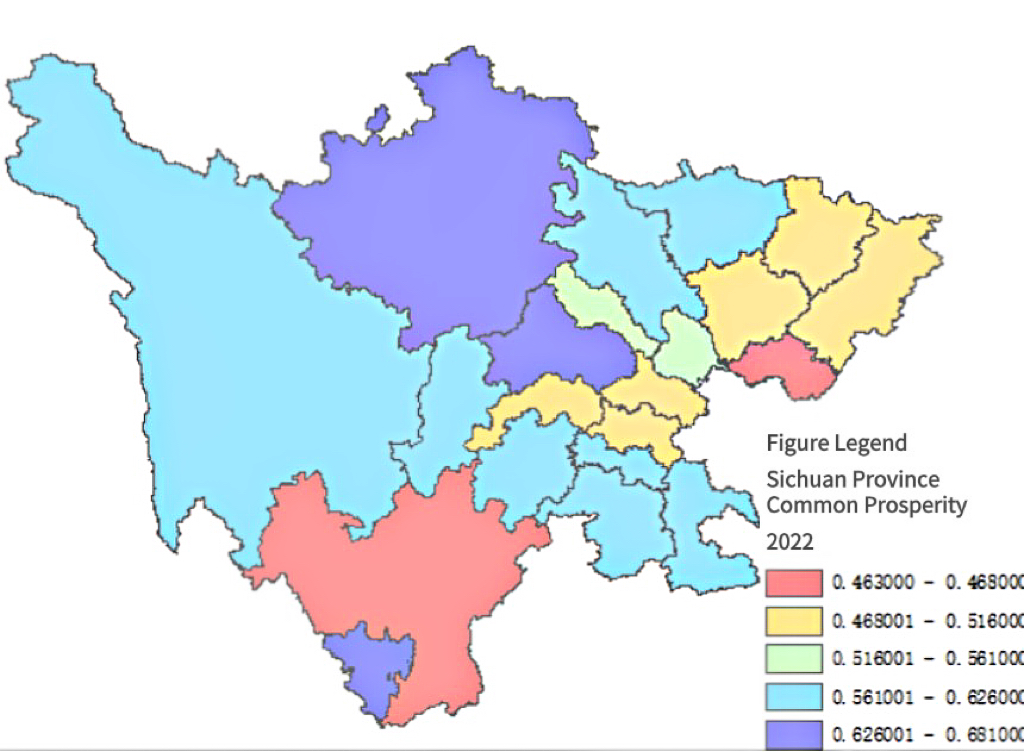
Figure 3 presents the 2022 common prosperity development levels of various prefecture-level cities in Sichuan Province. By this time, Chengdu and Panzhihua remained the leading cities in terms of common prosperity. However, Aba Zang and Qiang Autonomous Prefecture (Aba Prefecture) advanced significantly—from the third tier in 2009 to the first tier in 2022—thanks to the province's substantial support in economic development, livelihood improvement, and ecological civilization construction. Cities such as Mianyang and Deyang, which were part of the second tier in 2009, continued to maintain high levels of common prosperity. Meanwhile, several cities in the western Sichuan Plateau, northeastern, and southern Sichuan, originally in the third tier, made notable progress and moved up to the second tier. This advancement reflects the success of each city's efforts in tapping into its unique resources, cultivating competitive industries, and prioritizing balanced development across economy, society, and environment. These cities also implemented a variety of effective policies to foster common prosperity. Overall, Sichuan's common prosperity development in 2022 revealed two distinct spatial features: Higher levels in the west, lower in the east, with common prosperity levels generally decreasing from west to east. Chengdu and Panzhihua continued to serve as long-standing leaders in the province's pursuit of common prosperity, maintaining their status as central development hubs. Notably, Aba Prefecture had surpassed both Chengdu and Panzhihua by 2022, becoming the top-ranking autonomous prefecture in the province in terms of common prosperity. This transformation was driven by the comprehensive development of Aba’s natural and cultural resources, as well as effective regional strategies such as the “reduce, increase, control, shift, attract, guide” initiative and the “One Core, Two Wings” economic development framework. Compared to 2009, the entire western Sichuan region experienced significant improvement in common prosperity levels, even surpassing some cities in the Chengdu Plain. This progress reflects the crucial role played by poverty alleviation, minority support policies, and educational development initiatives implemented by the province in underdeveloped and minority areas.
5. Influencing factors of common prosperity in Sichuan Province
To explore the extent to which various factors affect the level of common prosperity in Sichuan Province, this study uses the common prosperity index calculated through the entropy method as the dependent variable. The independent variables include the proportion of the tertiary industry, natural population growth rate, total retail sales of consumer goods, per capita general public budget revenue, and the number of urban and rural residents covered by the minimum subsistence allowance system. An Ordinary Least Squares (OLS) linear regression model is employed to conduct the analysis. To satisfy the assumptions of the linear model and mitigate the influence of extreme values among certain independent variables, logarithmic transformations are applied to the following variables: total retail sales of consumer goods, per capita general public budget revenue, number of urban residents covered by the minimum subsistence allowance, and number of rural residents covered by the minimum subsistence allowance. This transformation helps reduce the absolute differences among data values.
To determine whether individual effects in the model are correlated with the explanatory variables, a Hausman test is conducted. As shown in Table 5, the test yields a p-value of 0.000, indicating statistical significance. Therefore, compared with the Random Effects (RE) model, the Fixed Effects (FE) model is deemed more appropriate and is thus adopted in this study.
|
Variable |
||
|
(1) Fixed Effects (FE) |
(2) Random Effects (RE) |
|
|
Proportion of Tertiary Industry |
0.173 |
0.282 |
|
Population Density |
-2.104 |
-1.658 |
|
Natural Population Growth Rate |
-0.006 |
-0.006 |
|
Total Retail Sales of Consumer Goods |
0.151 |
0.061 |
|
Per Capita General Public Budget Revenue |
0.022 |
0.081 |
|
Number of Urban Residents Receiving Minimum Subsistence Allowance |
-0.016 |
-0.012 |
|
Number of Rural Residents Receiving Minimum Subsistence Allowance |
-0.006 |
-0.032 |
|
_cons |
-0.401 |
-0.107 |
|
Time Fixed Effects |
Controlled |
Not Controlled |
|
Regional Fixed Effects |
Controlled |
Not Controlled |
|
Prob>chi2 |
0.0000 |
|
|
Variable |
|||
|
(1)OLS |
(2)OLS |
(3)OLS |
|
|
Proportion of Tertiary Industry |
0.282(0.051)*** |
0.173***(0.053) |
0.173***(0.066) |
|
Population Density |
-1.66(0.357)*** |
-2.104***(0.721) |
-2.104*(1.031) |
|
Natural Population Growth Rate |
-0.006(0.001)*** |
-0.006***(0.001) |
-0.006*(0.002) |
|
Total Retail Sales of Consumer Goods |
0.061(0.011)*** |
0.151***(0.017) |
0.151***(0.031) |
|
Per Capita General Public Budget Revenue |
0.081(0.010)*** |
0.022*(0.013) |
0.022(0.023) |
|
Number of Urban Residents Receiving Minimum Subsistence Allowance |
-0.123(0.008) |
-0.016*(0.009) |
-0.016(0.017) |
|
Number of Rural Residents Receiving Minimum Subsistence Allowance |
-0.032(0.010)*** |
-0.006(0.012) |
-0.006(0.033) |
|
_cons |
-0.107 |
-0.401(0.134) |
0.418(0.064) |
|
Time Fixed Effects |
Not Controlled |
Controlled |
Controlled |
|
Regional Fixed Effects |
Not Controlled |
Controlled |
Controlled |
|
Cluster-Robust Standard Errors |
Not Controlled |
Not Controlled |
Controlled |
Note: *, **, and *** denote significance at the 10%, 5%, and 1% levels, respectively. The values in parentheses in columns (1) and (2) represent standard errors. The dependent variable in the table is the level of common prosperity of each prefecture-level city and autonomous prefecture in Sichuan Province, calculated using the entropy method.
Table 6 presents the results of a linear probability model with the common prosperity level of Sichuan's prefecture-level cities and autonomous prefectures—calculated using the entropy method—as the dependent variable, and variables such as the proportion of the tertiary industry and population density as independent variables. Column (1) shows the results without controlling for time and regional fixed effects or clustering robust standard errors, while columns (2) and (3) control for both time and regional fixed effects, with column (3) further controlling for clustering robust standard errors. Table 5 indicates that, after controlling for clustering robust standard errors, the proportion of the tertiary industry, population density, natural population growth rate, and total retail sales of consumer goods significantly affect the realization of common prosperity in Sichuan Province. Specifically, the proportion of the tertiary industry and total retail sales of consumer goods have a significant positive effect: the higher the tertiary industry proportion and the greater the retail sales, the higher the level of common prosperity in Sichuan Province. In contrast, population density and natural population growth rate have significant negative effects, meaning that higher population density and higher population growth rates correspond to lower levels of common prosperity in Sichuan Province.
6. Conclusion and recommendations
This study constructed an indicator system for common prosperity in Sichuan Province, reviewed relevant policies implemented in the province, calculated the common prosperity levels of various prefecture-level cities and autonomous prefectures using the entropy method, and analyzed the temporal and spatial characteristics as well as influencing factors of common prosperity development. The main conclusions are as follows:
In terms of temporal changes, from 2010 to 2022, the overall common prosperity level in Sichuan Province and its cities and prefectures significantly improved, rising from 0.239 to 0.571. The growth rates varied among local cities and prefectures, with regions such as Guangyuan, Bazhong, and Aba Prefecture experiencing relatively rapid increases. In terms of spatial variation, the development of common prosperity exhibits a decreasing trend radiating outward from two high-level cores centered on Chengdu and Panzhihua. In 2009, high-level common prosperity cities were concentrated in the Chengdu Plain area. By 2022, except for Chengdu itself, the relative standing of other Chengdu Plain cities declined within the province, while the status of cities in southern and western Sichuan improved. This study also explored factors influencing common prosperity development. After controlling for time and regional fixed effects, it was found that population, industrial structure, and consumption are the main factors affecting common prosperity in Sichuan. Among them, industrial structure and consumption are positively correlated with common prosperity development, whereas population density and natural population growth rate are negatively correlated.
The gradual realization of common prosperity is an essential requirement of socialism. Based on the above research findings and a review of existing studies, this paper puts forward the following recommendations to further enhance the overall common prosperity level across the province and to reduce disparities in common prosperity among different regions:
1) Reasonably Guide the Development of the Tertiary Industry. The tertiary industry is characterized by diverse sectors, a broad range of categories, and a coexistence of labor-intensive and technology-intensive activities. It can absorb a large workforce and provide extensive employment opportunities in the labor market. With economic development and industrial restructuring, the tertiary sector has become an important channel for labor absorption, playing a significant role in alleviating employment pressure, promoting economic growth, and maintaining social stability. Additionally, many industries within the tertiary sector are closely related to people’s livelihood and well-being; their development is crucial for improving the quality of life and happiness of the population, thereby contributing to the realization of common prosperity. However, unreasonable development of the tertiary industry may exacerbate urban-rural and regional disparities, necessitating rational guidance. Specific measures include increasing investment in scientific research and education, enhancing talent supply and technological R&D, promoting the application of research achievements in the tertiary sector, and attracting more talents to engage in related industries. At the same time, infrastructure construction—such as transportation, communications, and water conservancy—should be strengthened in certain regions to provide basic support and a favorable environment for tertiary industry development. Encouraging private enterprises and non-public economies to enter public service sectors, while formulating relevant laws and regulations for proper guidance, is also important to cultivate competitive service enterprises.
2) Promote Consumption Growth. Consumption is one of the three major drivers of economic growth. It not only serves as the foundation of economic activities but also plays a crucial role in advancing productivity and upgrading the industrial structure. The significance of consumption is reflected in its ability to increase demand and stimulate production, create employment opportunities, and generate tax revenue that supports income redistribution. Considering the current development status of Sichuan Province, this paper proposes the following measures to promote consumption growth. Adjusting tax policies can both increase residents’ disposable income and facilitate secondary wealth redistribution, thereby narrowing the wealth gap. Under the context of a rapidly aging population in Sichuan, the development of the “silver economy” industry should be encouraged by promoting new products and services to stimulate consumption. As a major agricultural province, Sichuan’s rural consumer market holds vast potential. Efforts should be intensified to develop rural e-commerce, promote the upward flow of agricultural products, and meet urban residents’ demand for high-quality agricultural goods. Simultaneously, improving rural infrastructure and enhancing the rural consumption environment can help unlock the consumption potential of rural residents.
3) Coordinate Population, Resources, and Environment. The development of common prosperity encompasses not only economic wealth but also human development and environmental sustainability. Rapid population growth, high population density, and excessive concentration of people in a single city may lead to a mismatch between socioeconomic development speed and population growth, as well as environmental degradation caused by overexploitation. Therefore, this paper proposes the following recommendations: Accelerate the construction of metropolitan areas to promote inter-city cooperation and shared development benefits. This approach can narrow development disparities between cities, facilitate the rational allocation of population across different urban areas, and reduce the excessive concentration of population in large cities. Additionally, promote integrated urban-rural development by accelerating infrastructure construction in rural regions, fostering balanced distribution of resources such as education and industry, narrowing the urban-rural gap, and encouraging a reasonable population distribution between urban and rural areas.
Finally, this study has several limitations. First, due to constraints in data availability, the constructed common prosperity indicator system is unable to comprehensively cover all aspects of people's livelihoods, and thus the indicator system requires further improvement. Second, there are numerous factors influencing common prosperity, some of which may have reciprocal interactions with the level of common prosperity itself; therefore, the precise identification of reasonable influencing factors needs to be further refined. Lastly, regarding the policy recommendations, the significant development disparities among various prefectures and cities in Sichuan Province make it difficult to propose targeted, location-specific strategies. By further reviewing relevant literature and accumulating practical experience, it is hoped that future research can supplement and improve upon the limitations of this study.
References
[1]. Xi, J. P. (2021). Solidly promoting common prosperity.Communist Party Member, (21), 5–7.
[2]. Li, S. (2021). Goals and realization path choices of common prosperity.Economic Research Journal, 56(11), 4–13.
[3]. Liu, P. L., Qian, T., Huang, X. H., et al. (2021). Connotation, realization paths, and measurement methods of common prosperity.Management World,37(08), 117–129.
[4]. Xu, X. C., Zheng, Z. X., & Zhang, Z. W. (2019). Study on China's balanced development status and countermeasures: Comprehensive analysis based on the "Tsinghua University China Balanced Development Index."Management World,35(05), 15–28.
[5]. Chen, L. J., Yu, J. X., & Xu, Y. N. (2021). Construction of the common prosperity index model.Governance Studies,37(04), 5–16+2.
[6]. Zhang, L., Deng, Z. Q., Zhang, C. C., et al. (2023). Basic logic, pattern measurement, and regional differences of China's common prosperity.Chinese Population Science,37(05), 113–128.
[7]. Xia, J. C., & Liu, C. (2022). Towards 2035: Changes in the world economic pattern and prospects for China's economy.Globalization,(01), 58–69+135.
[8]. Xiang, Y., Lu, Q., & Li, Z. X. (2022). Digital economy development empowering common prosperity: Impact effects and mechanisms.Securities Market Herald,(05), 2–13.
[9]. Jiang, Y. Z., & Yu, J. X. (2021). The role and mechanism of the third distribution in promoting common prosperity.Zhejiang Social Sciences,(09), 76–83+157–158.
[10]. Lin, W. L., & Ji, X. K. (2022). From overcoming absolute poverty to farmers' and rural common prosperity.China Rural Economy,(08), 2–15.
[11]. Kong, X. Z., & Xie, D. D. (2022). Perspectives on urban-rural integrated development: Reports from counties.Hebei Academic Journal,42(02), 129–139.
[12]. Li, S., Chen, J. P., & Teng, Y. C. (2021). Rural revitalization on the road to common prosperity: Issues, challenges, and suggestions.Journal of Lanzhou University (Social Sciences Edition),49(03), 37–46.
Cite this article
Xu,L. (2025). An analysis of the spatiotemporal characteristics and influencing factors of common prosperity in Sichuan Province. Journal of Applied Economics and Policy Studies,18(6),1-14.
Data availability
The datasets used and/or analyzed during the current study will be available from the authors upon reasonable request.
Disclaimer/Publisher's Note
The statements, opinions and data contained in all publications are solely those of the individual author(s) and contributor(s) and not of EWA Publishing and/or the editor(s). EWA Publishing and/or the editor(s) disclaim responsibility for any injury to people or property resulting from any ideas, methods, instructions or products referred to in the content.
About volume
Journal:Journal of Applied Economics and Policy Studies
© 2024 by the author(s). Licensee EWA Publishing, Oxford, UK. This article is an open access article distributed under the terms and
conditions of the Creative Commons Attribution (CC BY) license. Authors who
publish this series agree to the following terms:
1. Authors retain copyright and grant the series right of first publication with the work simultaneously licensed under a Creative Commons
Attribution License that allows others to share the work with an acknowledgment of the work's authorship and initial publication in this
series.
2. Authors are able to enter into separate, additional contractual arrangements for the non-exclusive distribution of the series's published
version of the work (e.g., post it to an institutional repository or publish it in a book), with an acknowledgment of its initial
publication in this series.
3. Authors are permitted and encouraged to post their work online (e.g., in institutional repositories or on their website) prior to and
during the submission process, as it can lead to productive exchanges, as well as earlier and greater citation of published work (See
Open access policy for details).
References
[1]. Xi, J. P. (2021). Solidly promoting common prosperity.Communist Party Member, (21), 5–7.
[2]. Li, S. (2021). Goals and realization path choices of common prosperity.Economic Research Journal, 56(11), 4–13.
[3]. Liu, P. L., Qian, T., Huang, X. H., et al. (2021). Connotation, realization paths, and measurement methods of common prosperity.Management World,37(08), 117–129.
[4]. Xu, X. C., Zheng, Z. X., & Zhang, Z. W. (2019). Study on China's balanced development status and countermeasures: Comprehensive analysis based on the "Tsinghua University China Balanced Development Index."Management World,35(05), 15–28.
[5]. Chen, L. J., Yu, J. X., & Xu, Y. N. (2021). Construction of the common prosperity index model.Governance Studies,37(04), 5–16+2.
[6]. Zhang, L., Deng, Z. Q., Zhang, C. C., et al. (2023). Basic logic, pattern measurement, and regional differences of China's common prosperity.Chinese Population Science,37(05), 113–128.
[7]. Xia, J. C., & Liu, C. (2022). Towards 2035: Changes in the world economic pattern and prospects for China's economy.Globalization,(01), 58–69+135.
[8]. Xiang, Y., Lu, Q., & Li, Z. X. (2022). Digital economy development empowering common prosperity: Impact effects and mechanisms.Securities Market Herald,(05), 2–13.
[9]. Jiang, Y. Z., & Yu, J. X. (2021). The role and mechanism of the third distribution in promoting common prosperity.Zhejiang Social Sciences,(09), 76–83+157–158.
[10]. Lin, W. L., & Ji, X. K. (2022). From overcoming absolute poverty to farmers' and rural common prosperity.China Rural Economy,(08), 2–15.
[11]. Kong, X. Z., & Xie, D. D. (2022). Perspectives on urban-rural integrated development: Reports from counties.Hebei Academic Journal,42(02), 129–139.
[12]. Li, S., Chen, J. P., & Teng, Y. C. (2021). Rural revitalization on the road to common prosperity: Issues, challenges, and suggestions.Journal of Lanzhou University (Social Sciences Edition),49(03), 37–46.