


1. Introduction
Against the dual backdrop of China's 14th Five-Year Plan, which explicitly calls for “accelerating digital development and building new advantages in the digital economy,” and the deepening implementation of the “dual carbon” goals (carbon peaking and carbon neutrality), digital finance has emerged as a critical bridge linking supply-side financial reform with the digital transformation of the real economy. It has thus been entrusted with the strategic task of addressing regional development imbalances and driving the leap in Green Total Factor Productivity (GTFP). The State Council’s 14th Five-Year Plan for Digital Economy Development (2022) emphasizes the need to “build a data factor market system and improve the digital financial infrastructure network.” This policy rationale aligns closely with the “effective market and proactive government” synergy advocated by New Structural Economics [1] —that is, to use institutional innovation to guide digital finance in optimizing resource allocation, correcting the spatial mismatch in traditional finance, and unlocking the differentiated potential of regional productivity growth.
At the same time, the full-scale launch of the "Eastern Data, Western Computing" initiative marks a systemic shift in the spatial configuration of digital infrastructure—from simple geographic dispersion to a coordinated restructuring of computing power, data, and algorithms. This national strategy resonates with the theory of growth poles (Perroux): the eastern region, leveraging its first-mover advantage in digital technology, has become an “innovation pole” that spreads technological dividends to the central and western regions through interconnected payment and clearing networks and digital technology spillovers. Meanwhile, the central and western regions, capitalizing on their energy and land resource endowments, have become hosts for large-scale data center clusters. This not only reduces the operational costs of digital finance but also compels local industries toward green transformation, thereby fostering a virtuous cycle of “environmental regulation – technological progress – productivity improvement.”
1.1. Literature review
1.1.1. Research on digital finance
On April 1, 2020, during an inspection tour in Zhejiang Province, President Xi Jinping emphasized the importance of seizing opportunities brought by the digitalization of industries and the growth of the digital economy. He called for the acceleration of new infrastructure construction such as 5G networks and data centers, as well as the strategic deployment of emerging and future industries like digital economy, life sciences, and new materials. He also stressed the need to vigorously promote scientific and technological innovation to foster new growth drivers and form new momentum for development. As a research hotspot in recent years, digital finance has already attracted considerable academic attention. Guo, Wang, et al. [2] constructed a development index for digital inclusive finance in China and examined its spatial distribution characteristics. They found that since 2011, digital inclusive finance has made remarkable progress, with strong regional convergence. The development gap between the central-western and eastern regions has been gradually narrowing. Mu and Liu [3] investigated the impact of digital finance on corporate ESG performance. Their study revealed that digital finance improves ESG outcomes by easing firms’ financial constraints, and this positive effect is especially significant for small and medium-sized enterprises. Similarly, Zhao, Zhang and Liang [4] found that digital finance enhances entrepreneurial activity, thereby promoting high-quality economic development. They identified public entrepreneurship as a key mechanism through which the digital economy empowers high-quality growth. Xu, Zhou and Liu [5] demonstrated that the development of the digital economy has a significant positive spatial spillover effect on carbon emission reduction, with notable differences across eastern, central, and western China. Feng, Zhang and Li [6] and Ma [7] confirmed that digital finance significantly promotes green technological innovation. Furthermore, RAZZAQ and Yang [8], in their evaluation of the impact of digital finance on green growth, concluded that digital financial development fosters green economic development. Yang, Wu, and Huang [9] examined the relationship between digital finance and financial literacy, finding that financial literacy facilitates the spread of digital finance, and in turn, digital finance deepens financial literacy. This mutual reinforcement is especially evident among vulnerable groups (e.g., low-income populations, the elderly), helping to bridge the digital divide and support inclusive, high-quality development. Finally, Wu, Hu and Lin [10] studied the relationship between corporate digital transformation and capital market performance. They found that digital transformation significantly enhances stock liquidity, contributing to the stability and soundness of business operations. In summary, prior research on digital finance has yielded substantial findings, which provide a strong foundation for the present study’s analysis.
1.1.2. Research on Green Total Factor Productivity
Green Total Factor Productivity (GTFP) is a critical indicator for measuring high-quality development. In the context of the national “Lucid waters and lush mountains are invaluable assets” initiative and the strategic planning of the dual carbon goals (carbon peaking and neutrality), environmental protection has become an essential component of high-quality growth. Regarding GTFP measurement, Li and Chen [11] employed the SBM-ML method to evaluate green total factor productivity in Guangdong Province. Their results indicate a steadily rising trend in Guangdong’s GTFP over recent years. Shao, Fan and Yang [12] used an advanced Data Envelopment Analysis (DEA) approach to assess and decompose carbon emission performance across 30 Chinese provinces from 1996 to 2018. Incorporating a Spatial Durbin Model (SDM), they systematically examined the direct and indirect effects of factors such as economic structural adjustment and green technological advancement on carbon emission performance and found significant positive spatial spillover effects. Guo, Yu, and Jin [13] investigated urban GTFP in China using the Luenberger Productivity Indicator and its decomposition. They found a clear upward trend in China’s GTFP from 2000 to 2019, highlighting notable progress in the country’s sustainable development efforts. Zhao, Nakonieczny, and Jabeen [14] explored the impact of green innovation on GTFP at the city level and concluded that green innovation significantly enhances GTFP. Wang, Liu, and Chen [15] examined the relationship between enterprise digitalization and total factor productivity, revealing an evident inverted U-shaped relationship between the two. This relationship becomes more pronounced under conditions of environmental uncertainty. Ren, Zheng, and Liu et al. [16] studied the effect of emissions trading schemes on enterprise GTFP and found that such mechanisms significantly improve the GTFP of listed companies, especially in regions with stricter environmental regulations, where the promotion effect is even more evident. In summary, existing research on green total factor productivity has yielded a wealth of results, particularly at the micro level. However, studies from a macro perspective remain insufficient—especially those that address interregional interactions, which are still relatively scarce.
1.1.3. Literature review summary
To date, research on digital finance and Green Total Factor Productivity (GTFP) has produced abundant findings. Digital finance—by reshaping capital allocation efficiency, alleviating information asymmetries, and empowering technological innovation—has become a new engine for Total Factor Productivity (TFP) growth. However, there remain significant gaps in the existing literature. First, most studies focus on the direct economic effects of digital finance, while the mechanisms of spatial spillover and regional heterogeneity in its influence on GTFP are insufficiently explored. Second, in the context of unbalanced regional development, there is a pressing need for both theoretical and empirical examination of whether digital finance can foster high-quality growth or, conversely, exacerbate factor siphoning and widen the "digital divide." Key questions remain: Can the technological diffusion effect of eastern “innovation poles” benefit the central and western regions? Can the western regions, in receiving computing infrastructure, ultimately promote local high-quality development? Addressing such issues requires a comprehensive analytical framework that integrates environmental constraints and spatial interactions, providing a scientific basis for the coordinated advancement of the national unified market and the dual carbon goals.
In response, this study uses panel data from 29 Chinese provinces spanning 2011 to 2022. It first applies a non-radial SBM-GML model to measure GTFP and constructs a dynamic database of production efficiency under environmental constraints. Compared with traditional DEA methods, the SBM-GML approach enhances the identification of real productivity improvement potential across provinces by optimizing slack variables and referencing a global technological frontier, thereby producing a more robust dependent variable for analysis.
Furthermore, this research integrates the non-radial SBM-GML efficiency measurement with the Spatial Durbin Model (SDM) to build a comprehensive “efficiency evaluation–spatial interaction–mechanism deconstruction” analytical framework. Multiple spatial models are employed to capture both the direct local effects and indirect spatial spillover effects of digital finance on GTFP. In addition, sub-sample regressions are conducted for four major economic regions (eastern, central, western, and northeastern China) to reveal the regionally differentiated patterns of digital finance’s spatial effects.
1.2. Theoretical hypotheses
Yang and Zhang [17], in their study on China’s high-quality development, pointed out that there is no inherent convergence between rapid economic growth and high-quality development. Wu and Zhang [18] found that the impact of digital financial inclusion on firms’ high-quality development follows a nonlinear, inverted U-shaped relationship—that is, a moderate degree of digitalization promotes high-quality development, while excessive or insufficient digitalization may not yield the same benefits. In addition, Du, Zhao, and Tao et al. [19], in their study of the Porter Hypothesis, found that environmental regulation stimulates technological innovation and enhances firms’ total factor productivity. Digital finance can further reinforce this mechanism. For example, through innovations in green financial instruments such as carbon futures and green Asset-Backed Securities (ABS), digital finance helps internalize environmental externalities and incentivizes enterprises to adopt cleaner technologies in order to reduce emissions. Moreover, the synergy between policy tools—such as the integration of digital finance with carbon markets (e.g., using carbon quotas as collateral for financing)—can accelerate the development of clean technologies, thereby improving firms’ green total factor productivity. Based on this rationale, the first hypothesis of this study is proposed:
H1: The development of digital finance enhances green total factor productivity.
Furthermore, Li [20], in his study on growth pole theory in regional economics, concluded that economic growth initially emerges in innovation-intensive “core areas” (growth poles) and subsequently spreads to surrounding regions through diffusion effects. Lin [21], in summarizing theories of technological diffusion, noted that under the framework of New Economic Geography, information flows more efficiently over short distances than long ones. The geographic distribution of economic activity is shaped by economies of scale, transport costs, and factor mobility. Digital finance platforms (e.g., Alipay, WeChat Pay) transcend geographical boundaries, lower interprovincial transaction costs, and facilitate the flow of green technologies, equipment, and services across regions. For example, green technology firms in eastern provinces may provide technology licenses to companies in central and western provinces via digital supply chain finance. In addition, digital finance—leveraging cloud computing and big data—can support the development of cross-provincial environmental data-sharing platforms (e.g., carbon emission monitoring systems), thereby helping neighboring regions optimize resource allocation efficiency. Based on these considerations, the second hypothesis is proposed:
H2: The development of digital finance has a positive spatial spillover effect on green total factor productivity.
Given the uneven levels of digital finance development across different regions of China, the spillover effects of digital finance are also likely to differ by region. Guo, Wang et al. [2] found that digital inclusive finance in China exhibits significant overall convergence. As of 2018, regions with well-developed digital finance were primarily located east of the Hu Line, while those to the west still showed substantial room for development—though the gap was gradually narrowing. At the same time, China’s regions differ markedly in terms of industrial structure, degree of financialization, economic development level, and infrastructure quality. The relatively advanced infrastructure in the eastern region may facilitate stronger collaborative effects from digital finance across regions. Hence, the third hypothesis is proposed:
H3: The spatial spillover effect of digital finance on total factor productivity varies across different regions.
1.3. Innovations and contributions of the paper
From a theoretical perspective, this study incorporates undesirable outputs (e.g., pollutant emissions) into the SBM-GML measurement framework, thereby constructing a dynamic evaluation system for Green Total Factor Productivity (GTFP) under environmental constraints. This approach overcomes the limitations of traditional DEA models that often neglect ecological costs, offering a new paradigm for quantifying the sustainable effects of digital financial development. Moreover, by integrating multiple spatial econometric models (such as the Spatial Durbin Model, SDM) with Data Envelopment Analysis (SBM-GML), the paper builds a dual-dimensional research framework of “efficiency and space.” This enables simultaneous capture of both the direct impact of digital finance on local green productivity and its cross-regional spillover effects, addressing the methodological shortcoming in existing literature where efficiency evaluation and spatial relationships are treated separately.
From a practical standpoint, this paper conducts a regionally disaggregated analysis to systematically reveal the heterogeneous effects of digital finance on GTFP in eastern, central, western, and northeastern China. This provides a solid empirical foundation for future policy design. The study also proposes a forward-looking design strategy of “core area radiation – growth pole cultivation – peripheral area compensation,” moving beyond traditional “blood transfusion-style” regional compensation models. Instead, it advocates for a new mechanism characterized by “self-sustaining growth – coordination – sharing” empowered by digital technology. This offers a novel digital finance-based solution to the long-standing issue of regional development imbalances in China.
2. Research design
2.1. Data sources
This paper uses panel data from 29 Chinese provinces covering the period from 2011 to 2022, comprising a total of 12 years and 348 observations. The data sources include the CSMAR Database, China Statistical Yearbook, and China Environmental Statistical Yearbook. The variables used in the analysis are shown in Table 1 below:
|
Abbreviation |
Name |
Description |
|
GTFP |
Green Total Factor Productivity |
A core indicator of high-quality development across regions, measured using the SBM-GML model. |
|
dig |
Digital Financial Inclusion Index |
Provincial-level digital finance index developed by Peking University. |
|
fin |
Degree of financialization |
Following Han Feng & Yang Ligao [22], and Liu Yi, Xia Jiezhang, Li Yao [23], this variable reflects the degree of financialization. It is measured as the ratio of financial sector output to total output and used as a control variable to comprehensively assess digital finance’s effect on GTFP. |
|
foreign_invest |
Foreign investment |
Amount of foreign direct investment (FDI) in each province. |
|
lnrgdp |
GDP per capita |
Natural logarithm of per capita GDP for each province. |
|
gdp_grouth |
GDP growth rate |
GDP growth rate of each province. |
|
Consumption |
Consumption level |
Consumption index of each province. |
|
GBE |
General Budget Expenditures |
Total general fiscal expenditure of each province. |
|
LOR |
Labor input |
Average annual employment (labor input) in each province. |
|
GDP |
Gross domestic product |
Gross Domestic Product of each province. |
|
SO2 |
Sulphur dioxide emissions |
Total sulfur dioxide (SO₂) emissions in each province. |
2.2. Model construction
In the context of the coordinated advancement of the dual carbon goals and the high-quality development strategy, the measurement of Green Total Factor Productivity (GTFP) has shifted from a single economic-efficiency dimension toward a multidimensional framework integrating economic, environmental, and social aspects. Traditional DEA models, due to their neglect of slack in undesirable outputs and directional bias, struggle to accurately assess true production efficiency under environmental regulations. To address this issue, this study constructs a dynamic efficiency analysis framework by integrating the Slacks-Based Measure (SBM) model—enhanced to account for slack variables—with the Global Malmquist-Luenberger (GML) index. Using panel data from 29 Chinese provincial-level administrative units from 2011 to 2022 (excluding Tibet and Qinghai), the model systematically analyzes the driving mechanisms of total factor productivity growth under environmental constraints.
Drawing on the dynamic calculation approach of Li and Chen [11], the year 2011 is used as the base period, and each province in each year is treated as an independent Decision-Making Unit (DMU). The model is constructed as follows: assume there are n DMUs, denoted as DMUj(j = 1, 2, …, n). Each DMU has m inputs, denoted as xi(i = 1, 2, …, m), q₁ desirable outputs yr(r = 1, 2, …, q1), and q₂ undesirable outputs bt(t=1,2,3……q2). The DMU under evaluation is denoted as DMU₀. The SBM model with undesirable outputs is expressed as Equation (1):
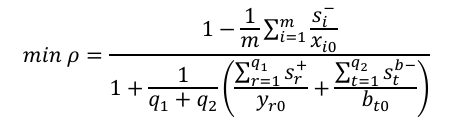 (1)
(1)
Equation (1) defines the calculation method for the SBM model with undesirable outputs. The constraints s.t. represent the input, desirable output, and undesirable output conditions, respectively. Here,
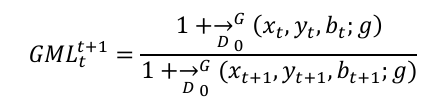
The Global Malmquist-Luenberger (GML) index is a classic method for measuring dynamic changes in total factor productivity that includes undesirable outputs (e.g., carbon emissions, pollutants). Its core formula is shown in Equation (2):
 (7)
(7)
In Equation (7),
First, use the SBM model to compute the efficiency score for the base year (2011) via static linear programming.
Second, leverage the transitivity property of the GML index (cumulative multiplicative form) to calculate each DMU's relative efficiency score for subsequent years compared to the base year. That is, the GML index does not yield absolute productivity levels per year, but rather the relative GTFP compared to 2011:
(8)
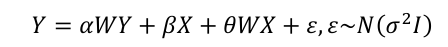
Next, the Spatial Durbin Model (SDM), one of the core models in spatial econometrics, is employed. By incorporating both the spatial lag of the dependent variable and the spatial lag of the explanatory variables, the SDM can effectively capture spatial dependence, spillover effects, and local impacts. The SDM model is specified as follows:
 (9)
(9)
In Equation (9), Y denotes the dependent variable, W is the spatial weight matrix, X is the matrix of explanatory and control variables, ε is the error term,
3. Total factor productivity measurement
Total Factor Productivity (TFP) is first measured using the Slack-Based Measure (SBM) model calculated via STATA, followed by calculating the Global Malmquist-Luenberger (GML) index using MATLAB software. Drawing on the variable selection approach proposed by Li and Chen [11], the conventional capital variable typically uses the total fixed asset investment as a standard. However, since the publication standards changed after 2018, tests on related variables showed a strong correlation between general public fiscal expenditure and total fixed asset investment. Moreover, Granger causality tests confirmed this relationship. Therefore, to ensure data consistency over time and considering that Green Total Factor Productivity (GTFP) is a comprehensive indicator measuring high-quality development—not only reflecting capital input—general public fiscal expenditure is used as a proxy for fixed asset investment in perpetual inventory method to estimate capital stock K (with a depreciation rate of 9.6%). The average annual employment in each province is used as labor input L, the provincial annual GDP (in trillions) as the desired output Y, and the annual sulfur dioxide emissions as the undesired output (undesirable Y). The SBM efficiency results for 2011 calculated by STATA are shown in Table 2:
|
Obs |
mean |
sd |
min |
max |
|
|
TE |
29 |
0.58617 |
0.2845 |
0.2123 |
1 |
|
S_GBE |
29 |
5571535 |
5254353 |
5.45e-08 |
1.50e+07 |
|
S_LOR |
29 |
1046.157 |
936.1728 |
3.27e-12 |
3391.072 |
|
S_GDP |
29 |
0.00059 |
0.0022148 |
5.70e-20 |
0.01165 |
|
S_SO2 |
29 |
318778.7 |
283592.7 |
1.09e-08 |
1004025 |
Here, TE represents the SBM efficiency in 2011; S_GBE and S_LOR denote input redundancies; S_GDP denotes output shortfall of the desired output; S_SO2 indicates the slack of the undesired output. From the table, it is evident that significant differences in GTFP exist among provinces in 2011.
After obtaining the SBM results for the base year, the GML index is computed using MATLAB. Following the same approach, annual GTFP is calculated, with partial provincial results shown in Table 3. Detailed results are provided in Appendix A.
|
pro |
2011 |
2012 |
2013 |
2014 |
2015 |
2016 |
|
Beijing |
1 |
0.995753 |
0.998102 |
1.007652 |
0.996247 |
1.006827 |
|
Liaoning |
0.579066 |
0.575865 |
0.571458 |
0.583199 |
0.598342 |
0.566694 |
|
Jiangsu |
0.972517 |
0.975405 |
1.032759 |
0.996077 |
0.997126 |
1.028542 |
|
Guangdong |
1 |
1.004822 |
0.998788 |
1.011227 |
0.982983 |
1.024581 |
|
Sichuan |
0.398569 |
0.396797 |
0.396966 |
0.402096 |
0.401445 |
0.418741 |
|
Shaanxi |
0.387551 |
0.391032 |
0.391599 |
0.396241 |
0.389494 |
0.403145 |
|
2017 |
2018 |
2019 |
2020 |
2021 |
2022 |
|
1.035396 |
1.094972 |
1.180713 |
1.226706 |
1.369446 |
1.369446 |
|
0.571745 |
0.586661 |
0.579924 |
0.577106 |
0.59025 |
0.592358 |
|
1.056863 |
1.082481 |
1.106624 |
1.153125 |
1.292778 |
1.37772 |
|
1.087732 |
1.07355 |
1.121982 |
1.161101 |
1.2738 |
1.431221 |
|
0.434251 |
0.435676 |
0.446216 |
0.446773 |
0.458694 |
0.471186 |
|
0.414239 |
0.42189 |
0.424109 |
0.425797 |
0.437265 |
0.437185 |
The results indicate that overall, GTFP has maintained a steady upward trend since 2011, demonstrating China's steady progress toward high-quality economic development. However, clear disparities exist among provinces, with marked regional differences. The growth magnitude is also influenced by geographic distribution, suggesting the presence of regional characteristics among provinces, which provides a basis for studying spatial spillover effects.
4. Spatial econometric analysis
4.1. Descriptive statistics
The descriptive statistics of the relevant variables are presented in Table 4. The table shows that significant differences exist among provinces in terms of GTFP and dig over the 12-year period, providing a foundational premise for the regression analysis and research in this paper.
|
Variable |
Obs |
Mean |
Std. dev. |
Min |
Max |
|
GTFP |
348 |
0.6068 |
0.3043 |
0.0251 |
1.4312 |
|
dig |
348 |
245.2034 |
107.7062 |
18.4700 |
460.6900 |
|
lnrgdp |
348 |
10.9170 |
0.4562 |
9.7058 |
12.1564 |
|
fin |
348 |
0.0702 |
0.0323 |
0.0196 |
0.1991 |
|
gdp_grouth |
348 |
0.0903 |
0.0672 |
-0.2502 |
0.2988 |
|
Consumption |
348 |
102.3075 |
1.1727 |
100.1000 |
106.3380 |
|
foreign_invest |
348 |
2814.2070 |
5544.5060 |
30.9821 |
56704.0000 |
4.2. Correlation test
A correlation test was conducted on the explanatory variables, with the results shown in Table 5. The results indicate no strong correlations among the explanatory variables, although some variables exhibit moderate correlations. To ensure robustness of the results, a Variance Inflation Factor (VIF) test was performed, with results shown in Table 6. The VIF test confirms the absence of significant multicollinearity, thus supporting the feasibility of subsequent regression analysis.
|
dig |
lnrgdp |
fin |
gdp_grouth |
con~ |
for~ |
|
|
dig |
1.0000 |
|||||
|
lnrgdp |
0.6666 |
1.0000 |
||||
|
fin |
0.4837 |
0.6469 |
1.0000 |
|||
|
gdp_grouth |
-0.3936 |
0.2012 |
-0.2081 |
1.0000 |
||
|
con~ |
-0.5970 |
-0.2662 |
-0.2039 |
0.4346 |
1.0000 |
|
|
for~ |
0.3877 |
0.4295 |
0.2643 |
-0.0612 |
-0.1226 |
1.0000 |
|
Variable |
VIF |
1/VIF |
|
dig |
2.92 |
0.3423 |
|
lnrgdp |
2.60 |
0.3842 |
|
fin |
1.76 |
0.5672 |
|
gdp_grouth |
1.75 |
0.5719 |
|
con~ |
1.29 |
0.7738 |
|
for~ |
1.27 |
0.7852 |
|
Mean vif |
1.93 |
4.3. Spatial correlation test
To determine the feasibility of conducting spatial effects analysis, a spatial correlation test was conducted. Moran’s I global spatial autocorrelation coefficient was used for this purpose. The spatial weight matrices were constructed with reference to the economic-geographical nested matrix method developed by Guo Yuqing and Sun Xifang (2017). For each year, matrices were constructed according to that year’s GDP data. The results of the global Moran’s I indices for GTFP and dig over the 12 years are presented in Table 7.
|
Year |
TFP(I) |
p-value* |
DIG(I) |
p-value* |
|
2011 |
0.239 |
0.000 |
0.211 |
0.001 |
|
2012 |
0.216 |
0.000 |
0.185 |
0.000 |
|
2013 |
0.155 |
0.006 |
0.177 |
0.002 |
|
2014 |
0.130 |
0.000 |
0.148 |
0.000 |
|
2015 |
0.118 |
0.007 |
0.115 |
0.007 |
|
2016 |
0.161 |
0.000 |
0.162 |
0.000 |
|
2017 |
0.149 |
0.006 |
0.162 |
0.002 |
|
2018 |
0.123 |
0.000 |
0.148 |
0.000 |
|
2019 |
0.113 |
0.000 |
0.147 |
0.000 |
|
2020 |
0.127 |
0.000 |
0.150 |
0.000 |
|
2021 |
0.136 |
0.000 |
0.166 |
0.000 |
|
2022 |
0.155 |
0.003 |
0.164 |
0.002 |
The results show that the p-values for all years are less than 0.01, and the corresponding Moran’s I values are positive. Therefore, the null hypothesis is rejected, indicating significant positive spatial autocorrelation. To further validate these results, a local Moran’s I test was conducted, with the mapping results shown in Figures 1 and 2. (ID reference can be found in Appendix A)
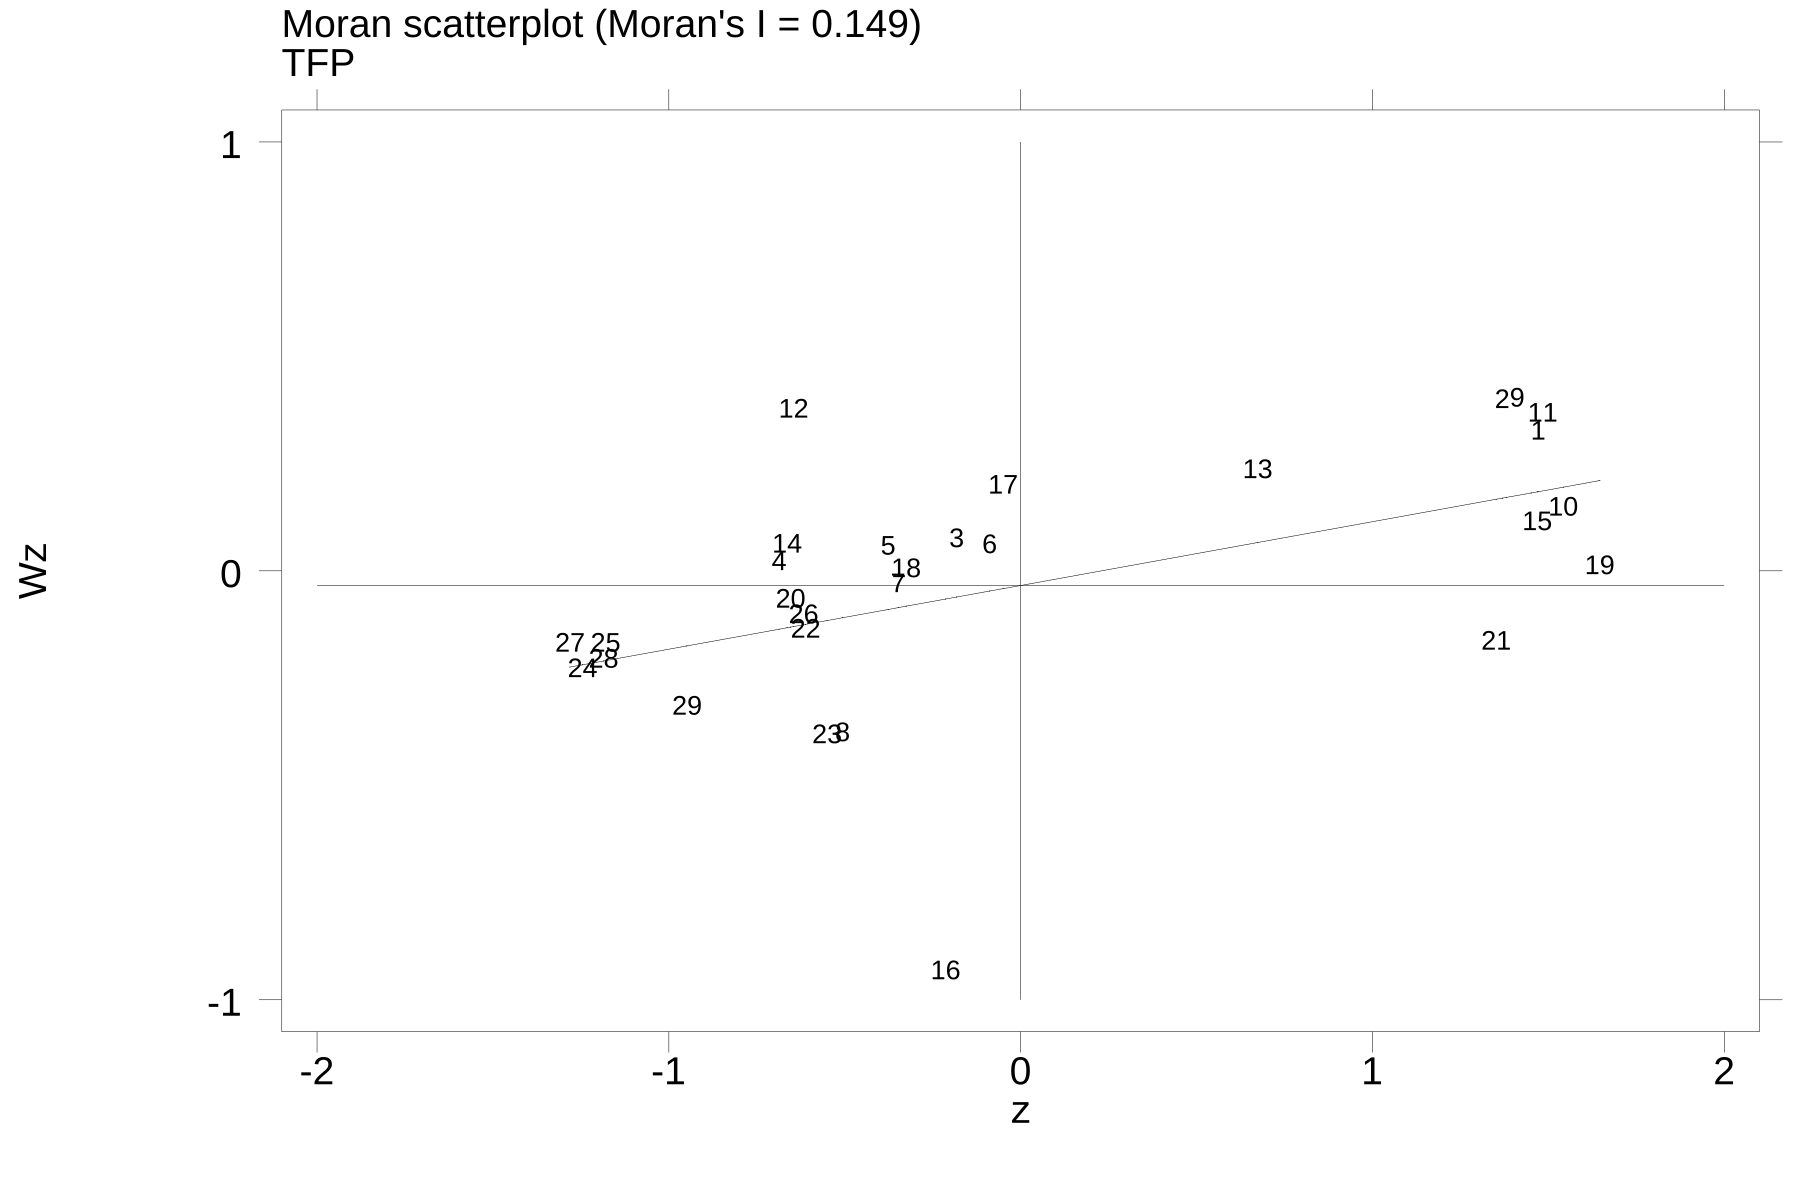
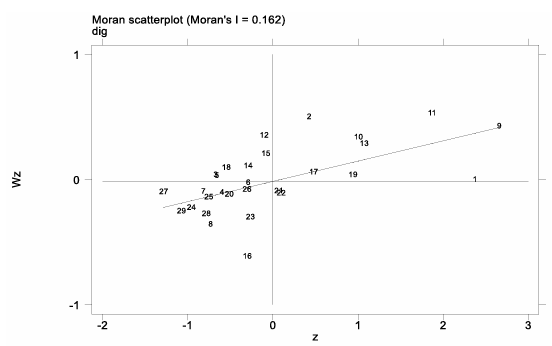
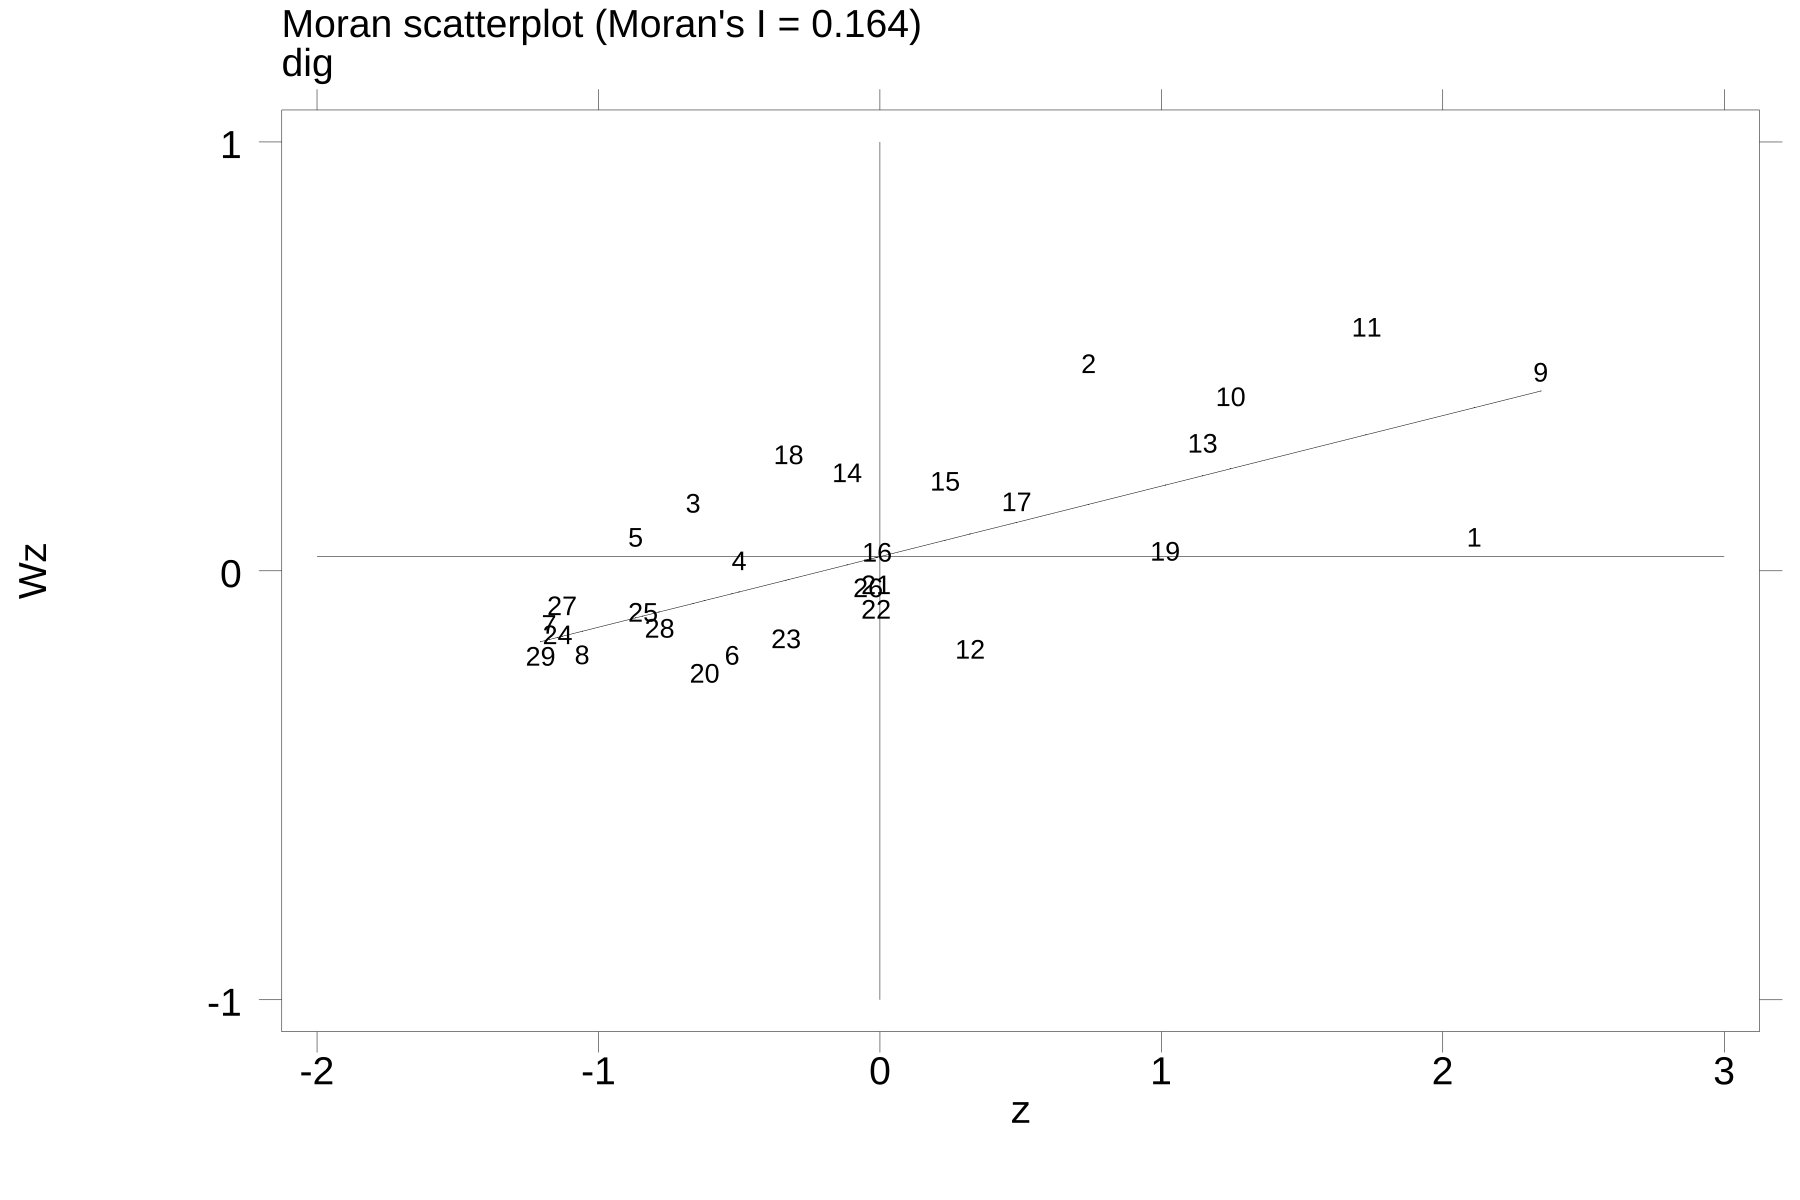
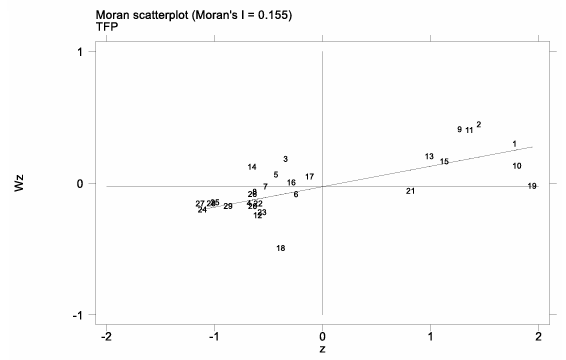
The results of the local Moran’s I maps show that most provinces exhibit positive spatial autocorrelation, further confirming the earlier test results and indicating that spatial effects analysis is feasible.
4.4. Model selection analysis
To determine the appropriate model, the Lagrange Multiplier (LM) tests were first conducted, with results presented in Table 8. The test results reveal that Moran’s I statistic is 173.128 (p = 0.000), strongly rejecting the null hypothesis of “no spatial autocorrelation,” indicating significant spatial dependence in the residuals. Both the LM and robust LM tests return p-values of 0.000, strongly rejecting their null hypotheses, suggesting significant spatial error autocorrelation. Meanwhile, the LM-lag test results show a significant p-value of 0.000 for the robust LM-lag but a non-significant p-value for the standard LM-lag test, indicating the possible presence of spatial lag effects. Given this, the Spatial Durbin Model (SDM), which accounts for both spatial lag and spatial error effects, is preliminarily considered the most appropriate choice.
|
Test |
Statistic |
P-value |
|
Spatial error: |
||
|
Moran's I |
173.128 |
0.000 |
|
Lagrange multiplier |
14.405 |
0.000 |
|
Robust Lagrange multiplier |
21.743 |
0.000 |
|
Spatial lag: |
||
|
Lagrange multiplier |
0.103 |
0.748 |
|
Robust Lagrange multiplier |
7.441 |
0.006 |
To further determine the optimal model, regressions with time-fixed effects, individual-fixed effects, and two-way fixed effects were conducted. Subsequent information criteria (IR tests) yielded test statistics of 889.92 (p = 0.000) comparing two-way fixed effects with time-fixed effects, and 106.88 (p = 0.000) comparing two-way fixed effects with individual-fixed effects, indicating that the two-way fixed effects model is optimal. For model selection among the Spatial Autoregressive (SAR) Model, Spatial Error Model (SEM), and Spatial Durbin Model (SDM), all three were estimated under two-way fixed effects, and Likelihood Ratio (LR) tests were performed. The LR test statistics were 101.59 (p = 0.000) for SDM vs. SAR and 102.86 (p = 0.000) for SDM vs. SEM, suggesting that the SDM outperforms the SAR and SEM models. Finally, to verify whether the SDM degenerates into SAR or SEM models, Wald tests were conducted based on the SDM regression results. The Wald statistics were 84.09 (p = 0.000) for SDM vs. SAR and 99.28 (p = 0.000) for SDM vs. SEM, both strongly rejecting the null hypothesis. This indicates that the SDM does not degenerate into either the SAR or SEM model. In summary, the Spatial Durbin Model with two-way fixed effects will be employed for the analysis.
4.5. Regression results analysis
The regression results of the relevant variables using the Spatial Durbin Model (SDM) with two-way fixed effects are shown in Table 9. From the regression output, it can be observed that dig (digital development) has a significant positive impact on GTFP, both in terms of its direct and indirect effects. This indicates a clear positive spillover effect between neighboring provinces—whether viewed from economic or geographic perspectives. This finding aligns with the initial expectations: digital development promotes the GTFP of the province itself and also exerts positive externalities on surrounding provinces. Hypothesis 1 and Hypothesis 2 are thus validated. Furthermore, lnrgdp (the natural logarithm of real GDP) has a positive effect on the local province's GTFP but a negative effect on neighboring provinces, which could be attributed to a talent siphoning effect—provinces with higher living standards tend to attract more talent, depriving surrounding regions of human capital. In contrast, the GDP growth rate shows a suppressive effect on the province's GTFP, possibly due to the environmental degradation associated with rapid development. This underscores the necessity for China to pursue high-quality development. The regression coefficient ρ (rho) is significantly positive, indicating the presence of spatial autocorrelation in the dependent variable, GTFP. This is consistent with the Moran’s I results discussed earlier, providing mutual validation. It suggests that provinces with higher GTFP levels may drive improvements in the GTFP of neighboring provinces, displaying the characteristics of growth pole effects.
|
VARIABLES |
(1) |
(2) |
(3) |
(4) |
(5) |
(6) |
(7) |
|
Main |
Wx |
Spatial |
Variance |
LR_Direct |
LR_Indirect |
LR_Total |
|
|
dig |
0.000820** |
0.00261*** |
0.00122*** |
0.00350*** |
0.00471*** |
||
|
(0.000350) |
(0.000441) |
(0.000341) |
(0.000497) |
(0.000581) |
|||
|
fin |
0.762*** |
0.294 |
0.816*** |
0.619 |
1.435*** |
||
|
(0.274) |
(0.382) |
(0.269) |
(0.431) |
(0.534) |
|||
|
foreign_invest |
7.70e-07 |
7.61e-07 |
9.61e-07* |
1.30e-06 |
2.27e-06* |
||
|
(4.76e-07) |
(8.13e-07) |
(5.01e-07) |
(1.01e-06) |
(1.34e-06) |
|||
|
lnrgdp |
0.116*** |
-0.180*** |
0.0951*** |
-0.180*** |
-0.0850* |
||
|
(0.0265) |
(0.0405) |
(0.0258) |
(0.0458) |
(0.0513) |
|||
|
gdp_grouth |
-0.0781* |
0.0220 |
-0.0783* |
-0.00473 |
-0.0830 |
||
|
(0.0415) |
(0.0651) |
(0.0436) |
(0.0792) |
(0.105) |
|||
|
Consumption |
0.0122** |
0.0127** |
0.0148*** |
0.0206** |
0.0354*** |
||
|
(0.00487) |
(0.00632) |
(0.00529) |
(0.00891) |
(0.0125) |
|||
|
rho |
0.274*** |
||||||
|
(0.0492) |
|||||||
|
sigma2_e |
0.000986*** |
||||||
|
(7.60e-05) |
|||||||
|
Observations |
348 |
348 |
348 |
348 |
348 |
348 |
348 |
|
R-squared |
0.126 |
0.126 |
0.126 |
0.126 |
0.126 |
0.126 |
0.126 |
|
Number of id |
29 |
29 |
29 |
29 |
29 |
29 |
29 |
Standard errors in parentheses
*** p<0.01, ** p<0.05, * p<0.1
4.6. Robustness test
To verify the robustness of the results, the SAR and SEM were employed for regression analysis. The results of the SAR model are shown in Table 10. The regression results reveal that the rho coefficient remains significantly positive, consistent with previous findings, indicating the existence of positive spatial autocorrelation. The regression results of the SEM model are presented in Table 11. The lambda coefficient is significantly positive, indicating that unobserved factors in neighboring regions exert a significant positive influence on the dependent variable (i.e., GTFP) in the current region. This finding is in line with the results obtained from the previous SDM model analysis.
|
VARIABLES |
(1) Main |
(2) Spatial |
(3) Variance |
(4) LR_Direct |
(5) LR_Indirect |
(6) LR_Total |
|
dig |
0.00209*** |
0.00224*** |
0.00100*** |
0.00324*** |
||
|
(0.000329) |
(0.000350) |
(0.000218) |
(0.000506) |
|||
|
fin |
0.386 |
0.397 |
0.178 |
0.575 |
||
|
(0.271) |
(0.282) |
(0.134) |
(0.413) |
|||
|
foreign_invest |
4.58e-07 |
5.38e-07 |
2.46e-07 |
7.84e-07 |
||
|
(4.87e-07) |
(5.01e-07) |
(2.40e-07) |
(7.36e-07) |
|||
|
lnrgdp |
0.0505** |
0.0530* |
0.0242* |
0.0771* |
||
|
(0.0250) |
(0.0270) |
(0.0137) |
(0.0401) |
|||
|
gdp_grouth |
-0.0308 |
-0.0328 |
-0.0150 |
-0.0477 |
||
|
(0.0441) |
(0.0459) |
(0.0217) |
(0.0673) |
|||
|
Consumption |
0.0109** |
0.0119** |
0.00537** |
0.0173** |
||
|
(0.00511) |
(0.00541) |
(0.00271) |
(0.00797) |
|||
|
rho |
0.351*** |
|||||
|
(0.0475) |
||||||
|
sigma2_e |
0.00116*** |
|||||
|
(9.05e-05) |
||||||
|
Observations |
348 |
348 |
348 |
348 |
348 |
348 |
|
R-squared |
0.125 |
0.125 |
0.125 |
0.125 |
0.125 |
0.125 |
|
Number of id |
29 |
29 |
29 |
29 |
29 |
29 |
Standard errors in parentheses
*** p<0.01, ** p<0.05, * p<0.1
|
VARIABLES |
(1) Main |
(2) Spatial |
(3) Variance |
|
dig |
0.00175*** |
||
|
(0.000460) |
|||
|
fin |
0.357 |
||
|
(0.292) |
|||
|
foreign_invest |
2.35e-07 |
||
|
(4.83e-07) |
|||
|
lnrgdp |
0.0659** |
||
|
(0.0295) |
|||
|
gdp_grouth |
-0.0286 |
||
|
(0.0450) |
|||
|
Consumption |
0.00649 |
||
|
(0.00510) |
|||
|
lambda |
0.330*** |
||
|
(0.0658) |
|||
|
sigma2_e |
0.00125*** |
||
|
(9.93e-05) |
|||
|
Observations |
348 |
348 |
348 |
|
R-squared |
0.155 |
0.155 |
0.155 |
|
Number of id |
29 |
29 |
29 |
Standard errors in parentheses
*** p<0.01, ** p<0.05, * p<0.1
To further verify the robustness and considering that the diffusion of digital finance depends more on information technology infrastructure rather than traditional transportation systems, this study, referring to the approach of XX, constructs an inverse squared economic distance matrix. Based on this revised spatial matrix, the SDM model was re-estimated using the same dataset. The regression results are shown in Table 12. The findings remain broadly consistent with previous results. The coefficient of Wx (spatial lag of dig) is significantly positive, further confirming that the development of digital finance has a clear and positive spatial spillover effect on total factor productivity. This provides strong evidence of the robustness of the findings.
|
VARIABLES |
(1) Main |
(2) Wx |
(3) Spatial |
(4) Variance |
(5) LR_Direct |
(6) LR_Indirect |
(7) LR_Total |
|
dig |
0.00188*** |
0.00149*** |
0.00213*** |
0.00235*** |
0.00448*** |
||
|
(0.000292) |
(0.000396) |
(0.000295) |
(0.000435) |
(0.000552) |
|||
|
fin |
0.0216 |
1.353*** |
0.174 |
1.619*** |
1.792*** |
||
|
(0.238) |
(0.334) |
(0.240) |
(0.425) |
(0.567) |
|||
|
foreign_invest |
9.93e-07** |
8.36e-07 |
1.17e-06** |
1.28e-06 |
2.44e-06* |
||
|
(4.84e-07) |
(8.37e-07) |
(5.05e-07) |
(1.00e-06) |
(1.31e-06) |
|||
|
lnrgdp |
0.0493*** |
-0.0596*** |
0.0590*** |
-0.0673*** |
-0.00823 |
||
|
(0.0120) |
(0.0153) |
(0.0111) |
(0.0127) |
(0.0174) |
|||
|
gdp_grouth |
-0.0343 |
-0.0627 |
-0.0436 |
-0.0804 |
-0.124 |
||
|
(0.0415) |
(0.0647) |
(0.0426) |
(0.0781) |
(0.102) |
|||
|
Consumption |
0.0148*** |
0.0112* |
0.0166*** |
0.0179** |
0.0345*** |
||
|
(0.00498) |
(0.00655) |
(0.00510) |
(0.00803) |
(0.0110) |
|||
|
rho |
0.243*** |
||||||
|
(0.0504) |
|||||||
|
sigma2_e |
0.00107*** |
||||||
|
(8.22e-05) |
|||||||
|
Observations |
348 |
348 |
348 |
348 |
348 |
348 |
348 |
|
R-squared |
0.107 |
0.107 |
0.107 |
0.107 |
0.107 |
0.107 |
0.107 |
|
Number of id |
29 |
29 |
29 |
29 |
29 |
29 |
29 |
Standard errors in parentheses
*** p<0.01, ** p<0.05, * p<0.1
5. Heterogeneity analysis
Given the significant differences in industrial structures and levels of digital development across various regions in China, the impact of digital finance on Green Total Factor Productivity (GTFP) is unlikely to be uniform across all provinces. Therefore, this study divides the 29 participating provinces into four groups—Eastern, Northeastern, Central, and Western—and conducts separate SDM regressions for each group. The corresponding indirect effect coefficients are summarized, and the integrated results are presented in Table 13. The results indicate that the impact of digital finance development on GTFP varies across regions, thereby supporting Hypothesis H3. Specifically, in the Eastern region, due to its well-developed infrastructure and advanced level of economic development, the positive spatial spillover effect of digital finance on GTFP is more pronounced. In the Western region, digital finance also shows a positive impact on GTFP, which may be attributed to the national Western Development Strategy. However, compared to the Eastern region, the Western region experiences a siphoning effect, as evidenced by the significantly negative coefficients of lnrgdp and fin. Economically developed provinces may attract more talent and resources, potentially exerting negative effects on neighboring provinces' GTFP, thereby offsetting part of the policy impact. The situation in the Northeastern and Central regions appears more severe. The Northeastern region has suffered significant population loss in recent years and, as a traditional heavy industrial base in China, faces challenges in achieving a high-quality transformation due to the high costs and long cycles involved. The diffusion of digital finance, influenced by factors such as population mobility and industrial structure, has failed to generate positive spillover effects; instead, a siphoning effect is observed. In the Central region, which serves as a transitional zone between the Eastern and Western regions, it lacks both the economic advantage of the East and the policy support received by the West. Fierce competition for resources and technology among provinces has resulted in an even more significant siphoning effect. This suggests that further policy guidance and support are needed to mitigate these disparities.
|
VARIABLES |
Eastern Region |
Central Region |
Western Region |
Northeastern Region |
|
dig |
0.00554*** |
-0.00146*** |
0.000466* |
-0.00253* |
|
(0.00103) |
(0.000437) |
(0.000266) |
(0.00138) |
|
|
fin |
1.297* |
-0.192 |
-0.460*** |
1.192 |
|
(0.672) |
(0.378) |
(0.160) |
(1.185) |
|
|
foreign_invest |
-4.62e-06*** |
8.84e-06* |
1.56e-06 |
5.53e-05*** |
|
(8.90e-07) |
(4.96e-06) |
(1.45e-06) |
(1.53e-05) |
|
|
lnrgdp |
0.0235 |
0.00599 |
-0.0596*** |
0.241** |
|
(0.0778) |
(0.0366) |
(0.0153) |
(0.0944) |
|
|
gdp_grouth |
0.000889 |
-0.0232 |
-0.00328 |
-0.0737 |
|
(0.132) |
(0.0346) |
(0.0318) |
(0.140) |
|
|
Consumption |
0.0248** |
-0.00314 |
0.000373 |
0.0194* |
|
(0.0117) |
(0.00636) |
(0.00247) |
(0.0102) |
|
|
rho |
0.189** |
-0.471*** |
0.275*** |
-0.214 |
|
(0.0829) |
(0.123) |
(0.0850) |
(0.178) |
|
|
sigma2_e |
0.00116*** |
1.75e-05*** |
3.99e-05*** |
1.72e-05*** |
|
(0.000151) |
(3.12e-06) |
(5.21e-06) |
(3.76e-06) |
|
|
Observations |
120 |
72 |
120 |
36 |
|
R-squared |
0.196 |
0.059 |
0.140 |
0.046 |
|
Number of id |
10 |
6 |
10 |
3 |
Standard errors in parentheses
*** p<0.01, ** p<0.05, * p<0.1
6. Conclusion and recommendations
By systematically constructing a Spatial Durbin Model (SDM), this study verifies the existence of a significant positive relationship between the development of digital finance and Green Total Factor Productivity (GTFP). The empirical results demonstrate that digital finance not only significantly enhances local green production efficiency (direct effect coefficient β=0.000820**, significant at the 5% level), but also exerts positive spillover effects on neighboring regions (indirect effect
In response, this paper proposes a “Core Radiation – Growth Pole Cultivation – Peripheral Compensation” development strategy: First, in eastern core areas such as the Yangtze River Delta and the Guangdong–Hong Kong–Macao Greater Bay Area, efforts should focus on strengthening technological innovation capacity and institutional spillover mechanisms. This includes establishing joint innovation centers for digital finance and green technologies, promoting the diffusion of technologies like blockchain and artificial intelligence across industrial chains. In parallel, core-region computing power platforms should be opened for public access to build a shared cross-regional digital infrastructure network, thereby expanding the radius of technology spillovers. Second, in high-potential western regions such as the Chengdu–Chongqing Economic Circle and the Guanzhong Plain, efforts should focus on cultivating new growth poles by integrating digital finance development with ecological governance projects, guiding the targeted agglomeration of key production factors, and overcoming the “digital divide” in technological adoption and capability. Finally, for the old industrial bases in the northeast and transitional zones in central China, a comprehensive transformation compensation system should be established. This includes the creation of a digital transformation fund to provide direct subsidies to related industries, and the construction of a “Central China Green Finance Corridor”. Through institutional innovation, these initiatives can offset siphoning effects and ensure regional coordination. Furthermore, a national unified digital talent certification system and data element circulation platform should be established to facilitate cross-regional government data sharing and flexible allocation of computing power resources. The Gross Ecosystem Product (GEP) should also be incorporated into fiscal transfer payment evaluations, ultimately forming a virtuous cycle of “core-driven innovation, distinctive growth pole development, and institutional compensation for peripheral regions.”
7. Limitations and future outlook
This study constructs a spatial econometric model and an efficiency analysis framework to preliminarily reveal the mechanisms through which digital finance affects Green Total Factor Productivity (GTFP) and the spatial heterogeneity of these effects. However, several limitations remain that warrant further exploration. First, in terms of data granularity, this study relies on province-level panel data for empirical analysis. While such data captures broad regional development patterns, it falls short in identifying intra-urban cluster dynamics, such as gradients of technology diffusion and the effects of administrative boundaries. This limitation is particularly relevant in cross-provincial innovation corridors such as the Yangtze River Delta and the Guangdong–Hong Kong–Macao Greater Bay Area, where technology spillovers may transcend provincial administrative units. Future research should consider constructing a multi-level nested dataset (province–city–county) and adopt methodologies such as multi-scale geographically weighted regression to better reveal the spatial spillover effects of digital finance.
Second, in terms of thematic depth, this study focuses primarily on the direct relationship between digital finance and green productivity as well as its spatial effects, but does not yet systematically analyze the mediating mechanisms of technological innovation, factor reallocation, and institutional transformation. Future research could explore indirect effects of digital finance through mediating variables such as green patent output and carbon market liquidity, especially focusing on how these mechanisms differ across regions—a topic that merits in-depth investigation.
Third, the heterogeneity analysis in this paper has not yet been fully integrated with China’s New Urbanization Strategy. Future research may consider focusing on the following areas: (1) In relation to the “East-to-West Computing Resource Transfer” (East-Data-West-Computing) project, examine the spatial alignment efficiency of computing infrastructure and its leverage effect on green technology diffusion. (2) From the perspective of land-sea coordination, establish a digital value chain co-construction mechanism between coastal core cities and inland node cities, in order to resolve the “green transformation isolation” problem in peripheral regions. These future directions will not only enrich the theoretical system of digital economic geography, but also provide policy recommendations and decision-making support for China’s national regional coordination strategy.
References
[1]. Lin, Y., He, D. X., Fan, C. L., et al. (2021). Forging ahead in the new era and embarking on a new journey: A discussion on studying and implementing the spirit of the Fifth Plenary Session of the 19th CPC Central Committee (Part II).Economic Research Journal, 56(1), 4–25.
[2]. Guo, F., Wang, J. Y., Wang, F., et al. (2020). Measuring the development of digital inclusive finance in China: Index construction and spatial characteristics.China Economic Quarterly, 19(4), 1401–1418. https: //doi.org/10.13821/j.cnki.ceq.2020.03.12
[3]. Mu, W. W., Liu, K. F., Tao, Y. Q., et al. (2023). Digital finance and corporate ESG.Finance Research Letters, 51, 102476.
[4]. Zhao, T., Zhang, Z., & Liang, S. K. (2020). Digital economy, entrepreneurial vitality, and high-quality development: Empirical evidence from Chinese cities.Management World, 36(10), 65–76. https: //doi.org/10.19744/j.cnki.11-1235/f.2020.0154
[5]. Xu, W. X., Zhou, J. P., & Liu, C. J. (2022). Spatial effects of digital economy development on urban carbon emissions.Geographical Research, 41(1), 111–129.
[6]. Feng, S. L., Zhang, R., & Li, G. X. (2022). Environmental decentralization, digital finance and green technology innovation.Structural Change and Economic Dynamics, 61, 70–83.
[7]. Ma, K. L. (2023). Digital inclusive finance and corporate green technology innovation.Finance Research Letters, 55, 104818.
[8]. Razzaq, A., & Yang, X. D. (2023). Digital finance and green growth in China: Appraising inclusive digital finance using web crawler technology and big data.Technological Forecasting and Social Change, 188, 122325.
[9]. Yang, J. H., Wu, Y., & Huang, B. H. (2023). Digital finance and financial literacy: Evidence from Chinese households.Journal of Banking & Finance, 156, 106555.
[10]. Wu, F., Hu, H. Z., Lin, H. Y., et al. (2021). Corporate digital transformation and capital market performance: Empirical evidence from stock liquidity.Management World, 37(7), 130–144+10. https: //doi.org/10.19744/j.cnki.11-1235/f.2021.0097
[11]. Li, Y., & Chen, Y. Y. (2021). Development of an SBM-ML model for the measurement of green total factor productivity: The case of Pearl River Delta urban agglomeration.Renewable and Sustainable Energy Reviews, 145, 111075.
[12]. Shao, S., Fan, M. T., & Yang, L. L. (2022). Economic restructuring, green technological progress, and China's low-carbon transition: An empirical investigation based on global technology frontier and spatial spillover effects.Management World, 38(2), 46–69+4–10. https: //doi.org/10.19744/j.cnki.11-1235/f.2022.0031
[13]. Guo, B. S., Yu, H., & Jin, G. (2024). Urban green total factor productivity in China: A generalized Luenberger productivity indicator and its parametric decomposition.Sustainable Cities and Society, 106, 104198.
[14]. Zhao, X., Nakonieczny, J., Jabeen, F., et al. (2022). Does green innovation induce green total factor productivity? Novel findings from Chinese city-level data.Technological Forecasting and Social Change, 185, 122136.
[15]. Wang, P. F., Liu, H. B., & Chen, P. (2023). Corporate digitalization, environmental uncertainty, and total factor productivity.Economic Management, 45(1), 43–66. https: //doi.org/10.19616/j.cnki.bmj.2023.01.003
[16]. Ren, S. G., Zheng, J. J., Liu, D. H., et al. (2019). Has the emission trading mechanism improved corporate total factor productivity? Evidence from Chinese listed companies.China Industrial Economics, (5), 5–23. https: //doi.org/10.19581/j.cnki.ciejournal.2019.05.001
[17]. Yang, Y. W., & Zhang, P. (2021). The logic, measurement, and governance of high-quality development in China's economy.Economic Research Journal, 56(1), 26–42.
[18]. Wu, C. Q., Zhang, K. X., Zhou, X. Y., et al. (2022). Digital transformation, competitive strategy choice, and high-quality corporate development: Evidence based on machine learning and text analysis.Economic Management, 44(4), 5–22. https: //doi.org/10.19616/j.cnki.bmj.2022.04.001
[19]. Du, L. Z., Zhao, Y. H., Tao, K. T., et al. (2019). Compound effects of environmental regulation and governance transformation on green competitiveness: Empirical evidence from Chinese industry.Economic Research Journal, 54(10), 106–120.
[20]. Li, R. G. (1988). A study on growth pole theory and policy in regional economic development.Economic Research Journal, (9), 63–70.
[21]. Lin, L. (2010). Research and progress on technology diffusion theory.Economic Geography, 30(8), 1233–1239+1271. https: //doi.org/10.15957/j.cnki.jjdl.2010.08.011
[22]. Han, F., & Yang, L. G. (2020). How does the agglomeration of producer services affect the structural upgrading of manufacturing?—A comprehensive framework of agglomeration economics and Schumpeterian endogenous growth theory.Management World, 36(2), 72–94+219. https: //doi.org/10.19744/j.cnki.11-1235/f.2020.0022
[23]. Liu, Y., Xia, J. C., & Li, Y. (2017). Producer services agglomeration and manufacturing upgrading.China Industrial Economics, (7), 24–42.https: //doi.org/10.19581/j.cnki.ciejournal.2017.07.002
Cite this article
Liu,X. (2025). Analysis of the impact of digital financial development on green total factor productivity and its spatial spillover effects. Journal of Applied Economics and Policy Studies,18(5),96-115.
Data availability
The datasets used and/or analyzed during the current study will be available from the authors upon reasonable request.
Disclaimer/Publisher's Note
The statements, opinions and data contained in all publications are solely those of the individual author(s) and contributor(s) and not of EWA Publishing and/or the editor(s). EWA Publishing and/or the editor(s) disclaim responsibility for any injury to people or property resulting from any ideas, methods, instructions or products referred to in the content.
About volume
Journal:Journal of Applied Economics and Policy Studies
© 2024 by the author(s). Licensee EWA Publishing, Oxford, UK. This article is an open access article distributed under the terms and
conditions of the Creative Commons Attribution (CC BY) license. Authors who
publish this series agree to the following terms:
1. Authors retain copyright and grant the series right of first publication with the work simultaneously licensed under a Creative Commons
Attribution License that allows others to share the work with an acknowledgment of the work's authorship and initial publication in this
series.
2. Authors are able to enter into separate, additional contractual arrangements for the non-exclusive distribution of the series's published
version of the work (e.g., post it to an institutional repository or publish it in a book), with an acknowledgment of its initial
publication in this series.
3. Authors are permitted and encouraged to post their work online (e.g., in institutional repositories or on their website) prior to and
during the submission process, as it can lead to productive exchanges, as well as earlier and greater citation of published work (See
Open access policy for details).
References
[1]. Lin, Y., He, D. X., Fan, C. L., et al. (2021). Forging ahead in the new era and embarking on a new journey: A discussion on studying and implementing the spirit of the Fifth Plenary Session of the 19th CPC Central Committee (Part II).Economic Research Journal, 56(1), 4–25.
[2]. Guo, F., Wang, J. Y., Wang, F., et al. (2020). Measuring the development of digital inclusive finance in China: Index construction and spatial characteristics.China Economic Quarterly, 19(4), 1401–1418. https: //doi.org/10.13821/j.cnki.ceq.2020.03.12
[3]. Mu, W. W., Liu, K. F., Tao, Y. Q., et al. (2023). Digital finance and corporate ESG.Finance Research Letters, 51, 102476.
[4]. Zhao, T., Zhang, Z., & Liang, S. K. (2020). Digital economy, entrepreneurial vitality, and high-quality development: Empirical evidence from Chinese cities.Management World, 36(10), 65–76. https: //doi.org/10.19744/j.cnki.11-1235/f.2020.0154
[5]. Xu, W. X., Zhou, J. P., & Liu, C. J. (2022). Spatial effects of digital economy development on urban carbon emissions.Geographical Research, 41(1), 111–129.
[6]. Feng, S. L., Zhang, R., & Li, G. X. (2022). Environmental decentralization, digital finance and green technology innovation.Structural Change and Economic Dynamics, 61, 70–83.
[7]. Ma, K. L. (2023). Digital inclusive finance and corporate green technology innovation.Finance Research Letters, 55, 104818.
[8]. Razzaq, A., & Yang, X. D. (2023). Digital finance and green growth in China: Appraising inclusive digital finance using web crawler technology and big data.Technological Forecasting and Social Change, 188, 122325.
[9]. Yang, J. H., Wu, Y., & Huang, B. H. (2023). Digital finance and financial literacy: Evidence from Chinese households.Journal of Banking & Finance, 156, 106555.
[10]. Wu, F., Hu, H. Z., Lin, H. Y., et al. (2021). Corporate digital transformation and capital market performance: Empirical evidence from stock liquidity.Management World, 37(7), 130–144+10. https: //doi.org/10.19744/j.cnki.11-1235/f.2021.0097
[11]. Li, Y., & Chen, Y. Y. (2021). Development of an SBM-ML model for the measurement of green total factor productivity: The case of Pearl River Delta urban agglomeration.Renewable and Sustainable Energy Reviews, 145, 111075.
[12]. Shao, S., Fan, M. T., & Yang, L. L. (2022). Economic restructuring, green technological progress, and China's low-carbon transition: An empirical investigation based on global technology frontier and spatial spillover effects.Management World, 38(2), 46–69+4–10. https: //doi.org/10.19744/j.cnki.11-1235/f.2022.0031
[13]. Guo, B. S., Yu, H., & Jin, G. (2024). Urban green total factor productivity in China: A generalized Luenberger productivity indicator and its parametric decomposition.Sustainable Cities and Society, 106, 104198.
[14]. Zhao, X., Nakonieczny, J., Jabeen, F., et al. (2022). Does green innovation induce green total factor productivity? Novel findings from Chinese city-level data.Technological Forecasting and Social Change, 185, 122136.
[15]. Wang, P. F., Liu, H. B., & Chen, P. (2023). Corporate digitalization, environmental uncertainty, and total factor productivity.Economic Management, 45(1), 43–66. https: //doi.org/10.19616/j.cnki.bmj.2023.01.003
[16]. Ren, S. G., Zheng, J. J., Liu, D. H., et al. (2019). Has the emission trading mechanism improved corporate total factor productivity? Evidence from Chinese listed companies.China Industrial Economics, (5), 5–23. https: //doi.org/10.19581/j.cnki.ciejournal.2019.05.001
[17]. Yang, Y. W., & Zhang, P. (2021). The logic, measurement, and governance of high-quality development in China's economy.Economic Research Journal, 56(1), 26–42.
[18]. Wu, C. Q., Zhang, K. X., Zhou, X. Y., et al. (2022). Digital transformation, competitive strategy choice, and high-quality corporate development: Evidence based on machine learning and text analysis.Economic Management, 44(4), 5–22. https: //doi.org/10.19616/j.cnki.bmj.2022.04.001
[19]. Du, L. Z., Zhao, Y. H., Tao, K. T., et al. (2019). Compound effects of environmental regulation and governance transformation on green competitiveness: Empirical evidence from Chinese industry.Economic Research Journal, 54(10), 106–120.
[20]. Li, R. G. (1988). A study on growth pole theory and policy in regional economic development.Economic Research Journal, (9), 63–70.
[21]. Lin, L. (2010). Research and progress on technology diffusion theory.Economic Geography, 30(8), 1233–1239+1271. https: //doi.org/10.15957/j.cnki.jjdl.2010.08.011
[22]. Han, F., & Yang, L. G. (2020). How does the agglomeration of producer services affect the structural upgrading of manufacturing?—A comprehensive framework of agglomeration economics and Schumpeterian endogenous growth theory.Management World, 36(2), 72–94+219. https: //doi.org/10.19744/j.cnki.11-1235/f.2020.0022
[23]. Liu, Y., Xia, J. C., & Li, Y. (2017). Producer services agglomeration and manufacturing upgrading.China Industrial Economics, (7), 24–42.https: //doi.org/10.19581/j.cnki.ciejournal.2017.07.002