


Alzheimer's Disease (AD) Pathology, genetic and lifestyle risk factors, diagnostic methods, neuroinflammation, ApoE4 Allele
1. Introduction
Alzheimer's Disease (AD) stands as a formidable challenge in the realm of neurological disorders, representing not only the most common cause of dementia but also a significant public health concern. In ancient times, animal models were used to study Alzheimer’s Disease (AD), including vertebrates like non-human primates, dogs, mice, rats, and zebrafish, and invertebrates such as Drosophila and C. elegans. These models have helped understand AD's genetic underpinnings by expressing human AD-related genes, particularly for early-onset familial AD. However, modeling late-onset sporadic AD remains challenging due to its multifactorial nature [5,10]With the development of society, AD has become more serious. This Special Issue explores Alzheimer's Disease (AD) mechanisms, revealing genetic and lifestyle risk factors affecting disease susceptibility, such as Western diets and the ApoE4 allele's interaction. Studies include examining dietary impacts on ApoE4 mice, early neocortical Aβ-toxicity, and COVID-19's link to AD through increased ACE2 expression in the brain, suggesting heightened vulnerability in AD patients to COVID-19 with potential for severe neurological outcomes (Rostagno, 2022; 15]. As populations around the globe age, the prevalence of AD is on the rise, projecting a dramatic increase in the number of affected individuals. This trend underscores the urgency for research aimed at unraveling the mechanisms of AD, which remains a condition with no cure and limited therapeutic options to slow its progression. The most ordinary presentation of AD is of an elderly individual with insidious, progressive problems centered on episodic memory. At this stage, the patient may fulfill the criteria for amnestic mild cognitive impairment (MCI). Topographical difficulties subsequently commonly emerge, alongside problems with multi-tasking and loss of confidence [29]. By the time AD is clinically diagnosed, neuronal loss and neuropathologic lesions occur in many brain regions [20]. Numerous mediators secreted by inflammatory cells can cause neuronal degeneration [30].
As the condition progresses, cognitive difficulties become more profound and widespread to interfere with activities of daily living; at this stage, a patient can be diagnosed with AD dementia. Increasing dependence is the rule, and later in the disease, behavioral change, impaired mobility, hallucinations, and seizures may emerge. Death is, on average, 8.5 years from presentation 40 [19]. In the context of increasing global prevalence and the public health impact of Alzheimer's Disease (AD), it is acknowledged by the Alzheimer's Association that an estimated 6.2 million Americans age 65 and older were living with Alzheimer's dementia in 2021, with projections suggesting this number could grow to 13.8 million by 2060 barring significant medical advancements. Alzheimer's disease (AD) significantly impacts individuals, caregivers, and society globally, with over 25 million people affected worldwide. Genetic and lifestyle factors influence the disease, including diet and physical activity. Vascular risk factors, such as hypertension and obesity, and psychosocial factors, such as education and social engagement, play crucial roles in AD's development and progression. While current treatments focus on symptom management, research advances offer hope for more definitive treatments targeting AD's underlying pathology, emphasizing the importance of early detection and lifestyle interventions in managing and potentially mitigating the disease's impact [23]. This trend is consistent with the observations in the 2022 Alzheimer's Disease Facts and Figures report, which stresses the urgency of addressing this growing concern. Collectively, these reports underline the critical need for intensified research and development of therapeutic strategies [22]. Most countries have increased the programs of study of Alzheimer's Disease since Alzheimer’s disease risk is significantly influenced by genetics, with 60-80% heritability and over 40 genetic risk loci identified, including the strongly associated APOE alleles.
Recent advances in diagnostics, such as PET scans and plasma assays for amyloid β and phosphorylated tau, offer significant promise for clinical and research applications. Lifestyle-based prevention trials indicate cognitive benefits for those at higher dementia risk, highlighting that while lifestyle factors may not directly alter Alzheimer’s pathology, they can positively impact outcomes. Additionally, advanced-stage clinical trials explore promising pharmacological treatments targeting amyloid β, tau proteins, and inflammation [25]. Alzheimer's Disease has lots of unpredictable risks in daily life, even danger to life safety. Alzheimer's Disease is influenced by a multitude of risk factors, including age, genetic predispositions such as mutations in the APP and PSEN1/2 genes, environmental exposures, diet, traumatic brain injury, and mitochondrial dysfunction, with no single theory universally accepted to explain its pathogenesis [3,14]. While genetic factors such as the APOE ε4 allele significantly increase the risk of developing Alzheimer's Disease, a substantial proportion of AD cases might be preventable through lifestyle modifications targeting vascular and metabolic health [27].
Investigating Alzheimer's Disease is crucial not only for the potential to discover effective treatments but also for the development of preventive strategies and diagnostic tools. Identifying common and rare genetic variants contributing to Alzheimer's disease has significantly advanced our understanding of the molecular pathways involved in its pathogenesis, including inflammation, immune response, and lipid metabolism [24,26]. "Somatic mutations in neurons may contribute to the mosaicism observed in Alzheimer’s disease, highlighting the complexity of genetic contributions to the disease’s progression and pathology [4,22]. Early diagnosis and the possibility of intervening before significant brain damage could significantly enhance millions worldwide's quality of life. Dementia, primarily caused by Alzheimer's disease (AD), affects cognitive functions and daily living. Despite declining cardiovascular and stroke-related deaths, AD-related deaths increased by 89% from 2000 to 2014, with costs nearing $500 billion annually. Diagnosis relies on biomarkers and clinical criteria, while current treatments improve quality of life without halting progression. Research focuses on therapies targeting AD's pathology to slow cognitive decline [35]. The study of AD also holds the promise of shedding light on the broader spectrum of neurodegenerative disorders, offering insights into shared pathways of neuronal decline and dysfunction—only five treatments approved for Alzheimer’s primarily control symptoms, not disease progression. Promising trials like aducanumab offer hope, but effective disease-modifying therapy remains distant. Early diagnosis and targeted therapy could be key in future management strategies [8]. Understanding the pathomechanism of neuroinflammation in Alzheimer’s disease may help in the development of diagnostic methods for early diagnosis. It may contribute to the development of new therapeutic strategies for the disease. Furthermore, the cerebellum is critical in the distributed neural circuits participating in motor function and autonomic, limbic, and cognitive behaviors [21, 34]. Additionally, the recent development of next-generation sequencing tools and bioinformatics has enabled us to investigate the role of genetics in the pathogenesis of AD [18]. Furthermore, Machine learning techniques with novel biomarkers may increase sensitivity and specificity in diagnosing AD [9, 16].”
Moreover, understanding AD is essential for preparing healthcare systems to manage the increasing care needs of aging populations, emphasizing the importance of developing support structures for patients and caregivers. In essence, research into Alzheimer's Disease is a pivotal endeavor that addresses a pressing health challenge, aiming to alleviate the burden of this debilitating condition and foster a future where cognitive decline is no longer an inevitable part of aging. Past (1990s): The 1990s focused on the neuropsychological characterization of Alzheimer’s Disease (AD) and related disorders, identifying specific cognitive mechanisms affected by various neuropathological substrates. Current (2010s): The current era emphasizes biomarkers for diagnosing preclinical AD stages, highlighting imaging and cerebrospinal fluid analysis for early detection and improved diagnostic accuracy. Future directions include precision medicine approaches integrating biomarkers and neuropsychological assessments for tailored interventions, shifting from amyloid-focused treatments to addressing multiple pathologies in AD [6]. Regular physical activity, primarily aerobic and resistance exercise, has been shown to improve cognitive function, reduce the risk of developing Alzheimer’s Disease (AD), and may modulate brain mechanisms related to amyloid-beta turnover, inflammation, neurotrophin synthesis, and cerebral blood flow [12].
Characterized by the progressive degeneration of brain cells, AD erodes memory, cognitive functions, and the ability to perform everyday activities, marking a profound impact on patients, their families, and caregivers. Understanding the precise regulation of a zygote's development into a complex organism remains a pivotal question in biology. Several limitations, such as lack of structural organization and low spatial resolution, have hampered traditional embryogenesis study methods. Spatial Transcriptomics (ST) technology overcomes these barriers, offering a comprehensive view of the spatiotemporal dynamics of gene expression during embryonic development, akin to a detailed "motion picture" of the process [37]. By mapping the expression of thousands of genes across different tissue regions, spatial transcriptomics allows researchers to visualize the complex gene expression patterns in their native context, linking genomic information with precise anatomical locations. This holistic view is instrumental in understanding the intricate interplay between various cell types within a tissue, elucidating the mechanisms underlying tissue development, function, and the progression of diseases. The advent of spatial transcriptomics thus marks a significant leap forward, offering a nuanced and multidimensional perspective on biological processes at the tissue level and paving the way for advances in personalized medicine and targeted therapies. Early intervention and primary prevention are essential for addressing Alzheimer's Disease, as they offer the potential for more effective treatment outcomes by focusing on both central and peripheral pathologies. Refining animal models and adopting a biological definition of the disease will enhance our understanding and improve the translation of research findings into successful human therapies [10,17,28]. Stem cell therapies and metabolic enhancement protocols hold significant promise in treating and potentially reversing cognitive decline in Alzheimer's Disease, though translating these findings to human treatments remains challenging. Early detection through neuroimaging further enhances the potential for timely and effective interventions [1,7,32].
A state-of-the-art technique in cellular biology, multiplexed error-robust fluorescence in situ hybridization (MERFISH) provides unmatched insights into the molecular makeup and spatial organization of cells. With exceptional specificity and sensitivity, this cutting-edge imaging method allows for the simultaneous identification and measurement of thousands of RNA molecules within a single cell. Multiplexed error-robust FISH (MERFISH) enables near-genome-wide, spatially resolved RNA profiling in individual cells with high accuracy and efficiency. This method has identified RNAs in specific subcellular compartments, discerned unique transcriptional cell states across cell-cycle phases, and uncovered the spatial organization of transcriptionally distinct cells within tissues [33]. It is also used in different biology and other states.
MERFISH technology stands at the forefront of cellular biology, enabling the detection and quantification of numerous RNA molecules within individual cells with remarkable specificity and sensitivity. This method utilizes error-robust encoding schemes to accurately identify various RNA species, a feature that significantly enhances its reliability. The precision and comprehensive data MERFISH provides are vital for delving into cellular functions and understanding the molecular basis of diseases. The technology's robustness, marked by its high detection efficiency and accuracy, comes from innovations such as branched DNA (bDNA) amplification, which boosts signal detection without increasing background noise or variability in signal intensity [13]. One of the main benefits of MERFISH is its high reliability; even in an intricate and congested cell environment, the approach can reliably identify a wide variety of RNA species using error-robust encoding methods. This resilience guarantees that the data obtained with MERFISH are precise and extensive, offering a solid basis for investigating the molecular causes of illness and the complex mechanisms underlying cellular functions. The diverse cell types of an organ have a highly structured organization to enable their efficient and correct function. To fully appreciate gene functions in a given cell type, one needs to understand how much, when, and where the gene is expressed [33]. MERFISH's high detection efficiency is achieved by mitigating optical crowding issues and implementing error-robust barcoding, significantly enhancing its accuracy and reliability in identifying various RNA species [11]. Combining MERFISH with branched DNA amplification dramatically improves the brightness and detection efficiency of RNA signals, even allowing for the study of shorter RNA molecules [36]. In a recent survey, MERFISH integrated spatial transcriptomic data with single-nucleus RNA sequencing (snRNA-seq) to create detailed maps of gene expression within brain tissues [2]. Furthermore, MERFISH combined with expansion microscopy (ExM) has significantly increased the density of RNA molecules that can be accurately measured, enhancing the capability to profile high-abundance RNA libraries in a high-density cellular environment [31].
2. Methods
To examine the molecular and genetic landscape of Alzheimer's disease (AD), we conducted an extensive single-cell transcriptomic analysis. We utilized high-resolution 3D brain mapping to categorize various cell types in AD pathology, explicitly focusing on the distribution of cell classes across different brain regions and correlating these with Braak stages of neurofibrillary tangle deposition.
For the genetic component, we evaluated the distribution of Apolipoprotein E (ApoE) genotypes among individuals at varying stages of AD progression. The data encompassed post-mortem brain tissue from individuals stratified by ApoE genotype (ε2, ε3, ε4), enabling us to determine the genotype's influence on the molecular profile of AD at different Braak stages.
Our computational approach integrated spatial transcriptomics to visualize and quantify cell-type-specific gene expression patterns. Using this technique, we spatially resolved the cellular composition and inferred the functional state of the brain microenvironment in AD. We performed differential expression testing to identify genes that were significantly up-or down-regulated in specific cell types associated with AD pathology.
Additionally, we incorporated machine learning algorithms to classify cells into known classes (e.g., microglia, astrocytes, oligodendrocytes at various maturation stages) and discerned their distribution within the brain's three-dimensional structure. This analysis allowed us to observe the spatial organization of AD-related cellular changes, contributing to a better understanding of the disease's progression about the ApoE genotype and its potential impact on therapeutic strategies.
3. Data analysis
The dataset provided appears to summarize donor information and specific scientific data points related to gene expression, anatomical data, and possibly data from spatial transcriptomics or histological analysis. The "Donor ID," sex, gender, age at death, race, genes detected, number of spots, depth from pia, normalized depth from pia, continuous pseudo-progression score, layer annotation, Merscope, and cell volume, along with a unique "Cell ID" and a boolean indicating whether the data was used in the analysis, are all included.
The provided dataset appears to encompass a complex analysis involving a range of variables that could indicate neuropathological conditions, genetic markers, and cognitive statuses, possibly within a research study focused on Alzheimer's disease.
3.1. What is the result after analysis?
The results from this analysis could offer insights into the distribution of specific genes across different brain layers, how gene expression might vary with age, and potentially how different individuals' brains show variation in cellular composition or gene expression patterns at various depths from the pia mater. Including variables like "Merscope" might indicate using a specific technology or methodology to capture this spatial transcriptomic data, allowing for high-resolution gene expression mapping.
3.2. The description of the result
A detailed analysis of this data would likely involve comparing the gene expression profiles across different ages and genders and comparing the spatial distribution of genes within the brain tissue. The fact that all races other than White are unchecked suggests a limitation in the racial diversity of the dataset, which could be an essential consideration in the broader applicability of the findings. The result could potentially reveal patterns of gene expression that are specific to particular brain layers, correlate with age, or provide insight into the spatial heterogeneity of brain tissue at a microscopic level, contributing valuable information to neuroscience research, particularly in areas related to aging, brain architecture, and the molecular underpinnings of brain function and disease.
The study's dataset is a comprehensive collection of demographic and clinical information on 87 donors, likely involved in research related to neurodegenerative diseases such as Alzheimer's. It includes a variety of data points, ranging from basic demographic details to complex clinical evaluations, which are invaluable for understanding the mechanisms and progression of these diseases and exploring potential demographic correlations.
3.2.1. Demographic insights
The demographic data in the dataset includes the age, sex, race, and education levels of the donors, which are critical for demographic analyses pertinent to neurodegenerative diseases. The age distribution predominantly spans from 65 to 95 years, targeting a demographic at a higher risk for such diseases. This focus is crucial because the prevalence of neurodegenerative conditions increases significantly with age. The dataset also records the sex of the donors, which is essential since some neurodegenerative diseases might manifest or progress differently across genders. Furthermore, it provides detailed information on racial and educational backgrounds. It enables researchers to investigate potential disparities in disease incidence or progression across different racial groups and to examine the hypothesis that higher educational levels might confer a protective effect against the cognitive decline associated with these diseases.
3.2.2. Clinical and pathological features
Rich in clinical and pathological details, the dataset includes critical markers like the Braak stage, which measures the extent of neurofibrillary tangles, and the CERAD score, which quantifies neuritic plaques. Both are significant in diagnosing and assessing the severity of Alzheimer's disease. The data shows a range of pathology from early to advanced stages, offering a spectrum for analysis that can correlate clinical symptoms with neuropathological findings. Additionally, the dataset includes scores for cerebral amyloid angiopathy (CAA), micro infarcts, and the presence of Lewy bodies, highlighting the complexity of pathologies that might coexist in an aging brain. These features are essential for understanding the multifaceted nature of dementia, where Alzheimer's pathology might overlap with vascular or other neurodegenerative pathologies.
3.2.3. Genetic and vascular factors
Including genetic data, specifically the APOE genotype, significantly enhances the dataset's utility. The APOE ε4 allele is known to be a vital risk factor for Alzheimer's disease, and its presence in the dataset allows for the exploration of genetic predispositions within the cohort. Researchers can analyze how APOE status correlates with other clinical and pathological measures, potentially shedding light on the genetic contributions to disease severity and progression. The dataset also records vascular health indicators such as atherosclerosis and arteriolosclerosis. These conditions are crucial as they can exacerbate or influence the progression of neurodegenerative diseases, underscoring the need to consider vascular health in conjunction with neuropathological assessments.
3.2.4. Implications for research and policy
This dataset provides a robust basis for scientific inquiry into the pathophysiology of neurodegenerative diseases and epidemiological studies on demographic factors influencing these diseases. Researchers can use this data to deepen their understanding of the interactions between genetic markers, clinical pathology, and demographic characteristics. Such insights are vital for developing targeted therapies and interventions tailored to specific mechanisms or demographic profiles. Additionally, the detailed data on educational levels alongside clinical pathology can help inform policymakers about potential educational interventions or public health strategies to mitigate risk factors associated with dementia. The representation of different races, though primarily White, can also encourage further studies aimed at understanding and addressing racial disparities in health outcomes.
In conclusion, this dataset's comprehensive nature makes it an exemplary resource for advancing research in neurodegenerative diseases. Integrating demographic, clinical, genetic, and pathological data provides a thorough framework for exploring the complex interactions underlying conditions like Alzheimer's, paving the way for significant breakthroughs in understanding and managing these challenging diseases.
4. Results
This figure illustrates distributions and relationships between neurological markers such as tTau (total Tau), pTau (phosphorylated Tau), ABeta40, ABeta42, and age at death within grey matter. Tau proteins stabilize microtubules in neurons, and their abnormal accumulation is linked to neurodegenerative diseases. Grey matter contains most of the brain's neuronal cell bodies and is crucial for processing information. Figure 1A shows the age at death distribution, peaking around 85-90 years. The distribution of Guhcl tTau in grey matter peaks around 100 pg/ug, while Guhcl pTau distribution also peaks at a similar range. Figure 1B highlights the distribution of Guhcl tTau and ABeta40, showing most values at lower concentrations. Figures 1C and 1D present distributions for Guhcl abeta40 and Guhcl abeta42, peaking at lower values, indicating that these markers are less prevalent in higher concentrations. Finally, Figure 1E reinforces the distribution of Guhcl tTau in grey matter.
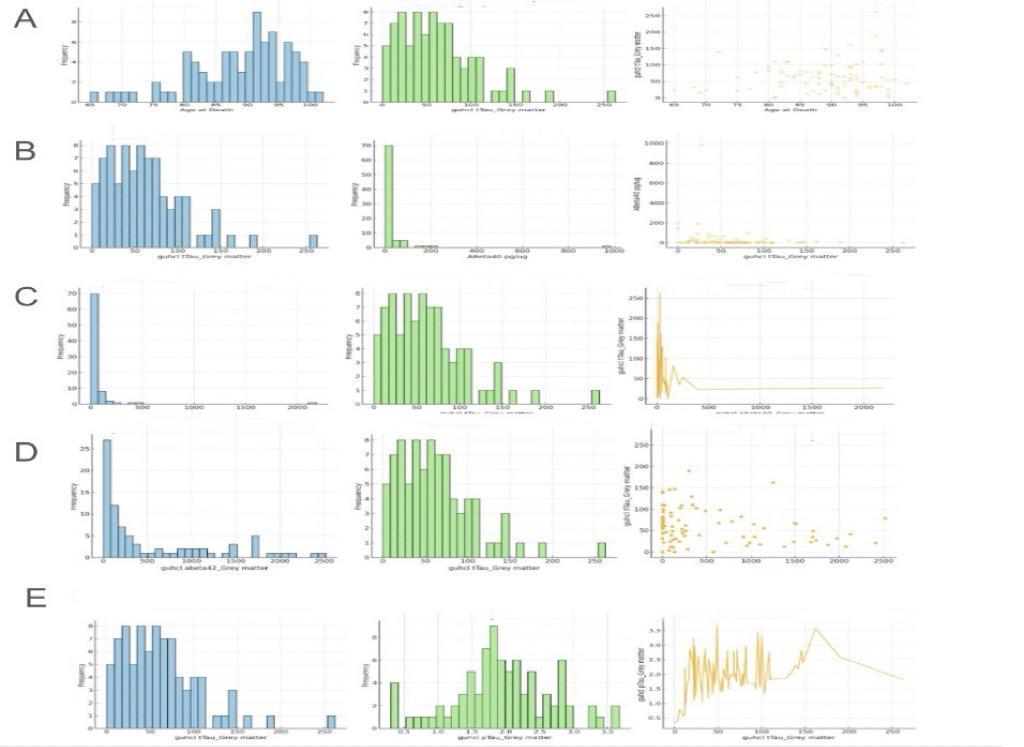
Figure 1. Relationship between Guhcl tTau in grey matter and Guhcl pTau in grey matter, Guhcl Abeta40 in grey matter, Guhcl Abeta42 in grey matter, ABeta40 concentration (pg/ug), and age at death
Analyzing the relationships, we can see in Figure 1A that there is a scatter plot between age at death and Guhcl tTau levels, indicating a weak positive trend, suggesting that tTau levels might increase slightly with age but with considerable variability. Figure 1B, examining Guhcl tTau and ABeta40, suggests a lack of clear correlation as the scatter plot shows a broad spread with no distinct trend. In Figure 1C, the relationship between Guhcl abeta40 and Guhcl tTau is analyzed, showing a slight negative correlation, which might suggest that higher abeta40 levels correspond to lower tTau levels. Similarly, Figure 1D's analysis between Guhcl abeta42 and Guhcl tTau indicates a weak positive correlation, suggesting some degree of interaction between these markers. These analyses collectively underscore the complex dynamics between these neurological markers within grey matter, highlighting the importance of understanding their interactions for insights into neurodegenerative disease mechanisms.
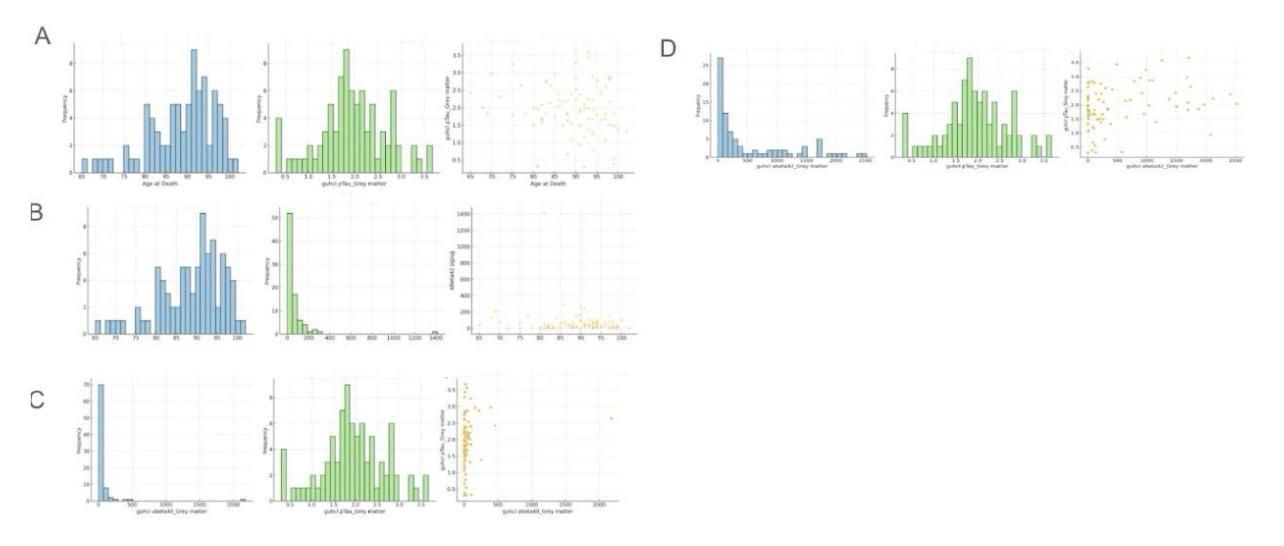
Figure 2. Relationship between Guhcl pTau in grey matter and age at death, ABeta42 concentration (pg/ug), Guhcl Abeta40 in grey matter, and Guhcl Abeta42 in grey matter
This figure, labeled Figure 2, displays various distributions and relationships between key neurological markers such as pTau (phosphorylated Tau), ABeta42, and ABeta40 within grey matter, along with age at death. Tau proteins, including pTau, are crucial for stabilizing neuronal microtubules, and their hyperphosphorylation is linked to neurodegenerative diseases like Alzheimer's. ABeta42 and ABeta40 are amyloid-beta peptides associated with plaque formation in Alzheimer's disease. Grey matter contains most of the brain's neuronal cell bodies and is vital for cognitive function. Figure 2A shows the age at death distribution, peaking around 85-90 years. The distribution of Guhcl pTau in grey matter peaks around 1.0 to 1.5 pg/ug. Figure 2B highlights the distribution of ABeta42, showing that most values are concentrated at lower levels. Figure 2C presents the distribution of Guhcl abeta40 and pTau, with abeta40 values peaking at lower concentrations and pTau showing a broader distribution. Finally, Figure 2D displays the distribution of Guhcl abeta42, with a peak at lower values, indicating less prevalence of higher concentrations.
Analyzing the relationships between these markers, Figure 2A includes a scatter plot between age at death and Guhcl pTau levels, indicating a broad spread with no clear correlation, suggesting that pTau levels do not significantly change with age. Figure 2B examines the relationship between age at death and ABeta42, with the scatter plot also showing a broad spread, indicating no significant correlation. Figure 2C explores the relationship between Guhcl abeta40 and pTau, where the scatter plot suggests a slight negative correlation, indicating that higher abeta40 levels might correspond to lower pTau levels. Finally, Figure 2D analyzes the relationship between Guhcl abeta42 and pTau, showing a weak positive correlation, suggesting some interaction between these markers. These analyses highlight the complex and varied interactions between these neurological markers within grey matter, emphasizing the need for further research to understand their roles in neurodegenerative disease mechanisms.
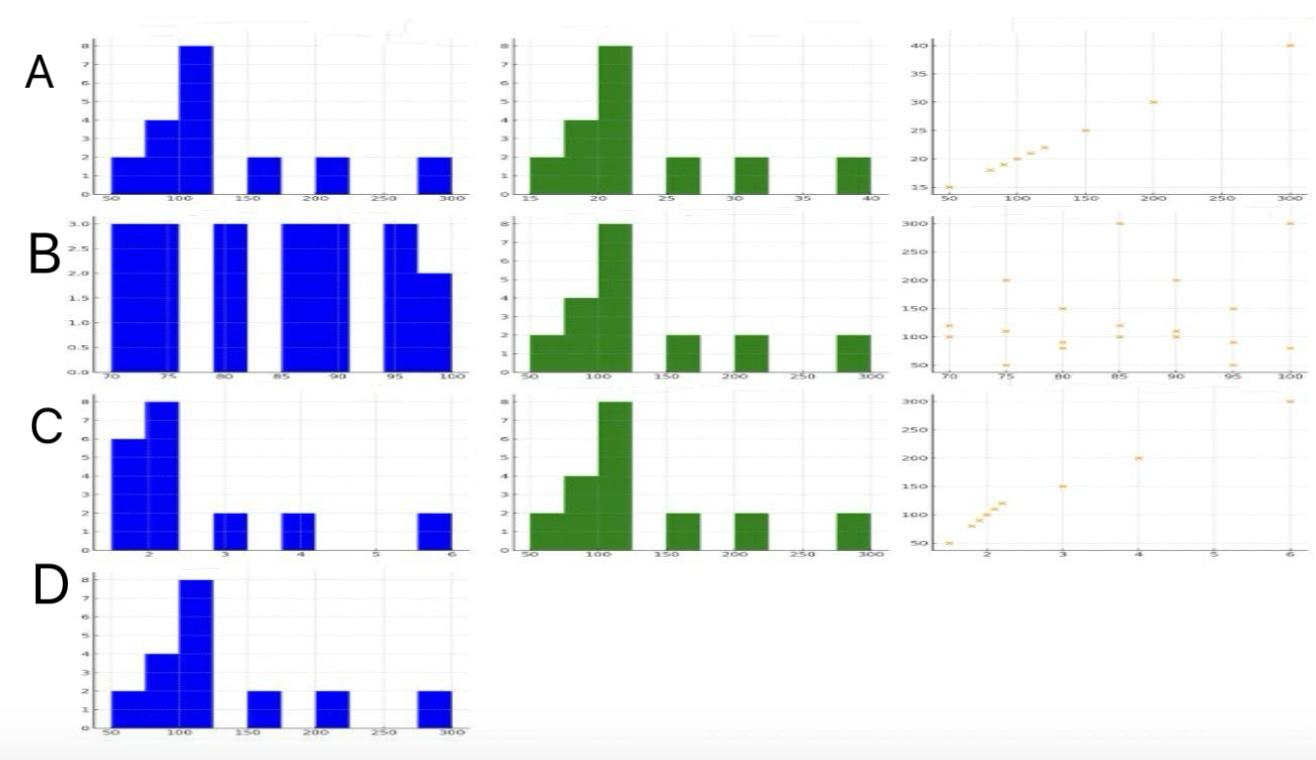
Figure 3. Relationship between ABeta40 concentration (pg/ug) and ABeta42 concentration (pg/ug), age at death, pTau concentration (pg/ug), and tTau concentration (pg/ug)
This figure, labeled Figure 3, provides various distributions and relationships between ABeta40, ABeta42, pTau, tTau, and age at death within grey matter. ABeta40 and ABeta42 are amyloid-beta peptides associated with Alzheimer's disease, while pTau (phosphorylated Tau) and tTau (total Tau) are proteins that play key roles in neuronal stability and are linked to neurodegenerative conditions. Grey matter contains neuronal cell bodies essential for processing information in the brain. Figure 3A shows the distributions of ABeta40 and ABeta42, with both histograms indicating that most subjects have low levels of these proteins. The scatter plot between ABeta40 and ABeta42 shows a wide spread, suggesting no clear correlation. Figure 3B presents the age at death distribution, peaking around 85-90 years, and the distribution of ABeta40, showing a concentration at lower values. Figure 3C displays the distribution of pTau and ABeta40, with pTau showing a broader distribution. Lastly, Figure 3D shows the distribution of ABeta40, emphasizing its prevalence at lower levels.
Analyzing the relationships, Figure 3A includes a scatter plot between ABeta40 and ABeta42, showing a broad spread with no distinct trend, indicating no significant correlation between these two markers. Figure 3B examines the relationship between age at death and ABeta40, where the scatter plot shows a broad spread, suggesting that ABeta40 levels do not significantly vary with age at death. In Figure 3C, the relationship between pTau and ABeta40 is analyzed, showing a slight negative correlation, implying that higher ABeta40 levels might be associated with lower pTau levels. Figure 3D explores the relationship between tTau and ABeta40, showing a weak positive correlation as the scatter plot suggests a slight upward trend, indicating some degree of interaction between these markers. These analyses highlight the complex and varied interactions between these neurological markers within grey matter, underscoring the importance of understanding their dynamics for insights into neurodegenerative disease mechanisms.
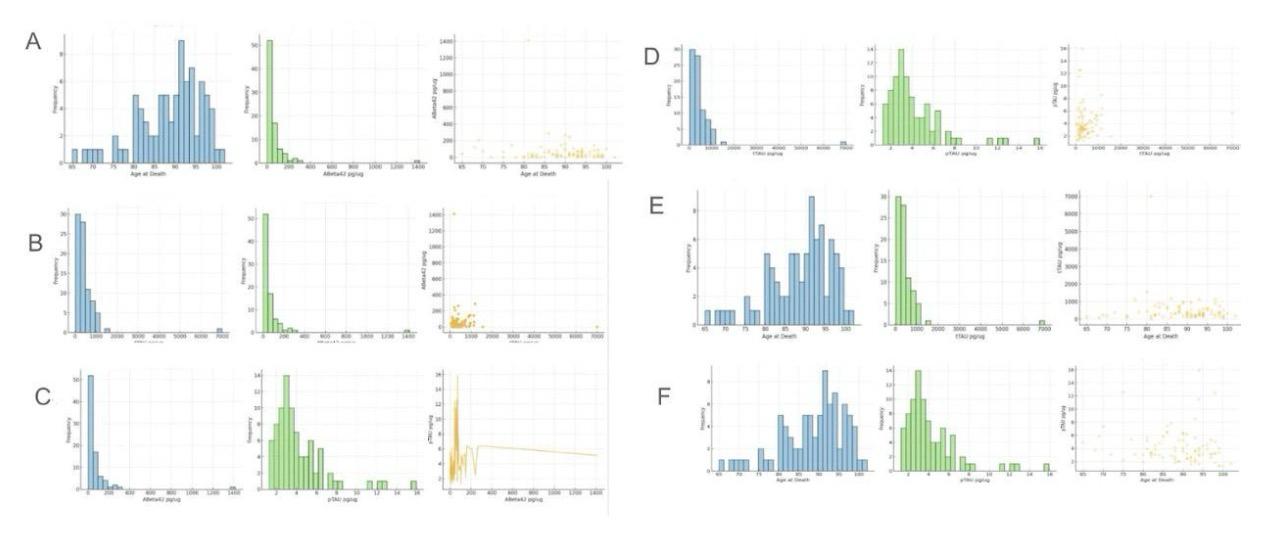
Figure 4. Relationship between ABeta42 concentration (pg/ug) and age at death, tTau concentration (pg/ug), pTau concentration (pg/ug); Relationship between tTau concentration (pg/ug) and pTau concentration (pg/ug) with age at death
This figure, labeled Figure 4, illustrates the distribution and relationships between ABeta42, tTau, pTau, and age at death within grey matter. ABeta42 is an amyloid-beta peptide associated with Alzheimer's disease plaques. At the same time, tTau (total Tau) and pTau (phosphorylated Tau) are proteins involved in stabilizing microtubules in neurons, with abnormal levels linked to neurodegenerative conditions. Grey matter, containing most of the brain's neuronal cell bodies, is crucial for processing information. Figure 4A shows the distribution of age at death, peaking around 85-90 years, and the distribution of ABeta42, with most values concentrated at lower levels. Figure 4B displays the distribution of tTau and its relationship with ABeta42, showing a broad distribution with most values at lower levels. Figure 4C presents the distribution of pTau and its relationship with ABeta42, indicating a broader distribution of pTau levels. Figures 4D, 4E, and 4F focus on the distribution of tTau and pTau in relation to age at death, showing varied distributions with peaks at lower values.
In analyzing the relationships between these markers, Figure 4A includes a scatter plot between age at death and ABeta42 levels, showing no clear correlation as the data points are widely scattered, suggesting that ABeta42 levels do not significantly vary with age. Figure 4B examines the relationship between tTau and ABeta42, where the scatter plot indicates a weak positive correlation, suggesting a slight increase in tTau levels with higher ABeta42. In Figure 4C, the relationship between pTau and ABeta42 is analyzed, showing a slight positive correlation, indicating that higher ABeta42 levels might be associated with higher pTau levels. Figures 4D, 4E, and 4F analyze the relationships between tTau, pTau, and age at death, showing no significant correlations as the scatter plots display broad spreads. These analyses highlight the complex and varied interactions between these neurological markers within grey matter, emphasizing the need for further research to understand their roles in neurodegenerative disease mechanisms.
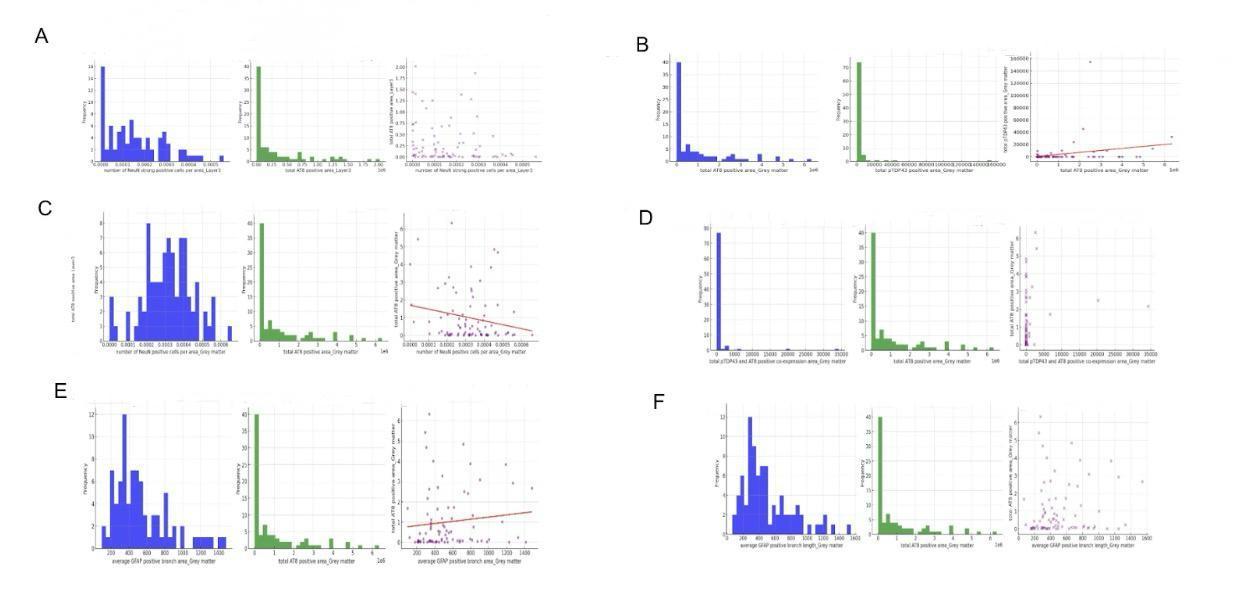
Figure 5. Relationship between AT8 expression and neuronal number (NeuN strong positive cells), GFAP number, GFAP branch length, cognitive function, and age at death
This figure, labeled Figure 5, explores the relationships between AT8 expression, neuronal number (NeuN strong positive cells), GFAP (Glial Fibrillary Acidic Protein) number, GFAP branch length, cognitive function, and age at death within various layers of grey matter. AT8 is a marker for phosphorylated Tau, linked to neurodegenerative diseases. NeuN is a marker for neurons, and GFAP is an indicator of astrocytes, involved in supporting neuronal function. Grey matter, containing neuronal cell bodies, is essential for cognitive processing. Figure 5A shows the distribution of NeuN strong positive cells in Layer 3, indicating a peak at lower values. The scatter plot between NeuN positive cells and total AT8 positive area shows a wide spread, indicating no clear correlation. Figure 5B focuses on the distribution of total AT8 and pTDP43 positive areas in grey matter, indicating a peak at lower values and suggesting a weak correlation between these markers. Figure 5C shows the distribution of NeuN positive cells and their relationship with AT8 positive area in grey matter, indicating a broad distribution. Figures 5D, 5E, and 5F examine GFAP metrics, showing peaks at lower values and varied distributions.
In analyzing the relationships, Figure 5A's scatter plot between NeuN positive cells and AT8 positive area in Layer 3 indicates no significant correlation, suggesting that the number of neurons does not directly relate to AT8 levels. Figure 5B examines the relationship between total AT8 and pTDP43 positive areas, showing a weak positive correlation, suggesting some interaction between these markers. Figure 5C analyzes NeuN positive cells and AT8 positive area in grey matter, showing a slight negative correlation, indicating that higher AT8 levels might correspond to fewer neurons. Figures 5D, 5E, and 5F focus on GFAP metrics and their relationship with AT8 positive area, showing positive correlations in the scatter plots, suggesting that increased astrocytic activity, as indicated by GFAP measures, is associated with higher AT8 levels. These analyses underscore the complex interactions between neuronal and glial markers and their potential roles in neurodegenerative processes, highlighting the importance of understanding these dynamics for insights into cognitive function and disease mechanisms.
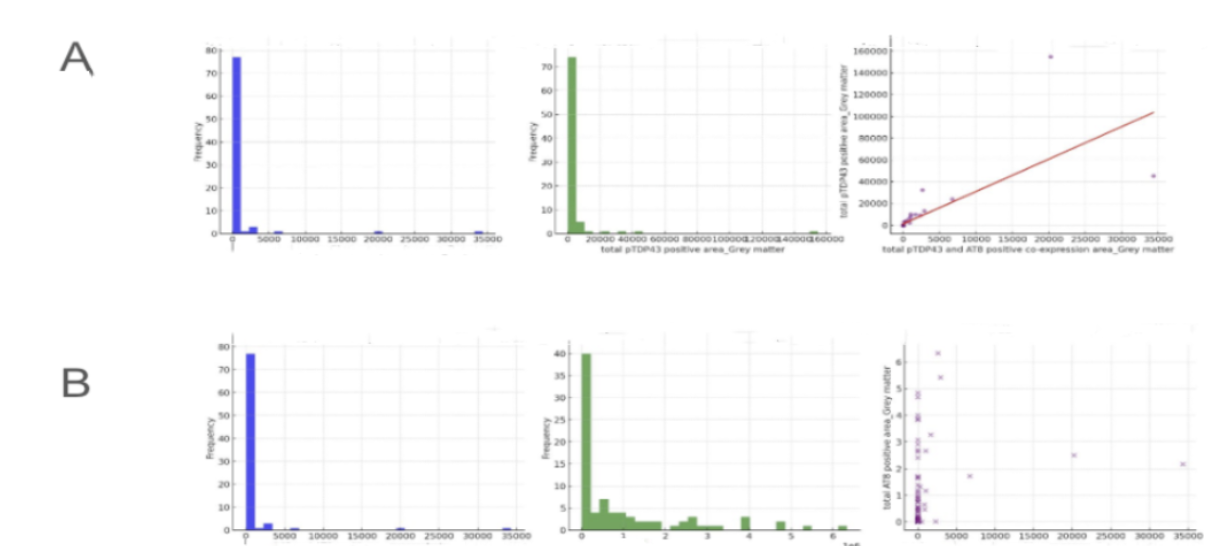
Figure 6. Relationship between total pTDP43 and AT8 positive co-expression area in grey matter and total pTDP43 positive area in grey matter
This figure, labeled Figure 6, explores the distribution and relationships between total pTDP43 and AT8 positive co-expression areas in grey matter. pTDP43 is a pathological form of the TAR DNA-binding protein 43, associated with neurodegenerative diseases like frontotemporal dementia and amyotrophic lateral sclerosis. AT8 is a marker for phosphorylated Tau, linked to Alzheimer's disease and other tauopathies. Grey matter, containing most of the brain's neuronal cell bodies, is essential for cognitive processing. Figure 6A shows the distribution of total pTDP43 and AT8 positive co-expression areas in grey matter, peaking at lower values, indicating that most samples have low levels of these markers. The scatter plot shows a positive correlation between total pTDP43 and AT8 positive co-expression areas and the total pTDP43 positive area, suggesting a relationship between these markers. Figure 6B presents similar distributions and relationships, reinforcing the patterns observed in Figure 6A.
In analyzing the relationships, Figure 6A's scatter plot between total pTDP43 and AT8 positive co-expression areas and the total pTDP43 positive area shows a clear positive correlation, suggesting that higher levels of pTDP43 are associated with higher co-expression of AT8. This relationship indicates a potential interaction between these pathological markers within grey matter, which could be significant in understanding the mechanisms of neurodegenerative diseases. Figure 6B examines the relationship between total pTDP43 and AT8 positive co-expression areas and the total AT8 positive area, showing a weak positive correlation. This weaker correlation suggests that while there is some degree of interaction, other factors may also play a role in influencing AT8 expression levels. These analyses highlight the importance of studying the interactions between pTDP43 and AT8 to gain insights into the pathological processes underlying neurodegenerative conditions, providing valuable information for potential therapeutic targets.
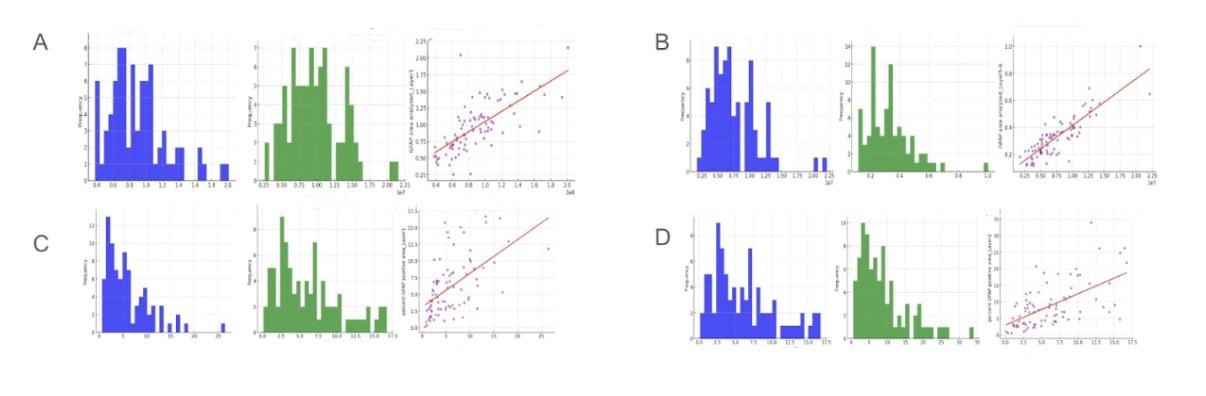
Figure 7. Relationship between GFAP area analyzed and percent GFAP positive area across different layers of grey matter
This figure, labeled Figure 7, examines the relationship between GFAP (Glial Fibrillary Acidic Protein) area analyzed and percent GFAP positive area across different layers of grey matter. GFAP is a marker for astrocytes, which are glial cells that support neuronal function and maintain the blood-brain barrier. Analyzing GFAP is crucial for understanding astrocytic responses in neurodegenerative diseases. Figure 7A shows the distribution of GFAP area analyzed in grey matter and Layer 1, with peaks at lower values indicating a higher frequency of smaller GFAP areas. The scatter plot between GFAP area analyzed in grey matter and Layer 1 shows a positive correlation, indicating that larger GFAP areas in grey matter are associated with larger areas in Layer 1. Figure 7B displays the distribution of GFAP area analyzed in Layer 4 and Layers 5-6, also peaking at lower values, and the scatter plot suggests a strong positive correlation between these layers.
In analyzing the relationships, Figure 7A's scatter plot between GFAP area analyzed in grey matter and Layer 1 shows a positive correlation, suggesting that GFAP expression is consistent across these regions. This relationship indicates that astrocytic activity, as measured by GFAP, is similar in both grey matter and Layer 1. Figure 7B further supports this with a strong positive correlation between GFAP areas in Layer 4 and Layers 5-6, suggesting uniform astrocytic distribution across these layers. Figure 7C examines the percent GFAP positive area in grey matter and Layer 1, showing a positive correlation, indicating that higher percentages of GFAP positive area in grey matter are associated with higher percentages in Layer 1. Figure 7D explores the percent GFAP positive area in Layer 2 and its relationship with Layer 1, also showing a positive correlation, reinforcing the consistency of astrocytic activity across these layers. These analyses highlight the uniformity of GFAP expression across different layers of grey matter, suggesting that astrocytic responses are evenly distributed. This is significant for understanding glial cell involvement in neurodegenerative processes.
5. Discussion
The results of this investigation highlight the complex characteristics of Alzheimer's disease (AD) and the various factors that contribute to its advancement. The significance of genetic screening in identifying persons at increased risk for AD is underscored by the substantial genetic association, namely the function of the ApoE4 allele. Furthermore, it has been demonstrated that lifestyle elements like nutrition and exercise significantly influence the development and susceptibility of illness. Dietary treatments and lifestyle adjustments are essential as potential preventative strategies due to the adverse effects of a Western diet and the genetic vulnerability caused by the ApoE4 allele.
References
[1]. Abdi, S., Javanmehr, N., Ghasemi-Kasman, M., Bali, H. Y., & Pirzadeh, M. (2022). Stem cell-based therapeutic and diagnostic approaches in Alzheimer’s disease. Current Neuropharmacology, 20(6), 1093–1115. https://doi.org/10.2174/1570159X20666211231090659
[2]. Allen, W. E., Blosser, T. R., Sullivan, Z. A., Dulac, C., & Zhuang, X. (2023). Molecular and spatial signatures of mouse brain aging at single-cell resolution. Cell, 186(1), 194-208.e18. https://doi.org/10.1016/j.cell.2022.12.010
[3]. Armstrong, R. A. (2019). Risk factors for Alzheimer’s disease. Folia Neuropathologica, 57(2), 87–105. https://doi.org/10.5114/fn.2019.85929
[4]. Bai, B., Vanderwall, D., Li, Y., Wang, X., Poudel, S., Wang, H., Dey, K. K., Chen, P.-C., Yang, K., & Peng, J. (2021). Proteomic landscape of Alzheimer’s disease: Novel insights into pathogenesis and biomarker discovery. Molecular Neurodegeneration, 16(1), 55. https://doi.org/10.1186/s13024-021-00474-z
[5]. Beata, B.-K., Wojciech, J., Johannes, K., Piotr, L., & Barbara, M. (2023). Alzheimer’s disease—Biochemical and psychological background for diagnosis and treatment. International Journal of Molecular Sciences, 24(2), 1059. https://doi.org/10.3390/ijms24021059
[6]. Bondi, M. W., Edmonds, E. C., & Salmon, D. P. (2017). Alzheimer’s disease: Past, present, and future. Journal of the International Neuropsychological Society, 23(9–10), 818–831. https://doi.org/10.1017/S135561771700100X
[7]. Bredesen, D. E., Amos, E. C., Canick, J., Ackerley, M., Raji, C., Fiala, M., & Ahdidan, J. (2016). Reversal of cognitive decline in Alzheimer’s disease. Aging, 8(6), 1250–1258. https://doi.org/10.18632/aging.100981
[8]. Briggs, R., Kennelly, S. P., & O’Neill, D. (2016). Drug treatments in Alzheimer’s disease. Clinical Medicine, 16(3), 247–253. https://doi.org/10.7861/clinmedicine.16-3-247
[9]. Chang, C.-H., Lin, C.-H., & Lane, H.-Y. (2021). Machine learning and novel biomarkers for the diagnosis of Alzheimer’s disease. International Journal of Molecular Sciences, 22(5), 2761. https://doi.org/10.3390/ijms22052761
[10]. Chen, Z.-Y., & Zhang, Y. (2022). Animal models of Alzheimer’s disease: Applications, evaluation, and perspectives. Zoological Research, 43(6), 1026–1040. https://doi.org/10.24272/j.issn.2095-8137.2022.289
[11]. Choi, J., Li, J., Ferdous, S., Liang, Q., Moffitt, J. R., & Chen, R. (2023). Spatial organization of the mouse retina at single-cell resolution by MERFISH. Nature Communications, 14(1), 4929. https://doi.org/10.1038/s41467-023-40674-3
[12]. De La Rosa, A., Olaso-Gonzalez, G., Arc-Chagnaud, C., Millan, F., Salvador-Pascual, A., García-Lucerga, C., Blasco-Lafarga, C., Garcia-Dominguez, E., Carretero, A., Correas, A. G., Viña, J., & Gomez-Cabrera, M. C. (2020). Physical exercise in the prevention and treatment of Alzheimer’s disease. Journal of Sport and Health Science, 9(5), 394–404. https://doi.org/10.1016/j.jshs.2020.01.004
[13]. Fang, R., Xia, C., Close, J. L., Zhang, M., He, J., Huang, Z., Halpern, A. R., Long, B., Miller, J. A., Lein, E. S., & Zhuang, X. (2022). Conservation and divergence of cortical cell organization in human and mouse revealed by MERFISH. Science, 377(6601), 56–62. https://doi.org/10.1126/science.abm1741
[14]. Flicker, L. (2010). Modifiable lifestyle risk factors for Alzheimer’s disease. Journal of Alzheimer’s Disease, 20(3), 803–811. https://doi.org/10.3233/JAD-2010-091624
[15]. Graff-Radford, J., Yong, K. X. X., Apostolova, L. G., Bouwman, F. H., Carrillo, M., Dickerson, B. C., Rabinovici, G. D., Schott, J. M., Jones, D. T., & Murray, M. E. (2021). New insights into atypical Alzheimer’s disease in the era of biomarkers. The Lancet Neurology, 20(3), 222–234. https://doi.org/10.1016/S1474-4422(20)30440-3
[16]. Gumus, M., Multani, N., Mack, M. L., Tartaglia, M. C., & for the Alzheimer’s Disease Neuroimaging Initiative. (2021). Progression of neuropsychiatric symptoms in young-onset versus late-onset Alzheimer’s disease. GeroScience, 43(1), 213–223. https://doi.org/10.1007/s11357-020-00304-y
[17]. Jack, C. R., Bennett, D. A., Blennow, K., Carrillo, M. C., Dunn, B., Haeberlein, S. B., Holtzman, D. M., Jagust, W., Jessen, F., Karlawish, J., Liu, E., Molinuevo, J. L., Montine, T., Phelps, C., Rankin, K. P., Rowe, C. C., Scheltens, P., Siemers, E., Snyder, H. M., … Silverberg, N. (2018). NIA‐AA research framework: Toward a biological definition of Alzheimer’s disease. Alzheimer’s & Dementia, 14(4), 535–562. https://doi.org/10.1016/j.jalz.2018.02.018
[18]. Jung, Y. J., Kim, Y. H., Bhalla, M., Lee, S. B., & Seo, J. (2018). Genomics: New light on Alzheimer’s disease research. International Journal of Molecular Sciences, 19(12), 3771. https://doi.org/10.3390/ijms19123771
[19]. Lane, C. A., Hardy, J., & Schott, J. M. (2018). Alzheimer’s disease. European Journal of Neurology, 25(1), 59–70. https://doi.org/10.1111/ene.13439
[20]. Mantzavinos, V., & Alexiou, A. (2017). Biomarkers for Alzheimer’s disease diagnosis. Current Alzheimer Research, 14(11). https://doi.org/10.2174/1567205014666170203125942
[21]. Mavroudis, I., Petridis, F., Kazis, D., Njau, S. N., Costa, V., & Baloyannis, S. J. (2019). Purkinje cells pathology in Alzheimer’s disease. American Journal of Alzheimer’s Disease & Other Dementias®, 34(7–8), 439–449. https://doi.org/10.1177/1533317519859200
[22]. Miller, M. B., Huang, A. Y., Kim, J., Zhou, Z., Kirkham, S. L., Maury, E. A., Ziegenfuss, J. S., Reed, H. C., Neil, J. E., Rento, L., Ryu, S. C., Ma, C. C., Luquette, L. J., Ames, H. M., Oakley, D. H., Frosch, M. P., Hyman, B. T., Lodato, M. A., Lee, E. A., & Walsh, C. A. (2022). Somatic genomic changes in single Alzheimer’s disease neurons. Nature, 604(7907), 714–722. https://doi.org/10.1038/s41586-022-04640-1
[23]. Qiu, C., Kivipelto, M., & von Strauss, E. (2009). Epidemiology of Alzheimer’s disease: Occurrence, determinants, and strategies toward intervention. Dialogues in Clinical Neuroscience, 11(2), 111–128. https://doi.org/10.31887/DCNS.2009.11.2/cqiu
[24]. Reitz, C. (2015). Genetic diagnosis and prognosis of Alzheimer’s disease: Challenges and opportunities. Expert Review of Molecular Diagnostics, 15(3), 339–348. https://doi.org/10.1586/14737159.2015.1002469
[25]. Scheltens, P., De Strooper, B., Kivipelto, M., Holstege, H., Chételat, G., Teunissen, C. E., Cummings, J., & van der Flier, W. M. (2021). Alzheimer’s disease. The Lancet, 397(10284), 1577–1590. https://doi.org/10.1016/S0140-6736(20)32205-4
[26]. Serrano-Pozo, A., Das, S., & Hyman, B. T. (2021). APOE and Alzheimer’s disease: Advances in genetics, pathophysiology, and therapeutic approaches. The Lancet Neurology, 20(1), 68–80. https://doi.org/10.1016/S1474-4422(20)30412-9
[27]. Serrano-Pozo, A., & Growdon, J. H. (2019). Is Alzheimer’s disease risk modifiable? Journal of Alzheimer’s Disease, 67(3), 795–819. https://doi.org/10.3233/JAD181028
[28]. Sun, B.-L., Li, W.-W., Zhu, C., Jin, W.-S., Zeng, F., Liu, Y.-H., Bu, X.-L., Zhu, J., Yao, X.-Q., & Wang, Y.-J. (2018). Clinical research on Alzheimer’s disease: Progress and perspectives. Neuroscience Bulletin, 34(6), 1111–1118. https://doi.org/10.1007/s12264-018-0249-z
[29]. The need for early detection and treatment in Alzheimer’s disease. (2016). EBioMedicine, 9, 1–2. https://doi.org/10.1016/j.ebiom.2016.07.001
[30]. Twarowski, B., & Herbet, M. (2023). Inflammatory processes in Alzheimer’s disease—Pathomechanism, diagnosis and treatment: A
[31]. Wang, G., Moffitt, J. R., & Zhuang, X. (2018). Multiplexed imaging of high-density libraries of RNAs with MERFISH and expansion microscopy. Scientific Reports, 8(1), 4847. https://doi.org/10.1038/s41598-018-22297-7
[32]. Wang, X., Huang, W., Su, L., Xing, Y., Jessen, F., Sun, Y., Shu, N., & Han, Y. (2020). Neuroimaging advances regarding subjective cognitive decline in preclinical Alzheimer’s disease. Molecular Neurodegeneration, 15(1), 55. https://doi.org/10.1186/s13024-020-00395-3
[33]. Wang, Y., Liu, B., Zhao, G., Lee, Y., Buzdin, A., Mu, X., Zhao, J., Chen, H., & Li, X. (2023). Spatial transcriptomics: Technologies, applications and experimental considerations. Genomics, 115(5), 110671. https://doi.org/10.1016/j.ygeno.2023.110671
[34]. Warren, S. L., & Moustafa, A. A. (2023). Functional magnetic resonance imaging, deep learning, and Alzheimer’s disease: A systematic review. Journal of Neuroimaging, 33(1), 5–18. https://doi.org/10.1111/jon.13063
[35]. Weller, J., & Budson, A. (2018). Current understanding of Alzheimer’s disease diagnosis and treatment. F1000Research, 7, F1000 Faculty Rev-1161. https://doi.org/10.12688/f1000research.14506.1
[36]. Xia, C., Babcock, H. P., Moffitt, J. R., & Zhuang, X. (2019). Multiplexed detection of RNA using MERFISH and branched DNA amplification. Scientific Reports, 9(1), 7721. https://doi.org/10.1038/s41598-019-43943-8
[37]. Xia, C., Fan, J., Emanuel, G., Hao, J., & Zhuang, X. (2019). Spatial transcriptome profiling by MERFISH reveals subcellular RNA compartmentalization and cell cycle-dependent gene expression. Proceedings of the National Academy of Sciences of the United States of America, 116(39), 19490–19499. https://doi.org/10.1073/pnas.1912459116
Cite this article
Bi,S. (2024). Exploration of Alzheimer’s Disease. Journal of Food Science, Nutrition and Health,3,27-37.
Data availability
The datasets used and/or analyzed during the current study will be available from the authors upon reasonable request.
Disclaimer/Publisher's Note
The statements, opinions and data contained in all publications are solely those of the individual author(s) and contributor(s) and not of EWA Publishing and/or the editor(s). EWA Publishing and/or the editor(s) disclaim responsibility for any injury to people or property resulting from any ideas, methods, instructions or products referred to in the content.
About volume
Journal:Journal of Food Science, Nutrition and Health
© 2024 by the author(s). Licensee EWA Publishing, Oxford, UK. This article is an open access article distributed under the terms and
conditions of the Creative Commons Attribution (CC BY) license. Authors who
publish this series agree to the following terms:
1. Authors retain copyright and grant the series right of first publication with the work simultaneously licensed under a Creative Commons
Attribution License that allows others to share the work with an acknowledgment of the work's authorship and initial publication in this
series.
2. Authors are able to enter into separate, additional contractual arrangements for the non-exclusive distribution of the series's published
version of the work (e.g., post it to an institutional repository or publish it in a book), with an acknowledgment of its initial
publication in this series.
3. Authors are permitted and encouraged to post their work online (e.g., in institutional repositories or on their website) prior to and
during the submission process, as it can lead to productive exchanges, as well as earlier and greater citation of published work (See
Open access policy for details).
References
[1]. Abdi, S., Javanmehr, N., Ghasemi-Kasman, M., Bali, H. Y., & Pirzadeh, M. (2022). Stem cell-based therapeutic and diagnostic approaches in Alzheimer’s disease. Current Neuropharmacology, 20(6), 1093–1115. https://doi.org/10.2174/1570159X20666211231090659
[2]. Allen, W. E., Blosser, T. R., Sullivan, Z. A., Dulac, C., & Zhuang, X. (2023). Molecular and spatial signatures of mouse brain aging at single-cell resolution. Cell, 186(1), 194-208.e18. https://doi.org/10.1016/j.cell.2022.12.010
[3]. Armstrong, R. A. (2019). Risk factors for Alzheimer’s disease. Folia Neuropathologica, 57(2), 87–105. https://doi.org/10.5114/fn.2019.85929
[4]. Bai, B., Vanderwall, D., Li, Y., Wang, X., Poudel, S., Wang, H., Dey, K. K., Chen, P.-C., Yang, K., & Peng, J. (2021). Proteomic landscape of Alzheimer’s disease: Novel insights into pathogenesis and biomarker discovery. Molecular Neurodegeneration, 16(1), 55. https://doi.org/10.1186/s13024-021-00474-z
[5]. Beata, B.-K., Wojciech, J., Johannes, K., Piotr, L., & Barbara, M. (2023). Alzheimer’s disease—Biochemical and psychological background for diagnosis and treatment. International Journal of Molecular Sciences, 24(2), 1059. https://doi.org/10.3390/ijms24021059
[6]. Bondi, M. W., Edmonds, E. C., & Salmon, D. P. (2017). Alzheimer’s disease: Past, present, and future. Journal of the International Neuropsychological Society, 23(9–10), 818–831. https://doi.org/10.1017/S135561771700100X
[7]. Bredesen, D. E., Amos, E. C., Canick, J., Ackerley, M., Raji, C., Fiala, M., & Ahdidan, J. (2016). Reversal of cognitive decline in Alzheimer’s disease. Aging, 8(6), 1250–1258. https://doi.org/10.18632/aging.100981
[8]. Briggs, R., Kennelly, S. P., & O’Neill, D. (2016). Drug treatments in Alzheimer’s disease. Clinical Medicine, 16(3), 247–253. https://doi.org/10.7861/clinmedicine.16-3-247
[9]. Chang, C.-H., Lin, C.-H., & Lane, H.-Y. (2021). Machine learning and novel biomarkers for the diagnosis of Alzheimer’s disease. International Journal of Molecular Sciences, 22(5), 2761. https://doi.org/10.3390/ijms22052761
[10]. Chen, Z.-Y., & Zhang, Y. (2022). Animal models of Alzheimer’s disease: Applications, evaluation, and perspectives. Zoological Research, 43(6), 1026–1040. https://doi.org/10.24272/j.issn.2095-8137.2022.289
[11]. Choi, J., Li, J., Ferdous, S., Liang, Q., Moffitt, J. R., & Chen, R. (2023). Spatial organization of the mouse retina at single-cell resolution by MERFISH. Nature Communications, 14(1), 4929. https://doi.org/10.1038/s41467-023-40674-3
[12]. De La Rosa, A., Olaso-Gonzalez, G., Arc-Chagnaud, C., Millan, F., Salvador-Pascual, A., García-Lucerga, C., Blasco-Lafarga, C., Garcia-Dominguez, E., Carretero, A., Correas, A. G., Viña, J., & Gomez-Cabrera, M. C. (2020). Physical exercise in the prevention and treatment of Alzheimer’s disease. Journal of Sport and Health Science, 9(5), 394–404. https://doi.org/10.1016/j.jshs.2020.01.004
[13]. Fang, R., Xia, C., Close, J. L., Zhang, M., He, J., Huang, Z., Halpern, A. R., Long, B., Miller, J. A., Lein, E. S., & Zhuang, X. (2022). Conservation and divergence of cortical cell organization in human and mouse revealed by MERFISH. Science, 377(6601), 56–62. https://doi.org/10.1126/science.abm1741
[14]. Flicker, L. (2010). Modifiable lifestyle risk factors for Alzheimer’s disease. Journal of Alzheimer’s Disease, 20(3), 803–811. https://doi.org/10.3233/JAD-2010-091624
[15]. Graff-Radford, J., Yong, K. X. X., Apostolova, L. G., Bouwman, F. H., Carrillo, M., Dickerson, B. C., Rabinovici, G. D., Schott, J. M., Jones, D. T., & Murray, M. E. (2021). New insights into atypical Alzheimer’s disease in the era of biomarkers. The Lancet Neurology, 20(3), 222–234. https://doi.org/10.1016/S1474-4422(20)30440-3
[16]. Gumus, M., Multani, N., Mack, M. L., Tartaglia, M. C., & for the Alzheimer’s Disease Neuroimaging Initiative. (2021). Progression of neuropsychiatric symptoms in young-onset versus late-onset Alzheimer’s disease. GeroScience, 43(1), 213–223. https://doi.org/10.1007/s11357-020-00304-y
[17]. Jack, C. R., Bennett, D. A., Blennow, K., Carrillo, M. C., Dunn, B., Haeberlein, S. B., Holtzman, D. M., Jagust, W., Jessen, F., Karlawish, J., Liu, E., Molinuevo, J. L., Montine, T., Phelps, C., Rankin, K. P., Rowe, C. C., Scheltens, P., Siemers, E., Snyder, H. M., … Silverberg, N. (2018). NIA‐AA research framework: Toward a biological definition of Alzheimer’s disease. Alzheimer’s & Dementia, 14(4), 535–562. https://doi.org/10.1016/j.jalz.2018.02.018
[18]. Jung, Y. J., Kim, Y. H., Bhalla, M., Lee, S. B., & Seo, J. (2018). Genomics: New light on Alzheimer’s disease research. International Journal of Molecular Sciences, 19(12), 3771. https://doi.org/10.3390/ijms19123771
[19]. Lane, C. A., Hardy, J., & Schott, J. M. (2018). Alzheimer’s disease. European Journal of Neurology, 25(1), 59–70. https://doi.org/10.1111/ene.13439
[20]. Mantzavinos, V., & Alexiou, A. (2017). Biomarkers for Alzheimer’s disease diagnosis. Current Alzheimer Research, 14(11). https://doi.org/10.2174/1567205014666170203125942
[21]. Mavroudis, I., Petridis, F., Kazis, D., Njau, S. N., Costa, V., & Baloyannis, S. J. (2019). Purkinje cells pathology in Alzheimer’s disease. American Journal of Alzheimer’s Disease & Other Dementias®, 34(7–8), 439–449. https://doi.org/10.1177/1533317519859200
[22]. Miller, M. B., Huang, A. Y., Kim, J., Zhou, Z., Kirkham, S. L., Maury, E. A., Ziegenfuss, J. S., Reed, H. C., Neil, J. E., Rento, L., Ryu, S. C., Ma, C. C., Luquette, L. J., Ames, H. M., Oakley, D. H., Frosch, M. P., Hyman, B. T., Lodato, M. A., Lee, E. A., & Walsh, C. A. (2022). Somatic genomic changes in single Alzheimer’s disease neurons. Nature, 604(7907), 714–722. https://doi.org/10.1038/s41586-022-04640-1
[23]. Qiu, C., Kivipelto, M., & von Strauss, E. (2009). Epidemiology of Alzheimer’s disease: Occurrence, determinants, and strategies toward intervention. Dialogues in Clinical Neuroscience, 11(2), 111–128. https://doi.org/10.31887/DCNS.2009.11.2/cqiu
[24]. Reitz, C. (2015). Genetic diagnosis and prognosis of Alzheimer’s disease: Challenges and opportunities. Expert Review of Molecular Diagnostics, 15(3), 339–348. https://doi.org/10.1586/14737159.2015.1002469
[25]. Scheltens, P., De Strooper, B., Kivipelto, M., Holstege, H., Chételat, G., Teunissen, C. E., Cummings, J., & van der Flier, W. M. (2021). Alzheimer’s disease. The Lancet, 397(10284), 1577–1590. https://doi.org/10.1016/S0140-6736(20)32205-4
[26]. Serrano-Pozo, A., Das, S., & Hyman, B. T. (2021). APOE and Alzheimer’s disease: Advances in genetics, pathophysiology, and therapeutic approaches. The Lancet Neurology, 20(1), 68–80. https://doi.org/10.1016/S1474-4422(20)30412-9
[27]. Serrano-Pozo, A., & Growdon, J. H. (2019). Is Alzheimer’s disease risk modifiable? Journal of Alzheimer’s Disease, 67(3), 795–819. https://doi.org/10.3233/JAD181028
[28]. Sun, B.-L., Li, W.-W., Zhu, C., Jin, W.-S., Zeng, F., Liu, Y.-H., Bu, X.-L., Zhu, J., Yao, X.-Q., & Wang, Y.-J. (2018). Clinical research on Alzheimer’s disease: Progress and perspectives. Neuroscience Bulletin, 34(6), 1111–1118. https://doi.org/10.1007/s12264-018-0249-z
[29]. The need for early detection and treatment in Alzheimer’s disease. (2016). EBioMedicine, 9, 1–2. https://doi.org/10.1016/j.ebiom.2016.07.001
[30]. Twarowski, B., & Herbet, M. (2023). Inflammatory processes in Alzheimer’s disease—Pathomechanism, diagnosis and treatment: A
[31]. Wang, G., Moffitt, J. R., & Zhuang, X. (2018). Multiplexed imaging of high-density libraries of RNAs with MERFISH and expansion microscopy. Scientific Reports, 8(1), 4847. https://doi.org/10.1038/s41598-018-22297-7
[32]. Wang, X., Huang, W., Su, L., Xing, Y., Jessen, F., Sun, Y., Shu, N., & Han, Y. (2020). Neuroimaging advances regarding subjective cognitive decline in preclinical Alzheimer’s disease. Molecular Neurodegeneration, 15(1), 55. https://doi.org/10.1186/s13024-020-00395-3
[33]. Wang, Y., Liu, B., Zhao, G., Lee, Y., Buzdin, A., Mu, X., Zhao, J., Chen, H., & Li, X. (2023). Spatial transcriptomics: Technologies, applications and experimental considerations. Genomics, 115(5), 110671. https://doi.org/10.1016/j.ygeno.2023.110671
[34]. Warren, S. L., & Moustafa, A. A. (2023). Functional magnetic resonance imaging, deep learning, and Alzheimer’s disease: A systematic review. Journal of Neuroimaging, 33(1), 5–18. https://doi.org/10.1111/jon.13063
[35]. Weller, J., & Budson, A. (2018). Current understanding of Alzheimer’s disease diagnosis and treatment. F1000Research, 7, F1000 Faculty Rev-1161. https://doi.org/10.12688/f1000research.14506.1
[36]. Xia, C., Babcock, H. P., Moffitt, J. R., & Zhuang, X. (2019). Multiplexed detection of RNA using MERFISH and branched DNA amplification. Scientific Reports, 9(1), 7721. https://doi.org/10.1038/s41598-019-43943-8
[37]. Xia, C., Fan, J., Emanuel, G., Hao, J., & Zhuang, X. (2019). Spatial transcriptome profiling by MERFISH reveals subcellular RNA compartmentalization and cell cycle-dependent gene expression. Proceedings of the National Academy of Sciences of the United States of America, 116(39), 19490–19499. https://doi.org/10.1073/pnas.1912459116