


1. Introduction
Photoplethysmography (PPG) signal measurement plays a critical role in medical applications. Pulse oximeters, one of the essential non-invasive medical devices in healthcare, employ optical methods to estimate arterial oxygen saturation (SpO2), which quantifies oxygen levels or volumetric changes in arterial blood at specific body sites [1]. A pulse oximeter sensor comprises two light-emitting diodes (LEDs) and a photodetector: one LED emits red light (660 nm wavelength), while the other emits infrared (IR) light (940 nm wavelength). The photodetector captures transmitted or reflected light (dependent on measurement site) to acquire PPG signals [2]. PPG signals consist of alternating current (AC) and direct current (DC) components, with oxygen saturation calculated from the ratio of detected light intensities. However, PPG signals acquired by pulse oximeter sensors are susceptible to motion artifacts caused by hand or body movements, leading to erroneous SpO2 values. This vulnerability arises because the AC component constitutes only 0.1% of the total signal amplitude. For accurate SpO2 estimation, it is essential to obtain artifact-free PPG signals with clear separation between DC and AC components [3].
In recent years, numerous methodologies have been developed to mitigate motion artifacts in photoplethysmography (PPG) signals [4]. These include adaptive noise cancellation (ANC), wavelet transform (WT), independent component analysis (ICA), singular value decomposition (SVD), and cycle-by-cycle Fourier series analysis (CFSA) [5-9]. Among these, CFSA has demonstrated enhanced efficacy in artifact suppression and signal reconstruction. Accurate cycle period determination in PPG signals with quasi-periodic characteristics is essential for reliable CFSA operation, as their inherent variability necessitates precise resolution of periodic patterns to isolate physiological signals from motion artifacts.
This paper proposes a novel method for determining the cycle period of photoplethysmography (PPG) signals, involving sequential processing through a high-pass filter and differential amplifier circuit followed by valley detection-based periodicity analysis in the processed signal. This approach pioneers a hybrid analog-digital co-processing framework to enhance motion artifact resilience in photoplethysmography. By integrating analog preprocessing (high-pass filtering and differential amplification) with Cyclic Fourier Series Analysis (CFSA), the methodology establishes a hardware-compatible artifact correction strategy. This co-design provides a reference architecture for SpO2 monitoring chip development.
2. CFSA method applied to PPG signals
The Cycle-by-Cycle Fourier Series Analysis (CFSA) method is a specialized analytical approach for processing quasi-periodic signals [5-6]. As is well-established in signal theory, any periodic signal can be decomposed into a set of sinusoidal components comprising a fundamental frequency and its harmonic constituents through Fourier series expansion [10]. For a continuous-time periodic signal
where
However, PPG signals exhibit quasi-periodic and non-stationary characteristics, rendering conventional Fourier series analysis directly inapplicable. This necessitates cycle-wise implementation of Fourier series to resolve the limitation. Initially, all complete PPG cycles must be identified to determine their temporal periods (i.e.
Correspondingly, Fourier series expansion is performed for each identified PPG cycle. Typically, the m-th cycle is characterized by its coefficient set
where
The accuracy of PPG signal reconstruction is dependent on the detected cycles, where errors incurred during cycle detection may lead to suboptimal performance of the proposed CFSA method. To enhance the accuracy of cycle determination, this paper introduces a hybrid signal processing approach utilizing high-pass filters and differential amplification circuits to assist in cycle identification.
3. Proposed hybrid processing circuit
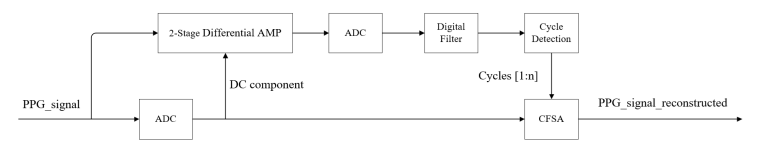
The proposed hybrid signal processing architecture, as illustrated in Fig. 1, integrates analog and digital subsystems to systematically address photoplethysmography (PPG) signal conditioning requirements. This architecture comprises five functional modules: a dual-stage differential amplification circuit for analog signal conditioning; a reconfigurable analog-to-digital converter (ADC) for signal digitization; a digital filtering unit for noise suppression; a cycle detection algorithm for temporal feature extraction; and a Cyclic Fourier Series Analysis (CFSA) module for periodic signal decomposition. In contrast to conventional CFSA implementations, this design introduces a hardware-software co-processing paradigm where the analog front-end's two-stage amplification, coupled with bandpass filtering, generates optimized AC-enhanced digital waveforms specifically tailored for cycle boundary recognition. This synergistic integration of analog amplification and digital filtering aims to improve temporal resolution in periodic waveform analysis while maintaining spectral fidelity for subsequent CFSA-based harmonic analysis.
3.1. 2-Stage differential amplifier
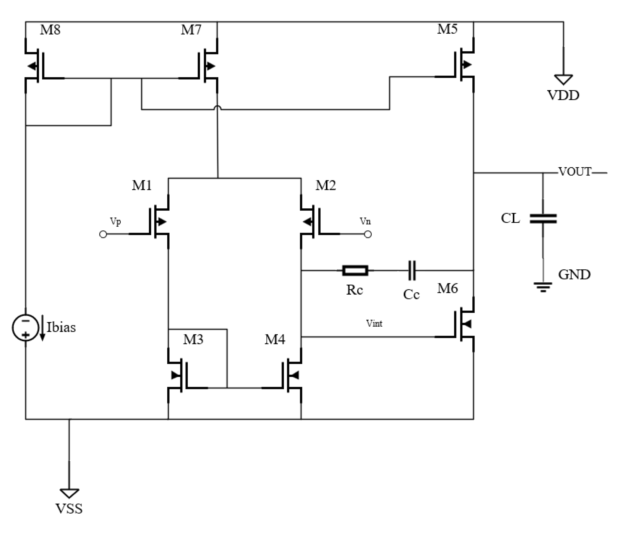
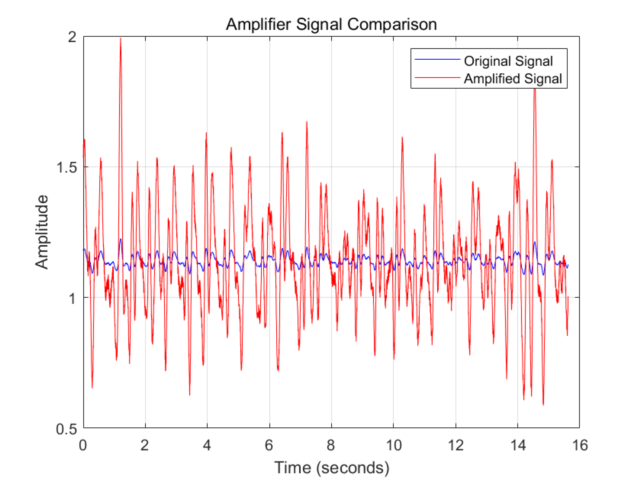
To enable reliable cycle detection through selective amplification of the photoplethysmography (PPG) signal's alternating current (AC) component while maintaining direct current (DC) baseline integrity, a dual-path signal conditioning architecture was implemented. This configuration employs a two-stage differential amplification system comprising a primary channel processing the raw PPG input and an independent DC reference channel extracting baseline information through low-frequency isolation. The differential amplifier achieves an open-loop DC gain of 106 dB, while its closed-loop configuration readily provides over several hundred times of DC gain—sufficient to meet PPG signal amplification requirements. As detailed in Fig. 2, the proposed topology establishes complementary signal pathways where the first amplification stage enhances weak AC variations and the second stage performs DC restoration through common-mode rejection. The comparative signal waveforms presented in Fig. 3 demonstrate the system's capability to preserve hemodynamic waveform morphology while eliminating baseline drift artifacts, achieving AC/DC separation through coordinated analog processing prior to subsequent digital analysis stages.
3.2. ADC and digital filter
Both the raw photoplethysmography (PPG) signal and the differential amplifier's analog output require analog-to-digital conversion (ADC) to enable digital processing for cycle identification and CFSA. A 10-bit successive approximation register (SAR) ADC operating at 400 MS/s with reconfigurable architecture was employed for this conversion, ensuring precise digitization while maintaining hardware efficiency. Following ADC, a digital filtering stage implementing a 4th-order Butterworth bandpass filter with a passband of [0.5 Hz, 4.0 Hz] was applied to suppress high-frequency artifacts and baseline fluctuations, thereby enhancing waveform smoothness and facilitating reliable cycle detection. The filtered signal was subsequently routed to the CFSA processing module, where adaptive algorithms extracted critical physiological features. This systematic approach ensures signal integrity and minimizes preprocessing errors prior to advanced spectral analysis.
3.3. Cycle detection and CFSA module
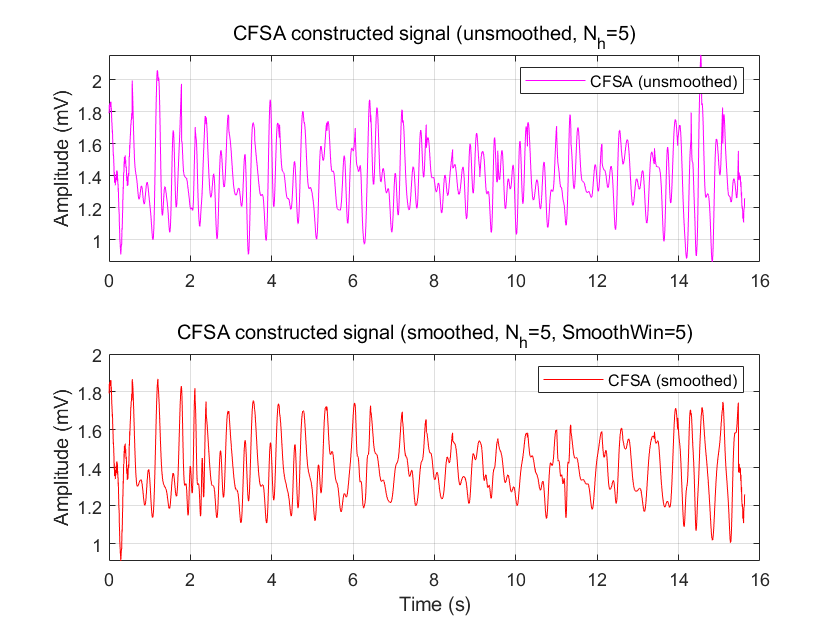
The cycle identification function was implemented using a peak detection method, which sequentially identifies peaks in the PPG signal and calculates the time intervals between consecutive peaks as the cycle duration. In practical PPG signals, adjacent peaks and pseudo-peaks may cause false peak detection, which is mitigated by the differential amplifier's AC component amplification and digital filter-based artifact reduction. For CFSA processing, in addition to signal reconstruction following Equation (6), this study employs Fourier coefficient smoothing prior to reconstruction. Comparative results between non-smoothed and smoothed Fourier coefficient-based reconstructions are presented in Fig. 4.
4. Experimental results
This study conducted co-simulation based on Matlab and Virtuoso. The original Photoplethysmography (PPG) data were sourced from Bracewell’s research, representing signals measured during human ambulation and containing motion artifacts [10]. The experimental validation utilizes PPG data acquired under walking conditions from Jarchi’s multimodal dataset, which comprehensively recorded physiological signals during diverse physical activities including walking, jogging, and cycling [11].
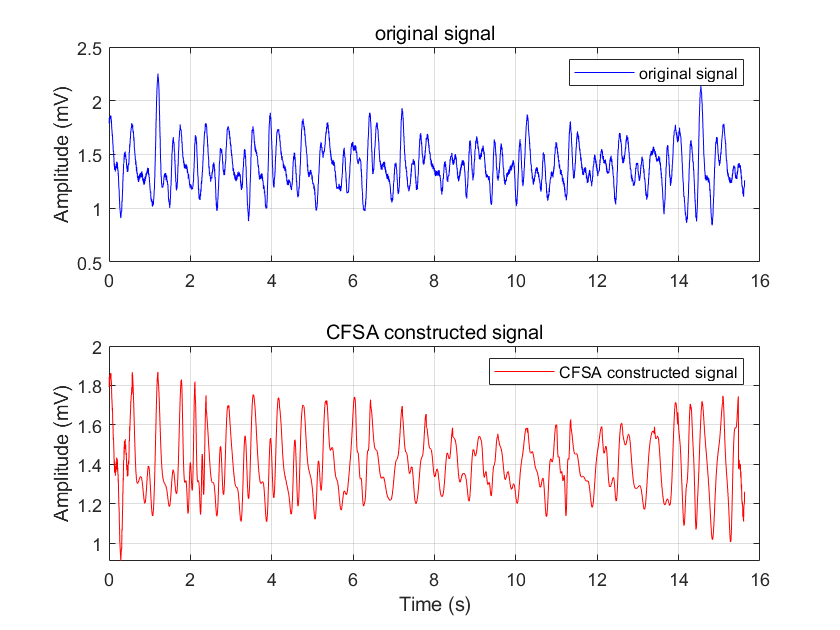
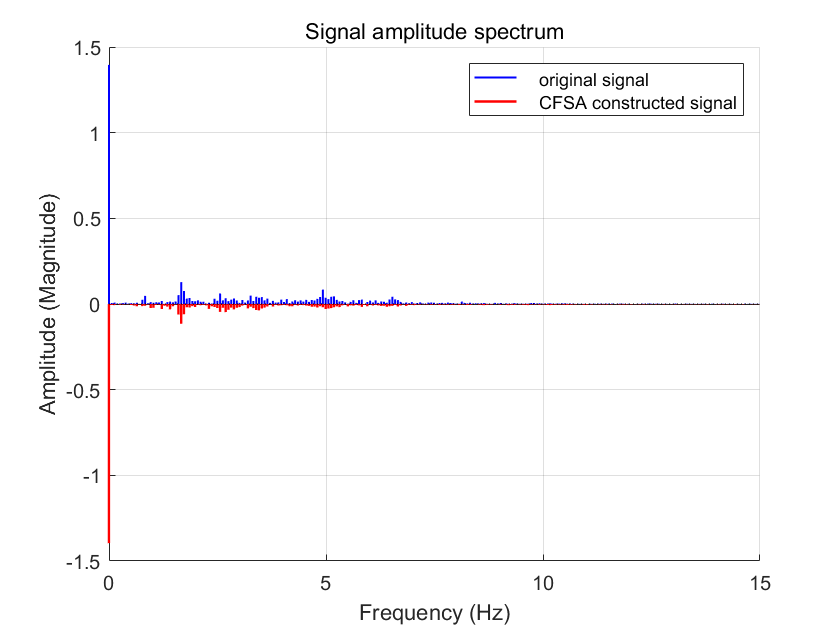
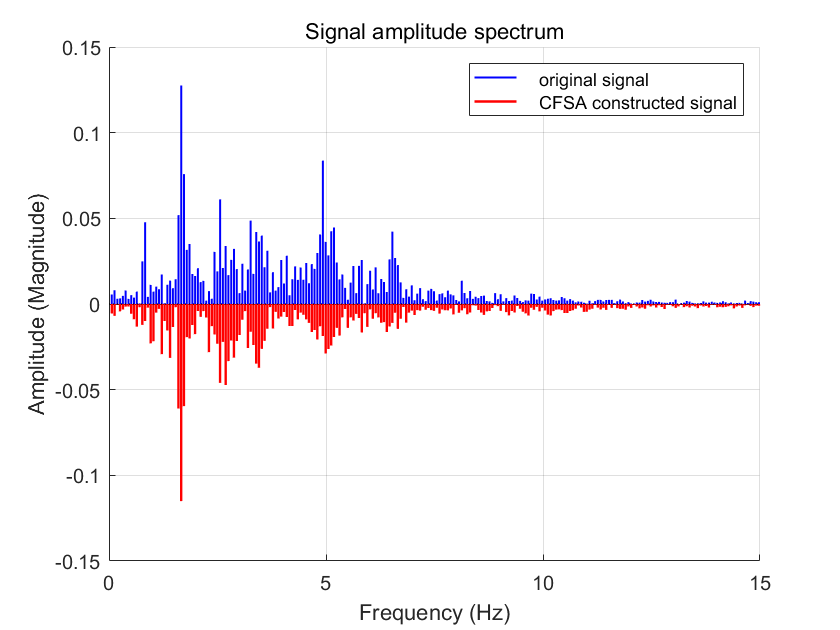
A comparison of the time-domain waveforms of the original signal and the reconstructed signal processed by CFSA is presented in Fig. 5. The corresponding spectral comparison is shown in Fig. 6. During the operational process of a pulse oximeter, it is often necessary to separate the DC and AC components for distinct processing. Therefore, a spectral comparison of the AC components of the reconstructed signal and the original signal is also illustrated in Fig. 7.
The photoplethysmography (PPG) signal band was defined as 0.5-3 Hz based on typical human pulse rate variations, with sub-band classifications comprising a low-frequency noise band (<0.5 Hz) and a high-frequency noise band (>3 Hz). Comparative spectral analysis of the AC components between original and reconstructed signals demonstrated significant performance improvements: the relative spectral power contribution within the PPG signal band increased from 53.07% to 81.49% of total AC power. Additionally, system linearity enhancement was evidenced by a rise in correlation coefficient from 1.13 to 4.39, while the signal-to-noise band ratio (SNBR_dB) showed a marked improvement from 0.53 dB to 6.43 dB, confirming effective noise suppression across both sub-bands.
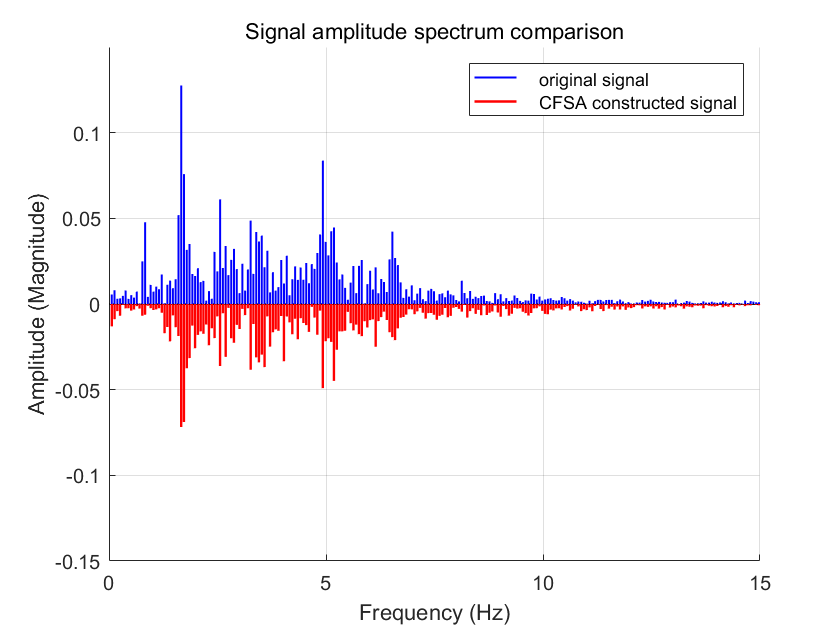
For comparative evaluation with conventional Cycle-by-Cycle Fourier Series Analysis (CFSA) methodologies, parallel simulations were conducted using a reference system architecture excluding the hybrid processing components. Figure 8 presents the comparative spectral characteristics of alternating current (AC) components between original and reconstructed signals in this baseline configuration. The analysis demonstrated moderate performance gains: the spectral power contribution within the photoplethysmography (PPG) signal band (0.5-3 Hz) increased from 53.07% to 65.54% of total AC power, linear correlation coefficients improved from 1.13 to 1.25, and the signal-to-noise band ratio (SNBR_dB) exhibited an incremental enhancement from 0.53 dB to 0.81 dB. It should be noted that the absence of synchronized accelerometer data in this study limits precise quantification of motion artifact rejection. Comprehensive characterization of artifact suppression efficacy would require correlating reconstructed signal fidelity with inertial measurements from body segments during motion. These comparative results quantitatively confirm the superior artifact suppression capability of the implemented hybrid processing architecture in reconstructing physiologically relevant signal components, particularly through enhanced motion artifact mitigation in the reconstructed PPG waveforms.
5. Conclusion
This study advances motion artifact suppression in photoplethysmography (PPG) through a novel analog-digital co-processing framework that synergizes targeted analog conditioning with Cycle-by-Cycle Fourier Series Analysis (CFSA). The implemented architecture integrates high-pass filtering and differential amplification stages to enhance feature extraction capability prior to spectral decomposition, effectively mitigating baseline drift and high-frequency interference. Experimental validation demonstrates significant performance gains: the Signal-to-Total Noise Band Ratio (SNBR_dB) increased from 0.53 dB to 5.90 dB, while waveform linearity improved from 1.13 to 4.39. This hybrid approach establishes a scalable template for low-power wearable biosensors, particularly enabling robust SpO₂ monitoring in fitness trackers and remote patient monitoring systems where motion resilience is critical. The analog preprocessing’s DC gain configurability (>100 dB) further supports interoperability with commercial optical sensor modules.
However, two inherent limitations warrant attention: First, the 0.5–3 Hz operational bandwidth excludes pathological tachyarrhythmias (>180 BPM). Second, validation was confined to walking artifacts; high-intensity activities (e.g., running) necessitate adaptive harmonic thresholding. Future implementations should integrate inertial measurement units (IMUs) for motion-context-aware reconfiguration and explore arrhythmia-tolerant cycle detection. Despite these constraints, the co-design paradigm demonstrates definitive viability for hardware-accelerated physiological signal purification in next-generation biomedical SoCs.
References
[1]. Northrop, B. R. (2019). Noninvasive instrumentation and measurement in medical diagnosis. CRC Press.
[2]. Nitzan, M., Romem, A., & Koppel, R. (2014). Pulse oximetry: Fundamentals and technology update. Medical Devices (Auckland), 7, 231-239. doi: 10.2147/MDER.S47319. PMID: 25031547; PMCID: PMC4099100.
[3]. Ram, M. R., Madhav, K. V., Krishna, E. H., Nagarjuna Reddy, K., & Reddy, K. A. (2011). On the performance of time varying step-size least mean squares (TVS-LMS) adaptive filter for motion artifact reduction from PPG signals. In 2011 International Conference on Communications and Signal Processing (pp. 431-435). Kerala, India. doi: 10.1109/ICCSP.2011.5739353.
[4]. Naraharisetti, K. V. P., & Bawa, M. (2011). Comparison of different signal processing methods for reducing artifacts from photoplethysmograph signal. In 2011 IEEE International Conference on Electro/Information Technology (pp. 1-8). Mankato, MN, USA. doi: 10.1109/EIT.2011.5978571.
[5]. Reddy, K. A., George, B., & Kumar, V. J. (2009). Use of Fourier series analysis for motion artifact reduction and data compression of photoplethysmographic signals. IEEE Transactions on Instrumentation and Measurement, 58(5), 1706-1711. doi: 10.1109/TIM.2008.2009136.
[6]. Reddy, K. A., George, B., & Kumar, V. J. (2008). Motion artifact reduction and data compression of photoplethysmographic signals utilizing cycle by cycle Fourier series analysis. In 2008 IEEE Instrumentation and Measurement Technology Conference (pp. 176-179). Victoria, BC, Canada. doi: 10.1109/IMTC.2008.4547026.
[7]. Relente, A. R., & Sison, L. G. (2002). Characterization and adaptive filtering of motion artifacts in pulse oximetry using accelerometers. In Proceedings of the Second Joint 24th Annual Conference and the Annual Fall Meeting of the Biomedical Engineering Society (pp. 1769-1770). Houston, TX, USA.doi: 10.1109/IEMBS.2002.1106644.
[8]. Lee, C. M., & Zhang, Y. T. (2003). Reduction of motion artifacts from photoplethysmographic recordings using a wavelet denoising approach. In IEEE EMBS Asian-Pacific Conference on Biomedical Engineering (pp. 194-195). Kyoto, Japan. doi: 10.1109/APBME.2003.1302650.
[9]. Kim, B. S., & Yoo, S. K. (2006). Motion artifact reduction in photoplethysmography using independent component analysis. IEEE Transactions on Biomedical Engineering, 53(3), 566-568. doi: 10.1109/TBME.2005.869784.
[10]. Bracewell, R. N. (2000). The Fourier transform and its applications. McGraw-Hill.
[11]. Jarchi, D., & Casson, A. J. (2017). Description of a database containing wrist PPG signals recorded during physical exercise with both accelerometer and gyroscope measures of motion. Data, 2, 1. https: //doi.org/10.3390/data2010001.
Cite this article
Liu,X. (2025). A Hybrid Analog-Digital Circuit Framework for Enhanced Cycle-by-Cycle Fourier Series Analysis: Motion Artifact Mitigation in Photoplethysmography Signal Acquisition. Applied and Computational Engineering,178,22-30.
Data availability
The datasets used and/or analyzed during the current study will be available from the authors upon reasonable request.
Disclaimer/Publisher's Note
The statements, opinions and data contained in all publications are solely those of the individual author(s) and contributor(s) and not of EWA Publishing and/or the editor(s). EWA Publishing and/or the editor(s) disclaim responsibility for any injury to people or property resulting from any ideas, methods, instructions or products referred to in the content.
About volume
Volume title: Proceedings of CONF-CDS 2025 Symposium: Data Visualization Methods for Evaluation
© 2024 by the author(s). Licensee EWA Publishing, Oxford, UK. This article is an open access article distributed under the terms and
conditions of the Creative Commons Attribution (CC BY) license. Authors who
publish this series agree to the following terms:
1. Authors retain copyright and grant the series right of first publication with the work simultaneously licensed under a Creative Commons
Attribution License that allows others to share the work with an acknowledgment of the work's authorship and initial publication in this
series.
2. Authors are able to enter into separate, additional contractual arrangements for the non-exclusive distribution of the series's published
version of the work (e.g., post it to an institutional repository or publish it in a book), with an acknowledgment of its initial
publication in this series.
3. Authors are permitted and encouraged to post their work online (e.g., in institutional repositories or on their website) prior to and
during the submission process, as it can lead to productive exchanges, as well as earlier and greater citation of published work (See
Open access policy for details).
References
[1]. Northrop, B. R. (2019). Noninvasive instrumentation and measurement in medical diagnosis. CRC Press.
[2]. Nitzan, M., Romem, A., & Koppel, R. (2014). Pulse oximetry: Fundamentals and technology update. Medical Devices (Auckland), 7, 231-239. doi: 10.2147/MDER.S47319. PMID: 25031547; PMCID: PMC4099100.
[3]. Ram, M. R., Madhav, K. V., Krishna, E. H., Nagarjuna Reddy, K., & Reddy, K. A. (2011). On the performance of time varying step-size least mean squares (TVS-LMS) adaptive filter for motion artifact reduction from PPG signals. In 2011 International Conference on Communications and Signal Processing (pp. 431-435). Kerala, India. doi: 10.1109/ICCSP.2011.5739353.
[4]. Naraharisetti, K. V. P., & Bawa, M. (2011). Comparison of different signal processing methods for reducing artifacts from photoplethysmograph signal. In 2011 IEEE International Conference on Electro/Information Technology (pp. 1-8). Mankato, MN, USA. doi: 10.1109/EIT.2011.5978571.
[5]. Reddy, K. A., George, B., & Kumar, V. J. (2009). Use of Fourier series analysis for motion artifact reduction and data compression of photoplethysmographic signals. IEEE Transactions on Instrumentation and Measurement, 58(5), 1706-1711. doi: 10.1109/TIM.2008.2009136.
[6]. Reddy, K. A., George, B., & Kumar, V. J. (2008). Motion artifact reduction and data compression of photoplethysmographic signals utilizing cycle by cycle Fourier series analysis. In 2008 IEEE Instrumentation and Measurement Technology Conference (pp. 176-179). Victoria, BC, Canada. doi: 10.1109/IMTC.2008.4547026.
[7]. Relente, A. R., & Sison, L. G. (2002). Characterization and adaptive filtering of motion artifacts in pulse oximetry using accelerometers. In Proceedings of the Second Joint 24th Annual Conference and the Annual Fall Meeting of the Biomedical Engineering Society (pp. 1769-1770). Houston, TX, USA.doi: 10.1109/IEMBS.2002.1106644.
[8]. Lee, C. M., & Zhang, Y. T. (2003). Reduction of motion artifacts from photoplethysmographic recordings using a wavelet denoising approach. In IEEE EMBS Asian-Pacific Conference on Biomedical Engineering (pp. 194-195). Kyoto, Japan. doi: 10.1109/APBME.2003.1302650.
[9]. Kim, B. S., & Yoo, S. K. (2006). Motion artifact reduction in photoplethysmography using independent component analysis. IEEE Transactions on Biomedical Engineering, 53(3), 566-568. doi: 10.1109/TBME.2005.869784.
[10]. Bracewell, R. N. (2000). The Fourier transform and its applications. McGraw-Hill.
[11]. Jarchi, D., & Casson, A. J. (2017). Description of a database containing wrist PPG signals recorded during physical exercise with both accelerometer and gyroscope measures of motion. Data, 2, 1. https: //doi.org/10.3390/data2010001.