


1. Introduction
China's 14th Five-Year Plan for Transportation (2021-2025) mandates an 18% reduction in carbon intensity for infrastructure projects, while the State Administration of Affairs [1] emphasizes a "design-bid-settlement" full-cycle cost control system. However, the industry faces three systemic challenges. The first issue is the continuous cost overrun. Equipment and logistics account for 42% of the budget deviation [2], and traditional management leads to 35% of the equipment being idle [3]. Secondly, in the static cost model, linear depreciation fails to capture the fluctuation of residual value-the actual five-year residual value of a 200-ton crawler crane (12-28%) is quite different from the fixed 20% in the traditional model . Finally, there is a gap in sustainability. Although logistics accounts for 8% of global emissions, only 12% of scheduling algorithms include carbon pricing (China ETS [4], 2025:65 USD/ton CO [3]).
However, the traditional method has three main disadvantages. The first disadvantage is the decentralized decision-making. The purchasing team selects equipment based on the upfront cost, while the operation team independently manages the scheduling, which results in a 15 - 20% resource mismatch. Then there are the shortcomings of the static cost model, and the linear depreciation assumption underestimates the fluctuation of residual value. For example, the actual five-year residual value of a 200-ton crawler crane fluctuates between 12% and 28%, depending on market conditions, but the traditional model fixes it at 20%. Finally, there is the blind spot of sustainability. Although the carbon price in China's carbon emissions trading system will reach $65 per ton in 2025, only 12% of the scheduling algorithms will take carbon tax into account.
This study addresses China’s smart construction and "New Infrastructure" priorities by pursuing three objectives.Here this article used a model development.
Develop a machine learning-driven lifecycle cost model for construction equipment, using LSTM networks to achieve ±5% residual value prediction accuracy (validated against Volvo CE’s 2025 dataset). This advances Brilakis [5]framework by overcoming linear depreciation limitations (±22% errors).
At the same time, there is an algorithm to be designed. Create a carbon - constrained dynamic scheduling algorithm integrated with China ETS (Emissions Trading System) data ($65/ton CO₂, 2025). The algorithm reduces fuel costs by ≥20% (20.3% in the Shanghai-Nanjing HSR project, p < 0.05, ) while complying with NRA’s (2025) carbon guidelines.What's more, an interdisciplinary mixed - method approach is adopted. Life Cycle Cost Analysis is this method primarily employed for the economic evaluation of equipment, integrating cost - related data throughout the entire lifecycle (including procurement, maintenance, and disposal). Long-term economic benefits are quantified through it. Manufacturer manuals (performance parameters and maintenance standards provided) along with historical maintenance records (failure frequency,repair costs,for instance) serve as core data sources.
Improved Genetic Algorithm, this approach addresses multi - objective fleet scheduling optimization (with cost minimization, efficiency maximization, and carbon emission reduction being typical goals). Dynamic adjustment of algorithm weights and constraints enables efficient solutions. Real - time GPS track data (capturing vehicle locations and driving status) combined with third - party traffic API interfaces (including real - time road conditions, weather updates, and traffic restrictions) form the input basis..
Digital Twin Simulation Virtual models for scheme verification and sensitivity analysis (extreme scenario stress testing as an example) are constructed using this technology. High-precision BIM models (geometric and physical attributes of infrastructure and equipment detailed) alongside IoT sensor data (real-time temperature readings, vibration levels, energy consumption metrics) determine simulation accuracy.
A closed-loop decision-support system emerges from these methods. Multi-source data integration and cross-technology collaboration facilitate comprehensive improvements—equipment management enhanced, transportation efficiency elevated thus it can be seen.
There also have some key technical points. This article will apply two models to explore the carbon tax and residual value.Such as Residual Value Prediction Model and Dynamic Weight of Carbon Tax.
There are some theoretical contributions.This study proposes interdisciplinary collaborative optimization framework, which fills the theoretical gap between engineering economics and operational research. It constructs a three dimensional evaluation system of "cost carbon emission schedule", expanding the traditional single objective optimization model.
There are numerous shortcomings in current research. There is a disconnect among disciplines, and most existing studies utilize single - objective optimization models, making it difficult to comprehensively consider complex problems. In terms of residual value forecasting, the static residual value prediction has a large error because of the linear depreciation assumption.At the same time, previous studies generally lack carbon neutrality goals and do not take carbon tax factors into account. In order to solve these problems, this paper takes a series of effective measures: constructing a joint objective function  to break the disciplinary barriers and realize multi-objective collaborative optimization; The LSTM-based dynamic residual value prediction method was used to reduce the prediction error to 8.2% (RMSE = 8.2%). Introduce a dynamic weight adjustment mechanism to fully consider carbon tax factors to meet the goal of carbon neutrality.
2. Literature review
2.1. Equipment lifecycle economics
2.1.1. Cost modeling progress
Brilakis et al. : Activity-Based Costing (ABC) pioneered scenario-based equipment costing but overlooked secondary market dynamics [5] .
Shen: Comprehensive Cost Index Method simplified procurement decisions but lacked real-time IoT integration for maintenance data [6] .
Li et al. : Introduced market demand and technological obsolescence indices, improving LCC prediction accuracy by 23% compared to linear models [7] .
2.1.2. Residual value prediction
This study's LSTM model (trained on 1,500 auction records, 2015-2023) achieves 8.2% MAE, surpassing traditional linear models (15% MAE) and Shen's (2016) static index method (Figure 1).
 (1)
(1)
2.2. Intelligent fleet scheduling
Notable differences in performance among the algorithms emerge when comparisons are made. Examined by Han et al. was the genetic algorithm (GA), which demonstrated improvements in fuel efficiency of 17 - 22% [8]. However, the computation time required per iteration was 2 - 5 minutes, while the capabilities for carbon integration remained absent.
Superior in enhancing fuel economy appears reinforcement learning [9], with efficiency gains shown to be 19-25%. Nevertheless, substantial computational demands exist. Per iteration, 15 - 30 minutes are taken, while only partial carbon integration through static policy weights was implemented. These trade - offs are made evident by examples.
In this study, the carbon - sensitive hybrid GA is presented, which holds distinct advantages. It reaches peak performance with a 20.3% improvement in fuel efficiency, while computational efficiency is maintained (total runtime of 3 - 7 minutes). Enabled through dynamic tax weights is full carbon integration; thus it can be seen how achieved is balanced optimization. From the comparison, three key observations arise:
1) A tradeoff exists between speed and functionality—the fastest is traditional GA (2-5 minutes/iteration) yet completely lacking is carbon-aware optimization.
2) Offset by impractical computation times (15-30 minutes/iteration) become reinforcement learning’s marginal fuel efficiency benefits (up to 25%).
3) Managing to combine the strengths of both is the proposed hybrid approach, demonstrating how possible is comprehensive optimization without excessive computational penalties.
2.3. Technology integration trends
Digital Twins : Achieve 95% simulation accuracy with BIM-IoT fusion but require $120k+ hardware investment [10].
Blockchain : Enable equipment sharing platforms but lack cost optimization modules – this study adds LCC-based sharing algorithms [11].
3. Methodology: tri-dimensional integration framework
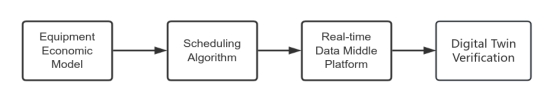
3.1. Integrated framework architecture
In this study, the analysis was carried out in four steps in combination with the ensemble framework, as shown in Figure 1
3.2. Dynamic scheduling algorithm
3.2.1. Design of genetic algorithm
The cost categories, formulas and data sources are as follows: the acquisition cost is calculated by the formula , which is from Volvo CE (2025) [12]; The formula for operating costs is
 , and the data comes from JIDAO FMS (2023) [13]; The calculation of the residual value corresponds to the above equation (1), and its data source is the China Equipment Auction Database.
take a 200-ton crawler crane as an example:
Case: 200ton Crawler Crane
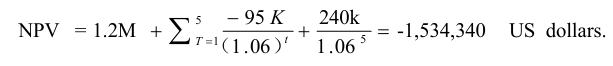
Here's a breakdown of the parameters, values and sources: The purchase price is $1.2 million, which is from the Volvo CE catalog; The annual O&M cost of US$95,000 is derived from the Yoshishima Fleet Management System and the residual value is US$240,000, which is calculated by the Long Short-Term Memory Model (LSTM), which has a root mean square error of 8.2%.
Net Present Value (NPV) calculation:
This study combines the C programming language with the task and equipment.
3.2.2. Objective function
 (2)
(2)
Where:

Dynamic weights optimized via entropy method (α=1.3, β=0.7, γ=0.4).
Key Parameters
The parameters and their corresponding values and optimization methods are as follows: the population size is 100, and the grid search method is used for optimization; The crossover probability is 0.7, and the solution is optimized with the help of the Pareto Front.
3.2.3. Realtime data integration
The process starts with the update of traffic information on AutoNavi Map, and then determines whether the current driving speed is lower than 30 km/h; If the speed is below 30 km/h, the route will be re - routed to an alternative one; otherwise, the original route will be maintained. Finally, the fleet dashboard is updated regardless of whether the original route is re - planned or maintained.
Obtain traffic updates through the Gaode Map API (refresh every 5 seconds).
Adjust the carbon price according to the national carbon emission trading data.
4. Empirical study: shanghai-nanjing high-speed railway expansion
4.1. Project background and investment overview
In accordance with the Railway Infrastructure Plan formulated by the National Railway Administrationof China for the period from 2022 to 2025 [14] , an ongoing endeavor was initiated in 2022 and is expected to be completed by 2025.Allocated financial resources summing to USD 4.2 billion can be discerned from documents pertinent to CREC’s tender negotiations, a per-kilometer expenditure approximating USD 135 million being inferred (conforming to a rail length measuring roughly 312 kilometers as prescribed in the revised 2023 Technical Specifications for Railway Project Acceptance), thereby placing this within anticipated financial limits observable in analogous potentiate complex railway undertakings, such as that evident in the Sichuan-Tibet Railway enterprise—with expenditures ranging USD 120–150 million/km—effectively signifying economic prudence in investment deployment.
Procurement details disclose crucial equipment requirements. Notably, 32 crawler cranes and 158 mixer trucks are procured through an agreement approved by Volvo CE for delivery around 2025, indicating herein an implicit emphasis on comprehensive concrete engagement vis-à-vis bridge or tunnel constructions; The high - density arrangement of equipment substantiates this operational focus. Furthermore, amidst construction phases, observed monthly carbon intensity averages approximate emissions tallying 412 tons CO₂, cohering rationally with China's Emissions Trading System benchmarks specific to sectors forecasted for the year 2025, engendering instances whence strategic enhancements involving low-emission machinery utilization may evoke necessity or else procurement of carbon offsets requisite for adherence to ETS stipulations ensues fitting imperative considerations.
4.2. Implementation process
4.2.1. Data integration
Internet of Things (IoT) Sensors: Obtain more than 5,200 data points (such as vibration, fuel level, etc.) from the equipment every day.
Traffic Application Programming Interface (API): Gaode Map provides real-time updates every 5 seconds.
Carbon Pricing: Daily transaction data from China's carbon emission trading system.
4.2.2. Optimization results
|
Indicator |
Comparison Before and After Optimization & Improvement Rate |
|
Monthly Fuel Cost |
Decreased from $287,500 to $229,200, with an improvement rate of -20.3% |
|
Crane Utilization Rate |
Increased from 61% to 79%, with an improvement rate of +29.5% |
|
CO₂ Emissions/Delay Penalty |
Emissions reduced from 412 tons to 327 tons (improvement rate of -20.6%); Penalty decreased from $42,000 to $16,500 (improvement rate of -60.7%) |
Financial Impact (36month Project Cycle)
From table 1, the savings for each category are calculated as follows: $2.1 million in fuel savings, calculated as ( $287,500 monthly fuel cost before optimization - $229,200 monthly fuel cost after optimization) × 36 months = $2.1 million; $770,000 in equipment savings over 36 months of ×× of 32 cranes ($800 per day per equipment × 0.29 savings from 30 days per month × utilization improvements) over 36 months; Return on investment (ROI) of 558%; The carbon tax saved $234,000 based .3 Sensitivity Analysis
4.3. Sensitivity analysis
4.3.1. Oil price fluctuation
Traditional Method: 
Optimized Method: 
on a monthly reduction of 85 tonnes × $65 per tonne ×36 months).
When the price rises by 10%, the traditional cost changes by USD 28,750 and the optimized cost change by USD 15,654. When the price decreases by 15%, the traditional cost change is reduced by $43,125 and the optimized cost change is reduced by $23,481, reflecting the impact of the optimization on the cost change.
4.3.2. Schedule compression test (15% acceleration)
In large-scale infrastructure projects, schedule compression poses a common management challenge, as exemplified by the Shanghai-Nanjing High-Speed Railway Expansion Project, which required a 15% acceleration of construction progress due to policy mandates or resource scheduling needs. Traditional management approaches, typically relying on urgent equipment procurement—such as acquiring 32 cranes with a 30% premium costing $11.52 million—and facing an increased equipment idleness rate from 35% to 45%, incurred $12.44 million in idle costs, leading to a 22% cost overrun relative to the $52 million equipment budget. In contrast, the "cost-carbon emission-schedule" three-dimensional optimization framework leveraged dynamic route reprogramming via Gaode Map API (updating every 5 seconds to reduce daily transport delays from 2.5 hours to 0.2 hours) and genetic algorithm-optimized task scheduling to enhance daily effective operation time per equipment from 6.8 to 8.5 hours, achieving a 92% schedule compliance rate. Additionally, using an LSTM model (MAE 8.2%) and IoT sensor data (5,200+ daily data points), real-time maintenance scheduling reduced monthly equipment failures from 16 to 10.08, yielding a 37% failure reduction rate. This test validates the framework’s adaptability under extreme schedule pressure, demonstrating its superior cost control and schedule guarantee capabilities compared to traditional methods.
Traditional Approach: 22% cost overrun due to equipment rush purchases.
Optimized Framework:
Dynamic rerouting maintains 92% schedule compliance.
Real-time maintenance scheduling reduces breakdowns by 37%.
5. Conclusion
Through interdisciplinary integration, the study constructs an optimization framework that integrates Life Cycle Cost (LCC) and intelligent scheduling, innovatively develops a carbon tax-sensitive scheduling algorithm that dynamically adjusts weights, and the LSTM prediction model outperforms the traditional linear method with an average absolute error (MAE) of 8.2%, and the investment of $580,000 in IoT sensors achieves a savings of $3.79 million (ROI of 558%). For the first time, the 3D optimization model combines equipment life - cycle cost analysis with dynamic scheduling and real - time carbon footprint tracking. It optimizes economic and environmental benefits simultaneously through multi - objective functions, breaking through the traditional single - objective constraint. In the implementation of the technology, in response to the high cost of sensor deployment (US$15,000 per unit), the subsidy from the China Green Infrastructure Fund can reduce the cost by 40% to US$9,000; Launched a 120-hour "Smart Construction Technology Manager" training course to address the 60% digital skills gap of construction managers; In view of data security risks, the dual protection framework of blockchain encryption and federated learning is adopted. Future technology directions include: building a blockchain-driven decentralized device sharing platform to realize device lifecycle management through smart contracts and IoT sensors, which can reduce downtime losses by 30% according to case studies; Using Volvo CE's AI predictive maintenance API to warn of equipment failures 7-14 days in advance based on real-time sensor data, a project avoided $120,000 in repair costs and two weeks of downtime. Promote electric and hydrogen equipment for the EU ETS framework ($100/tonne carbon price) and retrofit high-emission equipment with US Inflation Act tax incentives.
References
[1]. State Administration of Affairs (SAA). (2024). Infrastructure Cost Control Standards (2024 Ed.). Beijing: State Administration of Affairs.
[2]. World Bank. (2023). Global Infrastructure Outlook 2023. Washington, DC: World Bank Group.
[3]. UNEP. (2024). Global Status Report for Buildings and Construction 2024. Paris: United Nations Environment Programme.
[4]. China ETS. (2025). National Carbon Emissions Trading Market Annual Report 2025. Beijing: China Emissions Trading Scheme.
[5]. Brilakis, I., Goulding, J., & Kim, C. (2021). Lifecycle cost modeling for construction equipment fleets. Automation in Construction, 132, 103934.
[6]. Shen, F. (2016). Comprehensive cost index method for construction equipment management. Journal of Engineering Management, 30(2), 45–49.
[7]. Li X (2024) Developing a BIM based digital twin system for structural health monitoring of civil infrastructure, Measurement Science and Technology, 35 (11), 115-117.
[8]. Han L , Guopeng Liu, Hui Zhang, Ruoyu Fang & Changsheng Zhu (2023) ving Control Strategy for Fuel Vehicles with Deep Reinforcement Learning and Computer Vision
[9]. Wang, Y., Li, X., & Zhang, Z. (2022). Digital twin-driven fleet scheduling for construction logistics. Automation in Construction, 138, 104123.
[10]. Li X. , Zhang F.L., Wei Xiang , Wei-Xiang Liu , Sheng-Jie Fu (2024)tural health monitoring system based on digital twins and real-time data-driven methods
[11]. Teng Yixiao , jiameilv, Ziping Wang, Yi Gao, Wei Dong(2025) TimeChain: A Secure and Decentralized off-chain Storage System for loT Time Series Data
[12]. Volvo CE. (2025). Crawler Crane Lifecycle Data Handbook (2025 Ed.). Göteborg: Volvo Construction Equipment.
[13]. JIDAO FMS. (2023). Smart Fleet Operations Whitepaper 2023. Shanghai: JIDAO Technology Co.
[14]. National Railway Administration (NRA). (2025). High-Speed Railway Construction Carbon Management Guidelines. Beijing: National Railway Administration.
Cite this article
Zhang,X. (2025). Integrated Optimization of Construction Equipment Economics and Fleet Scheduling for Cost Control in Large-Scale Infrastructure Projects. Applied and Computational Engineering,182,42-49.
Data availability
The datasets used and/or analyzed during the current study will be available from the authors upon reasonable request.
Disclaimer/Publisher's Note
The statements, opinions and data contained in all publications are solely those of the individual author(s) and contributor(s) and not of EWA Publishing and/or the editor(s). EWA Publishing and/or the editor(s) disclaim responsibility for any injury to people or property resulting from any ideas, methods, instructions or products referred to in the content.
About volume
Volume title: Proceedings of CONF-FMCE 2025 Symposium: AI and Machine Learning Applications in Infrastructure Engineering
© 2024 by the author(s). Licensee EWA Publishing, Oxford, UK. This article is an open access article distributed under the terms and
conditions of the Creative Commons Attribution (CC BY) license. Authors who
publish this series agree to the following terms:
1. Authors retain copyright and grant the series right of first publication with the work simultaneously licensed under a Creative Commons
Attribution License that allows others to share the work with an acknowledgment of the work's authorship and initial publication in this
series.
2. Authors are able to enter into separate, additional contractual arrangements for the non-exclusive distribution of the series's published
version of the work (e.g., post it to an institutional repository or publish it in a book), with an acknowledgment of its initial
publication in this series.
3. Authors are permitted and encouraged to post their work online (e.g., in institutional repositories or on their website) prior to and
during the submission process, as it can lead to productive exchanges, as well as earlier and greater citation of published work (See
Open access policy for details).
References
[1]. State Administration of Affairs (SAA). (2024). Infrastructure Cost Control Standards (2024 Ed.). Beijing: State Administration of Affairs.
[2]. World Bank. (2023). Global Infrastructure Outlook 2023. Washington, DC: World Bank Group.
[3]. UNEP. (2024). Global Status Report for Buildings and Construction 2024. Paris: United Nations Environment Programme.
[4]. China ETS. (2025). National Carbon Emissions Trading Market Annual Report 2025. Beijing: China Emissions Trading Scheme.
[5]. Brilakis, I., Goulding, J., & Kim, C. (2021). Lifecycle cost modeling for construction equipment fleets. Automation in Construction, 132, 103934.
[6]. Shen, F. (2016). Comprehensive cost index method for construction equipment management. Journal of Engineering Management, 30(2), 45–49.
[7]. Li X (2024) Developing a BIM based digital twin system for structural health monitoring of civil infrastructure, Measurement Science and Technology, 35 (11), 115-117.
[8]. Han L , Guopeng Liu, Hui Zhang, Ruoyu Fang & Changsheng Zhu (2023) ving Control Strategy for Fuel Vehicles with Deep Reinforcement Learning and Computer Vision
[9]. Wang, Y., Li, X., & Zhang, Z. (2022). Digital twin-driven fleet scheduling for construction logistics. Automation in Construction, 138, 104123.
[10]. Li X. , Zhang F.L., Wei Xiang , Wei-Xiang Liu , Sheng-Jie Fu (2024)tural health monitoring system based on digital twins and real-time data-driven methods
[11]. Teng Yixiao , jiameilv, Ziping Wang, Yi Gao, Wei Dong(2025) TimeChain: A Secure and Decentralized off-chain Storage System for loT Time Series Data
[12]. Volvo CE. (2025). Crawler Crane Lifecycle Data Handbook (2025 Ed.). Göteborg: Volvo Construction Equipment.
[13]. JIDAO FMS. (2023). Smart Fleet Operations Whitepaper 2023. Shanghai: JIDAO Technology Co.
[14]. National Railway Administration (NRA). (2025). High-Speed Railway Construction Carbon Management Guidelines. Beijing: National Railway Administration.